ArcGIS Data Pipelines is a new ArcGIS Online application that allows you to access, process, and integrate data from a wide variety of sources. It offers an intuitive drag-and-drop interface where you can create reproducible data preparation workflows without writing any code.
At this year’s Developer Summit plenary, Max Payson offers a glimpse of what can be accomplished with ArcGIS Data Pipelines.
As an analyst at a retail company, Max is tasked with aggregating relevant datasets that can help identify possible locations for new stores in New York City. He has two datasets to work with: the first is a report categorizing different levels of pedestrian demand, and the second is data on open streets, which are streets transformed into public spaces for various activities. The former dataset is stored in his organization’s Amazon S3 bucket, while the latter is public data accessible via URL. Together, these datasets can help visualize foot traffic in streets across the city.
Max shows a data pipeline that’s configured to do the following:
- Connect directly to the pedestrian mobility dataset stored in the Amazon S3 bucket and create a geometry field using well-known text (WKT) values. The resulting geometry serves as the target dataset for the join.
- Read the open streets locations data using the public URL and create a new dataset containing only pertinent fields. The resulting dataset serves as the join dataset.
- Join the target and join datasets in a one-to-many relationship based on matching field values.
- Create a unified streets feature layer based on the join results.
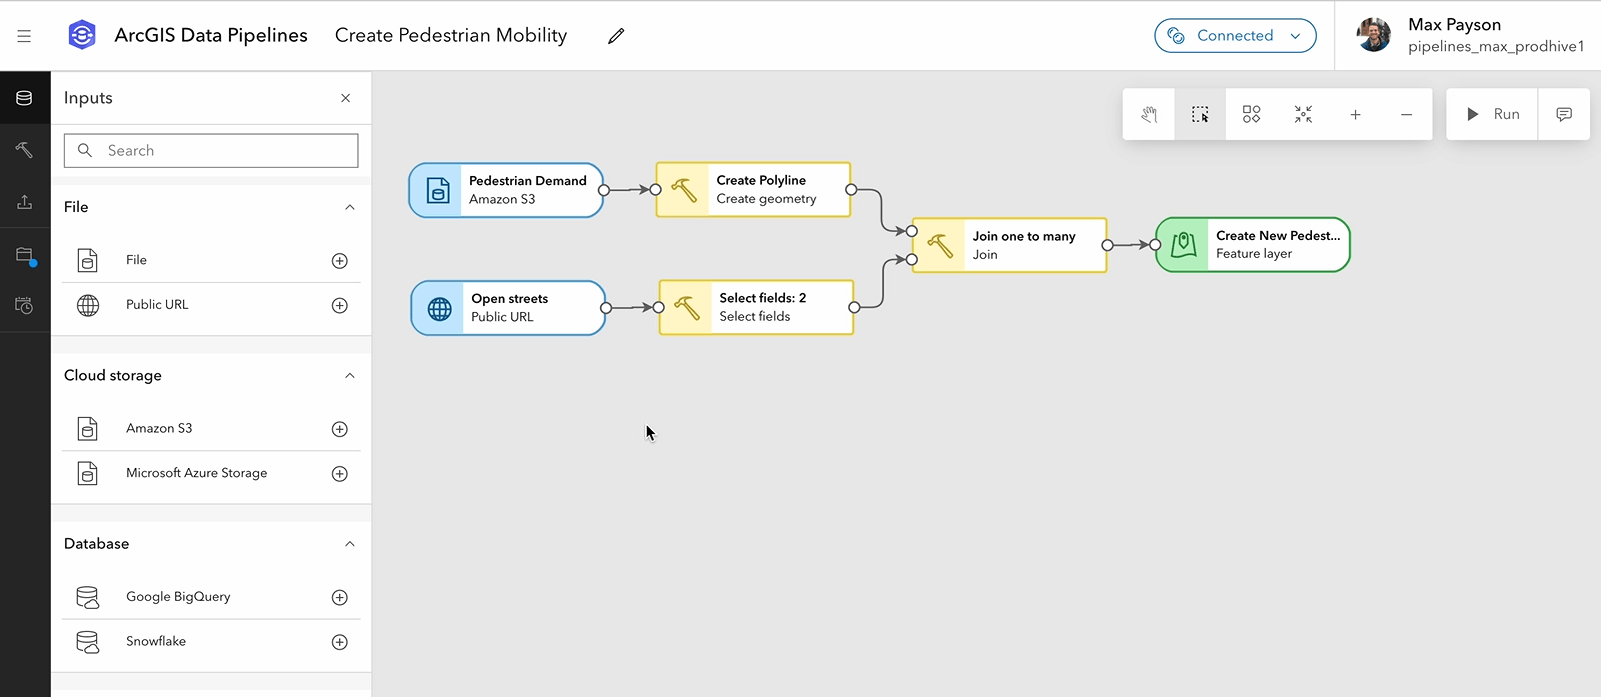
Max runs the data pipeline and, within seconds, obtains a feature layer with approximately 14000 records.
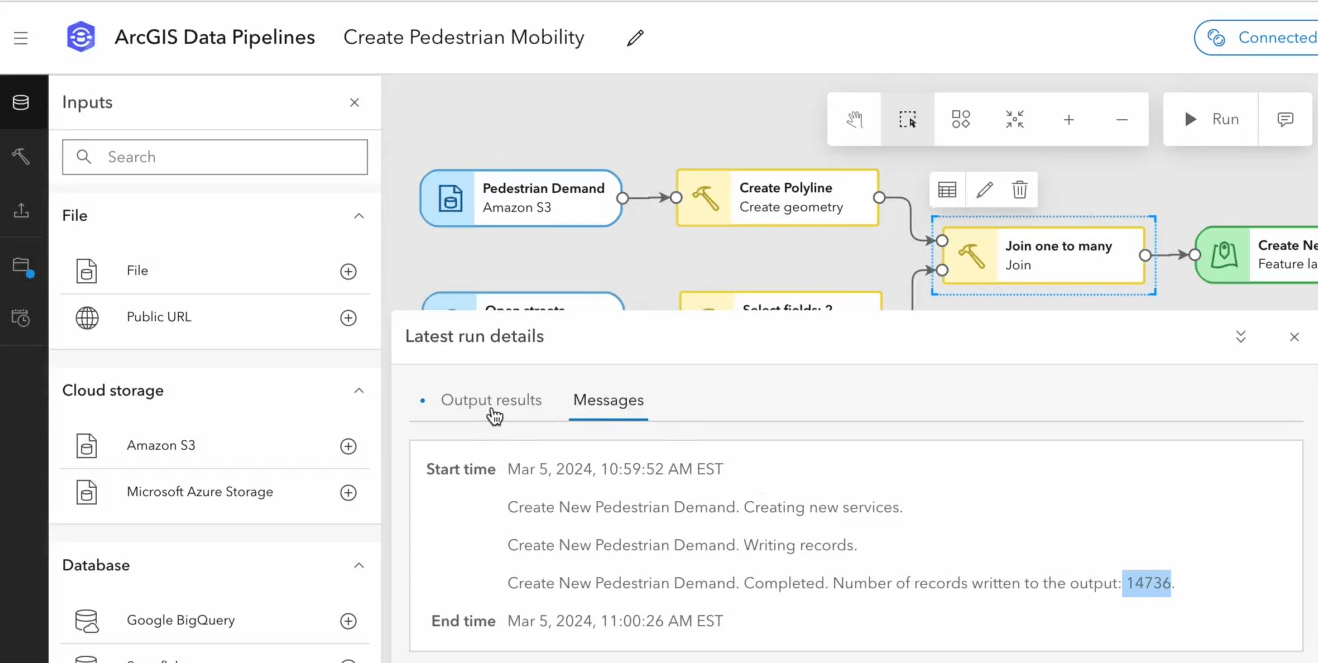
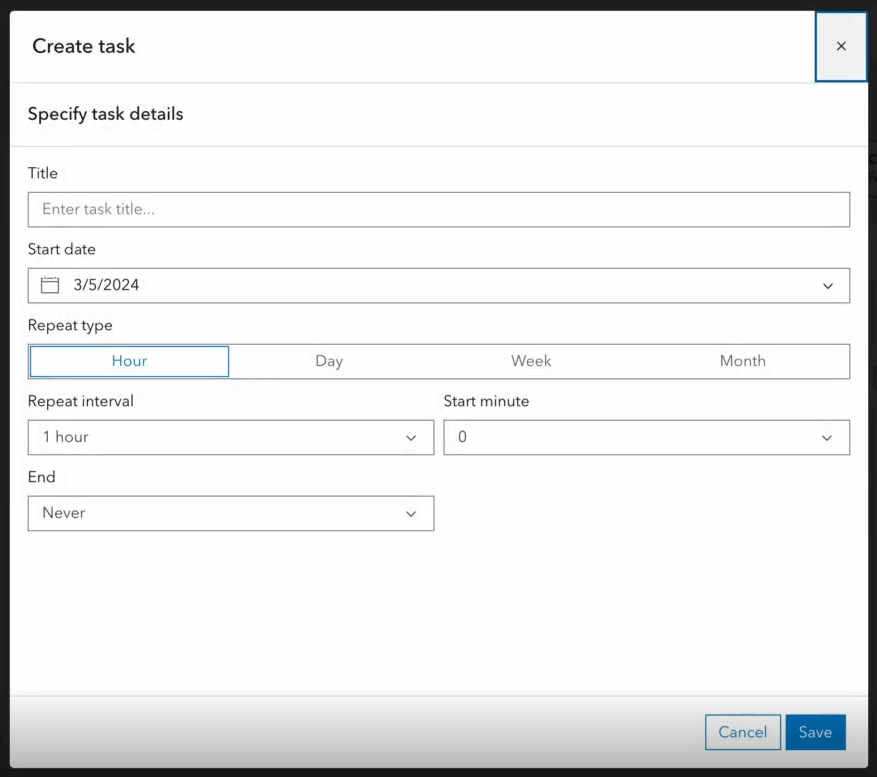
Since the NYC Open Data team updates the dataset of open street locations monthly, Max explores two options to keep his feature layer data up-to-date with minimal intervention. First, he shows the scheduling feature built into ArcGIS Data Pipelines, which lets you create scheduled tasks that run once or on a recurring basis.
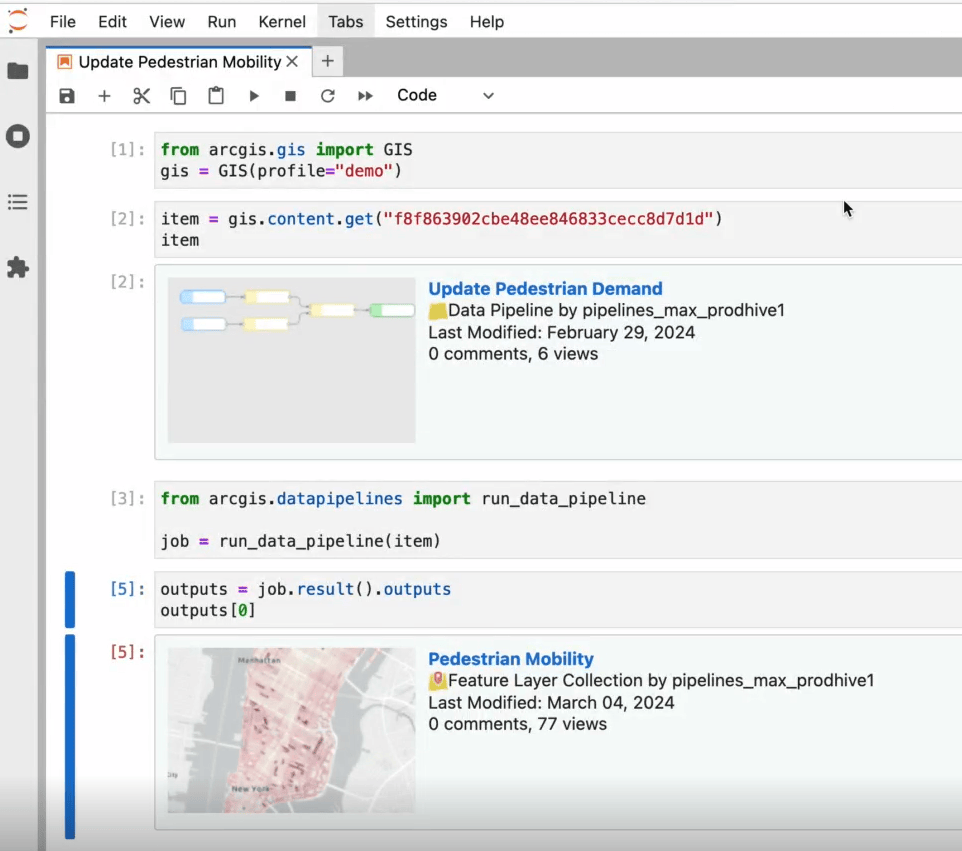
Next, he shows a Jupyter notebook that utilizes ArcGIS API for Python to update his feature layer data programmatically. The notebook sequentially performs the following operations: fetch the data pipeline item using the gis.content.get() method, run the pipeline using the run_data_pipeline() method, get the result using the result() method, obtain the required output from the result by accessing its outputs property, and extract the new feature layer from the output array.
Note that Data Pipelines in the Python API is still in the experimental phase and not yet available for use in ArcGIS Notebooks. To use Data Pipelines in the Python API locally, you must install ArcGIS API for Python version 2.3.0 when it becomes available.
With the feature layer already hosted on ArcGIS Online, Max quickly visualizes it to show that streets across the city have been categorized based on pedestrian mobility demand, emphasizing the open streets.
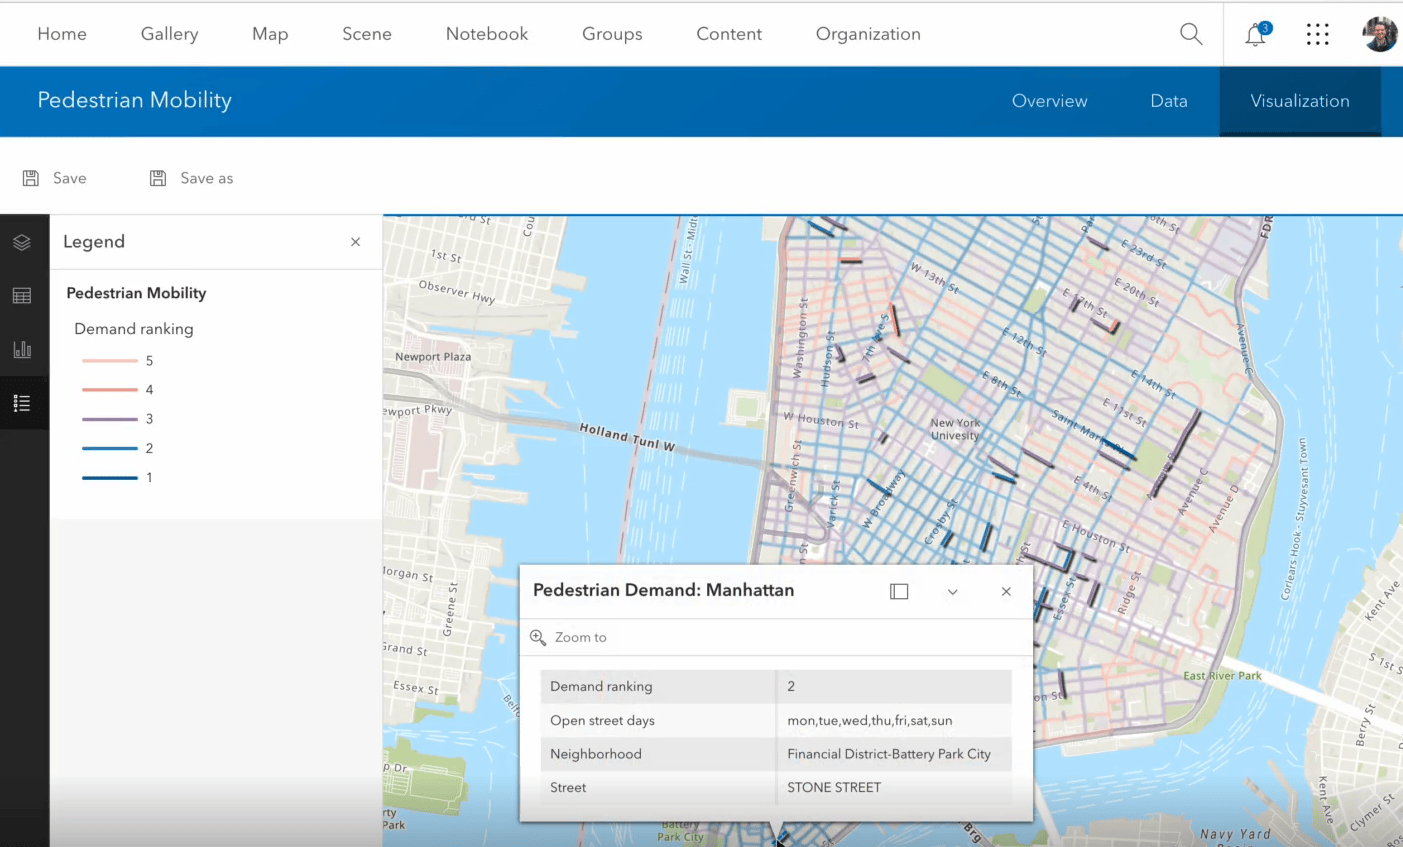
Using ArcGIS Data Pipelines, Max seamlessly filtered and enhanced datasets from two disparate sources to produce data that others in his organization can leverage in their site selection workflows. To learn more about Data Pipelines, visit the product page or check out the ArcGIS Data Pipelines is Now Available blog.


Commenting is not enabled for this article.