ArcGIS Scene Viewer continuously improves the ease of use and capabilities to analyze the built and natural environment. With the latest February release, we are introducing new capabilities to help you interactively analyze your 3D content through new perspectives, improved accuracy and better visualization.
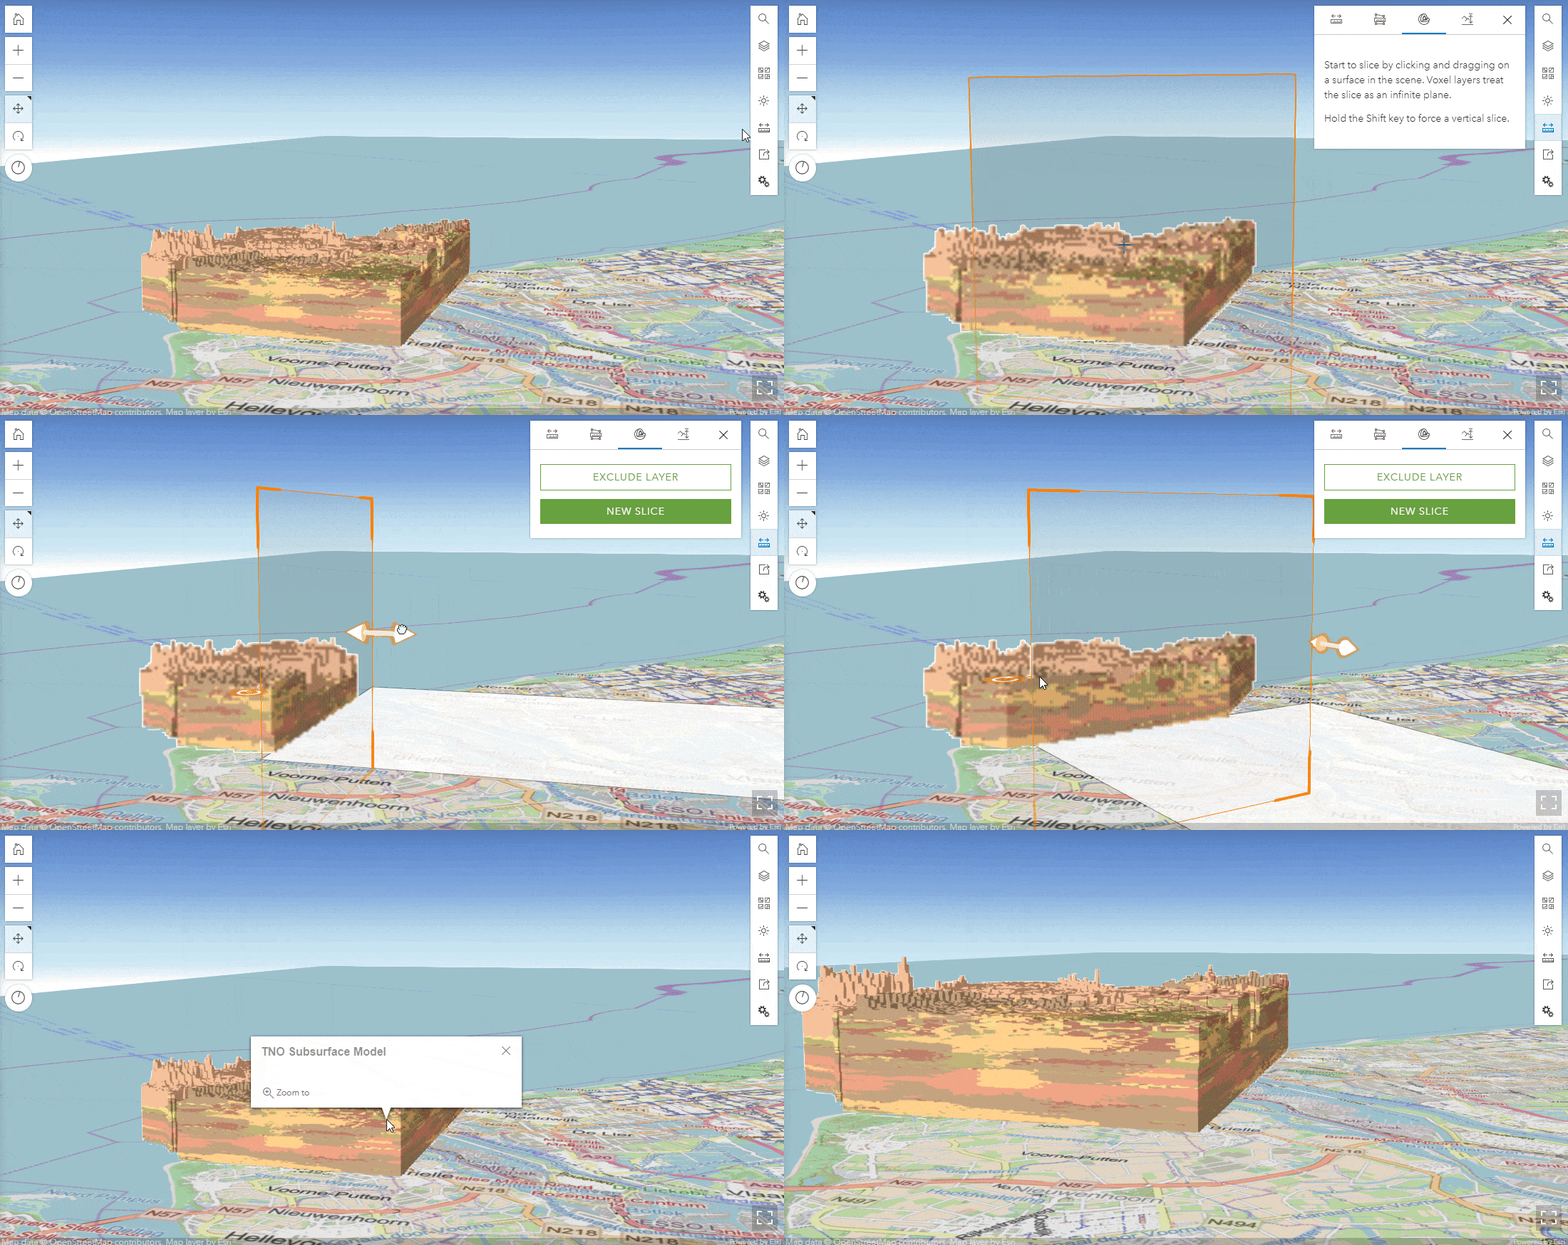
New perspectives – Use Slice tool to analyze your voxel layer
Voxel layer was brought to Scene Viewer last year. Read the blog to learn more. This is a crucial feature to help reveal complex multi-dimensional data in a browser. Starting from this release, you can use the slice tool to explore and analyze your voxel data further. Reveal hidden patterns using vertical and horizontal slices for the entire extent of the volume. The newly added pop-ups provide even more information on individual voxels in the data set.

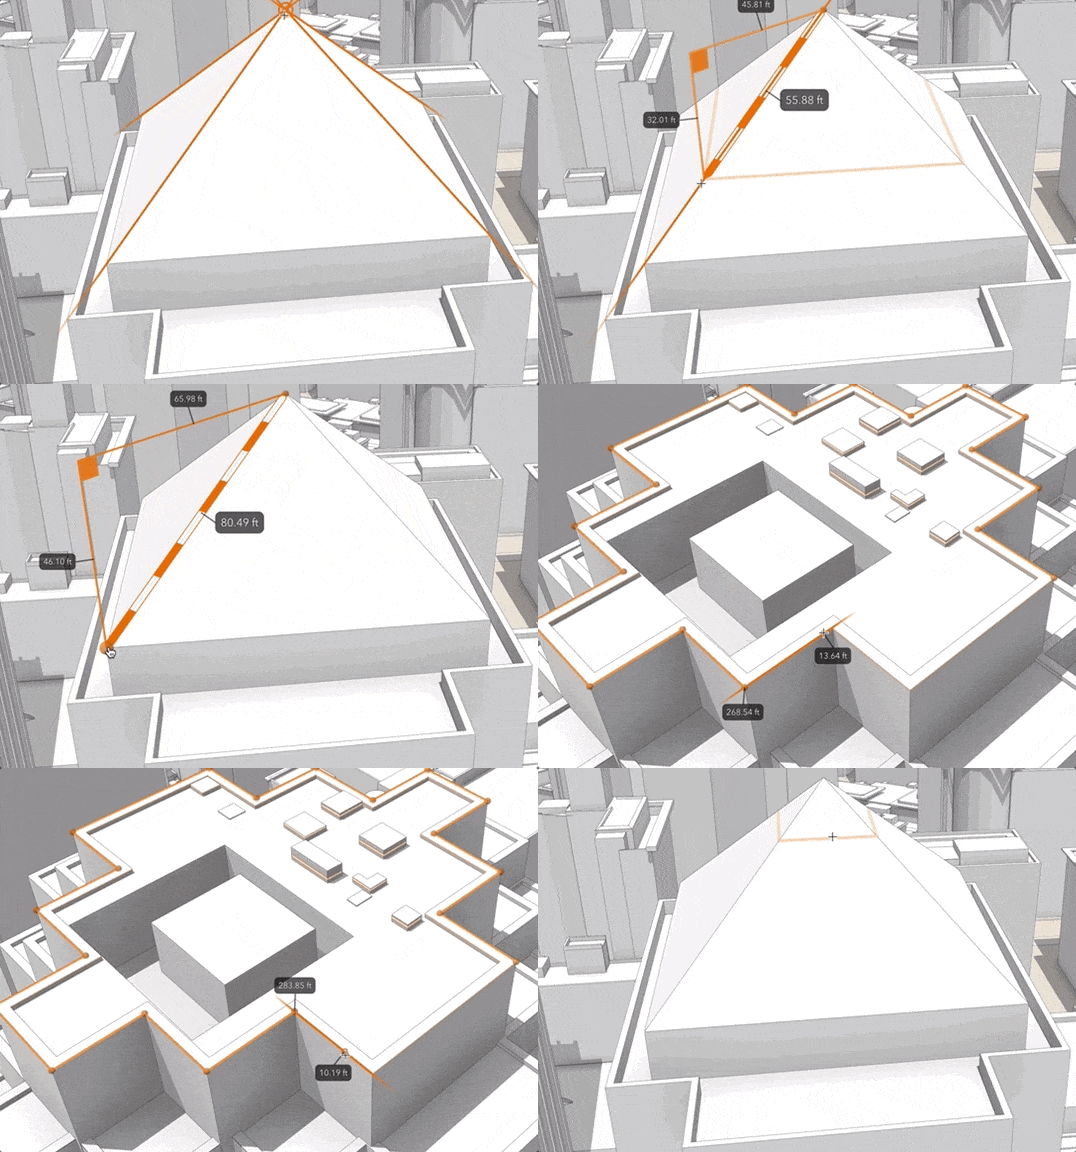
Improved accuracy – Snap to features while measuring in Scene Viewer
We have been continuously improving the user experience of editing and analyzing. This now includes snapping to feature while measuring in Scene Viewer for the Direct Line Measurement and Area Measurement 3D tools. Along with Dimension tool, Scene Viewer provides an experience to accurately and explicitly measure the length of a bridge or identify the area of a rooftop garden.

Tip: Hold the Ctrl key, if you want to temporarily disable snapping.
Other enhancements
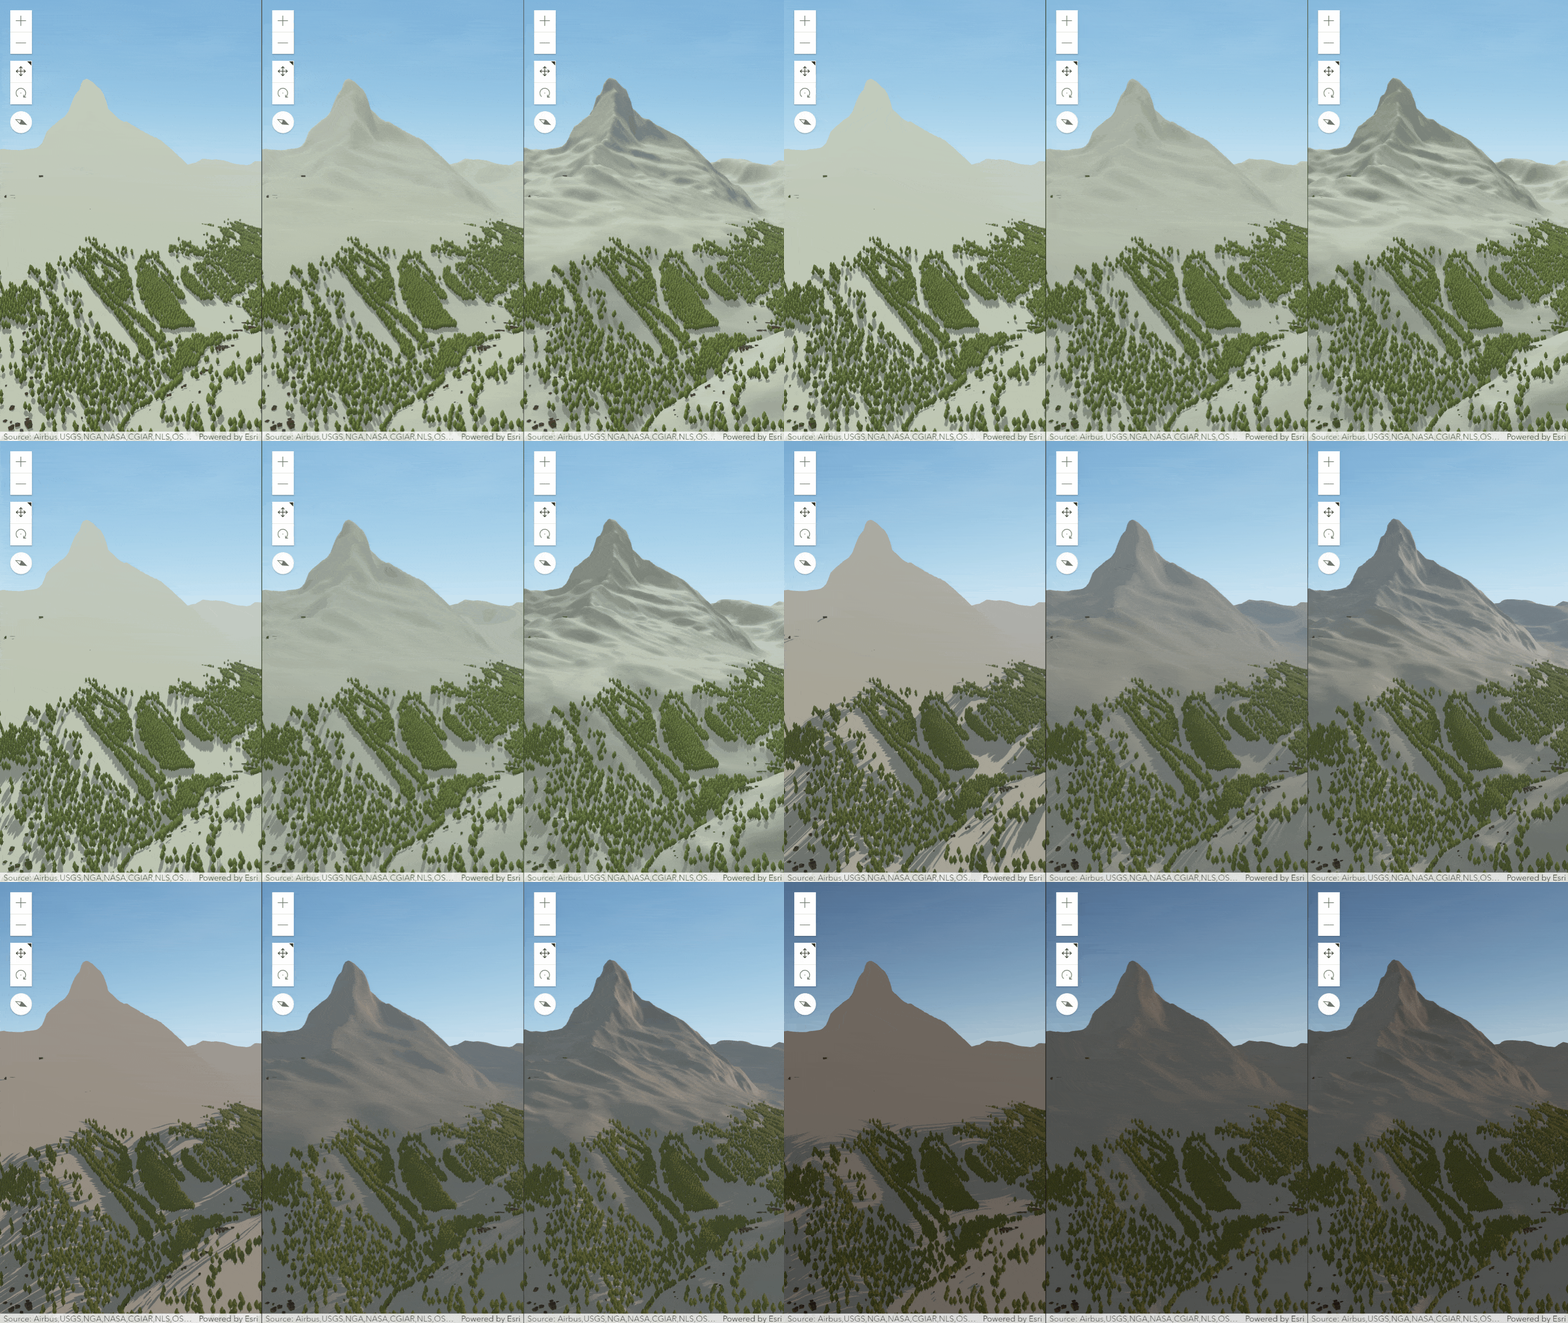
Over the past few years, visual quality has been one of our top priorities. In this release, terrain is improved with enhanced shading and higher elevation resolution, which will allow a better visual representation of hills, mountains, and even ski resorts.

In this release, Scene Viewer also allows you to append custom request parameters for supported layers. You can add them when adding a layer via URL or edit your parameters in the layer properties panel.
Do give it a try and let us know what you think. If you will be at 2023 Dev Summit, come and join the Scene Viewer session at March.7th, 2:30PM.

We look forward to meeting you soon!

Is there a way to access older NAIP imagery through the Living Atlas, or does it only provide the most recent imagery? We are mostly interested in NAIP imagery over shallow water coastal areas and water clarity usually determines the usefulness of the imagery. I am trying to determine if there is a straightforward way to cycle through and select from mulitple iterations of the biennial NAIP imagery. Thanks – Tom
Hi Tom, you can use the Living Atlas NAIP image layers noted in this article to cycle through the years back to 2010.
Natural Color – https://www.arcgis.com/home/item.html?id=3f8d2d3828f24c00ae279db4af26d566
Color Infrared – https://www.arcgis.com/home/item.html?id=e4da3b6720f545aeaaf3fe8141da1e21
NDVI – https://www.arcgis.com/home/item.html?id=aa9c87d6f17b452296252bd75005f6a4
NOTE: If you are working in Online, you will likely want to use the ‘Image Filter’ capability available for image layers in Map Viewer Classic (the new Map Viewer does not yet have the ‘Image filter’ capability).
Hope this helps! – Rob
Is the metadata layer the same for both NAIP Imagery and NAIP Imagery Natural Color? If not, is there a metadata layer for Natural Color?