The Group on Earth Observations Global Water Sustainability (GEOGLOWS) initiative has recently upgraded its global streamflow model to version two. The GEOGLOWS 10-Day forecast layer is now available in Living Atlas. GEOGLOWS is a comprehensive streamflow model dataset, its forecast provides data in three-hour intervals for the next 10 days. The streamflow predictions in GEOGLOWS are generated using an ensemble approach, where runoff data from the European Centre for Medium-Range Weather Forecasts (ECMWF) is used as input and routed using the RAPID model. The implementation of GEOGLOWS is carried out by the hydroinformatics group at Brigham Young University (BYU).
In GEOGLOWS version two, the coverage has been expanded to 7 million river reaches, from around 1.2 million reaches in version one. GEOGLOWS now provides information for a larger number of locations. The underlying hydro fabric network was derived from the National Geospatial-Intelligence Agency’s (NGA) TDX-hydro dataset.
Updates in GEOGLOWS 2.0
The GEOGLOWS 2.0 forecast in Living Atlas includes improvements such as (1) river names from Open Street Map, (2) multi-level river features, (3) symbology using return periods, (4) customizable filters for geographic regions, and (5) river forecast plots using ArcGIS Instant Apps.
1. River names from Open Street Map
GEOGLOWS 2.0 now includes river names from Open Street Map in its pop-up. After clicking on a river reach, its geometry is intersected on-the-fly with the Open Street Map waterways layers in Living Atlas to retrieve the river name.
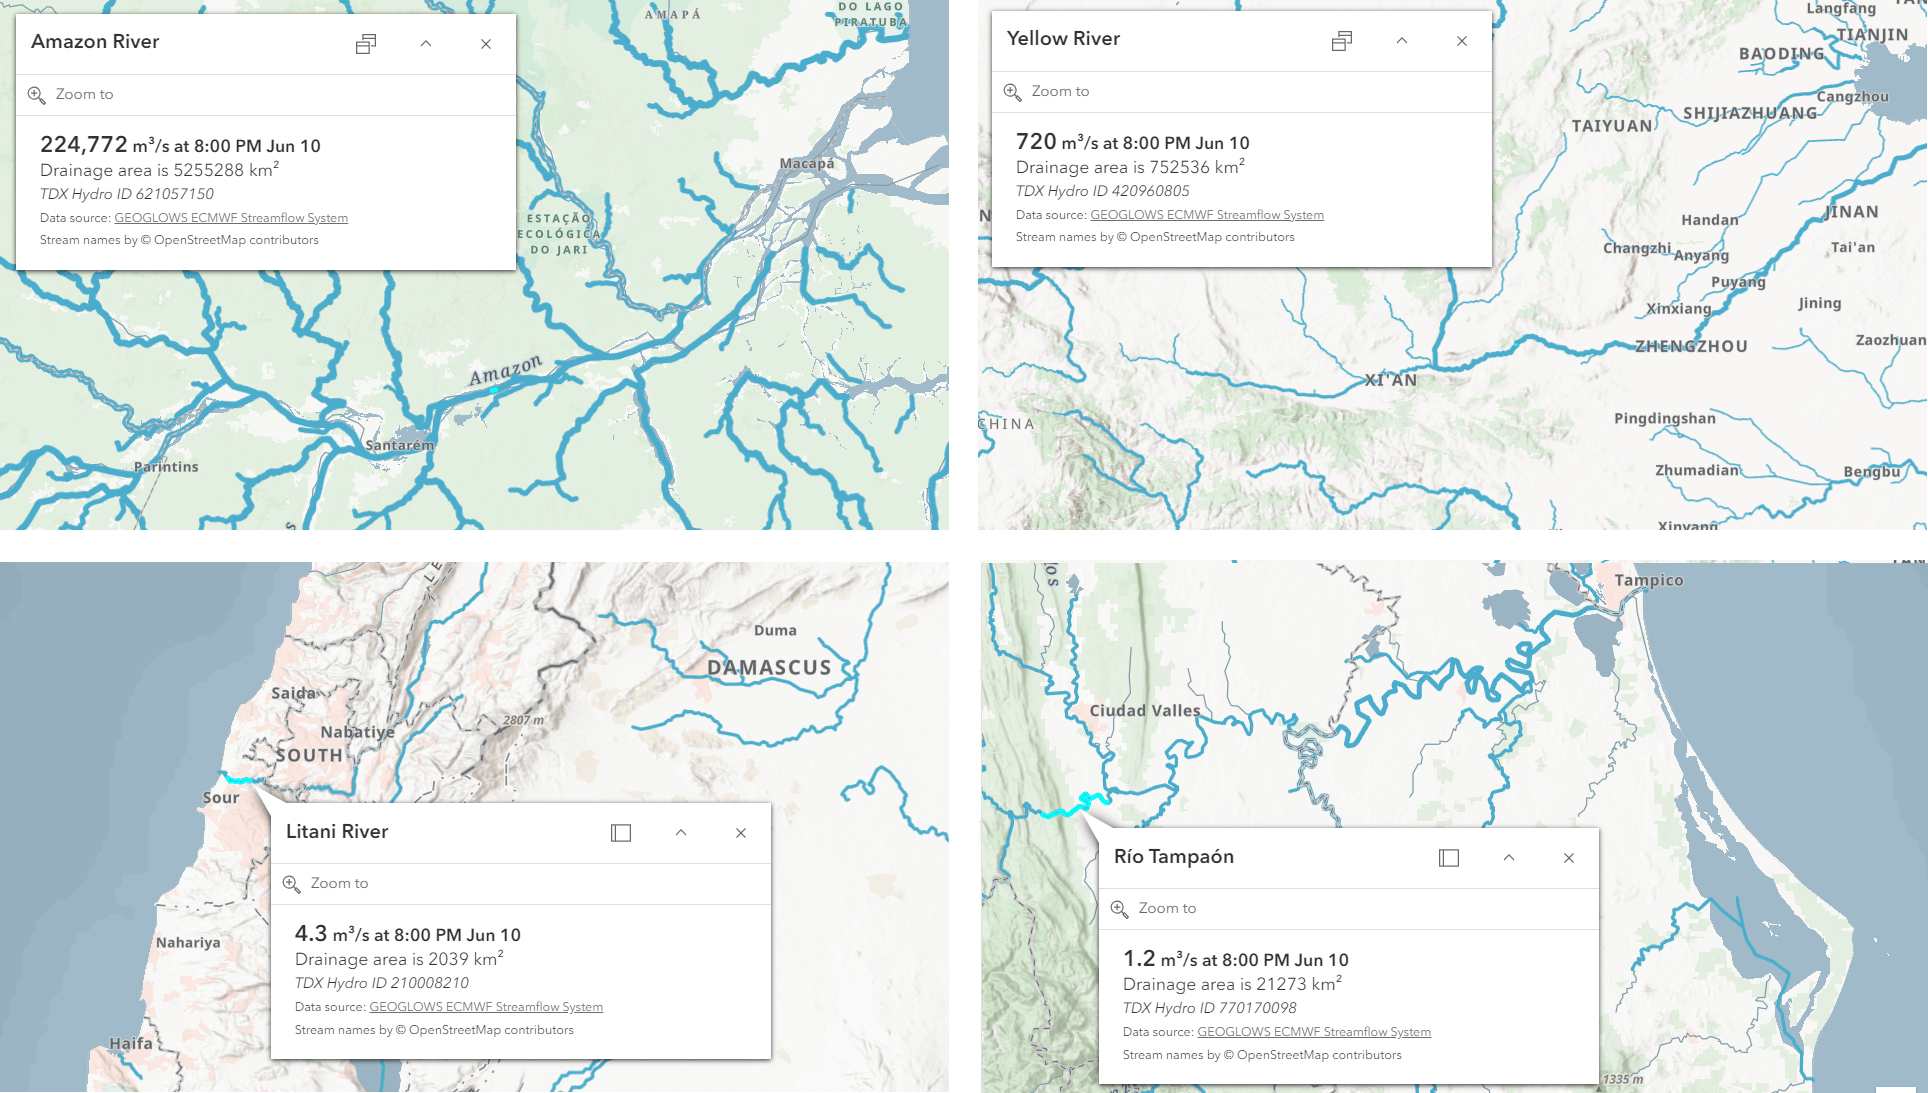
This means that river names will be updated automatically in the GEOGLOWS service directly from Open Street Map. If missing river names are added into the main Open Street Map database, those will be display in the GEOGLOWS 2.0 pop-up after a few hours.
2. Multi-level river features
The GEOGLOWS 2.0 service is highly responsive due to the updated publishing workflow used behind the scenes. The GEOGLOWS layer was created using a scale dependent data source query layer, displaying generalized features for small scales and the original features at large scales. The GEOGLOWS layer is scale dependent, showing only the most prominent rivers at small scales and displaying more river features and smaller tributaries at large scales.
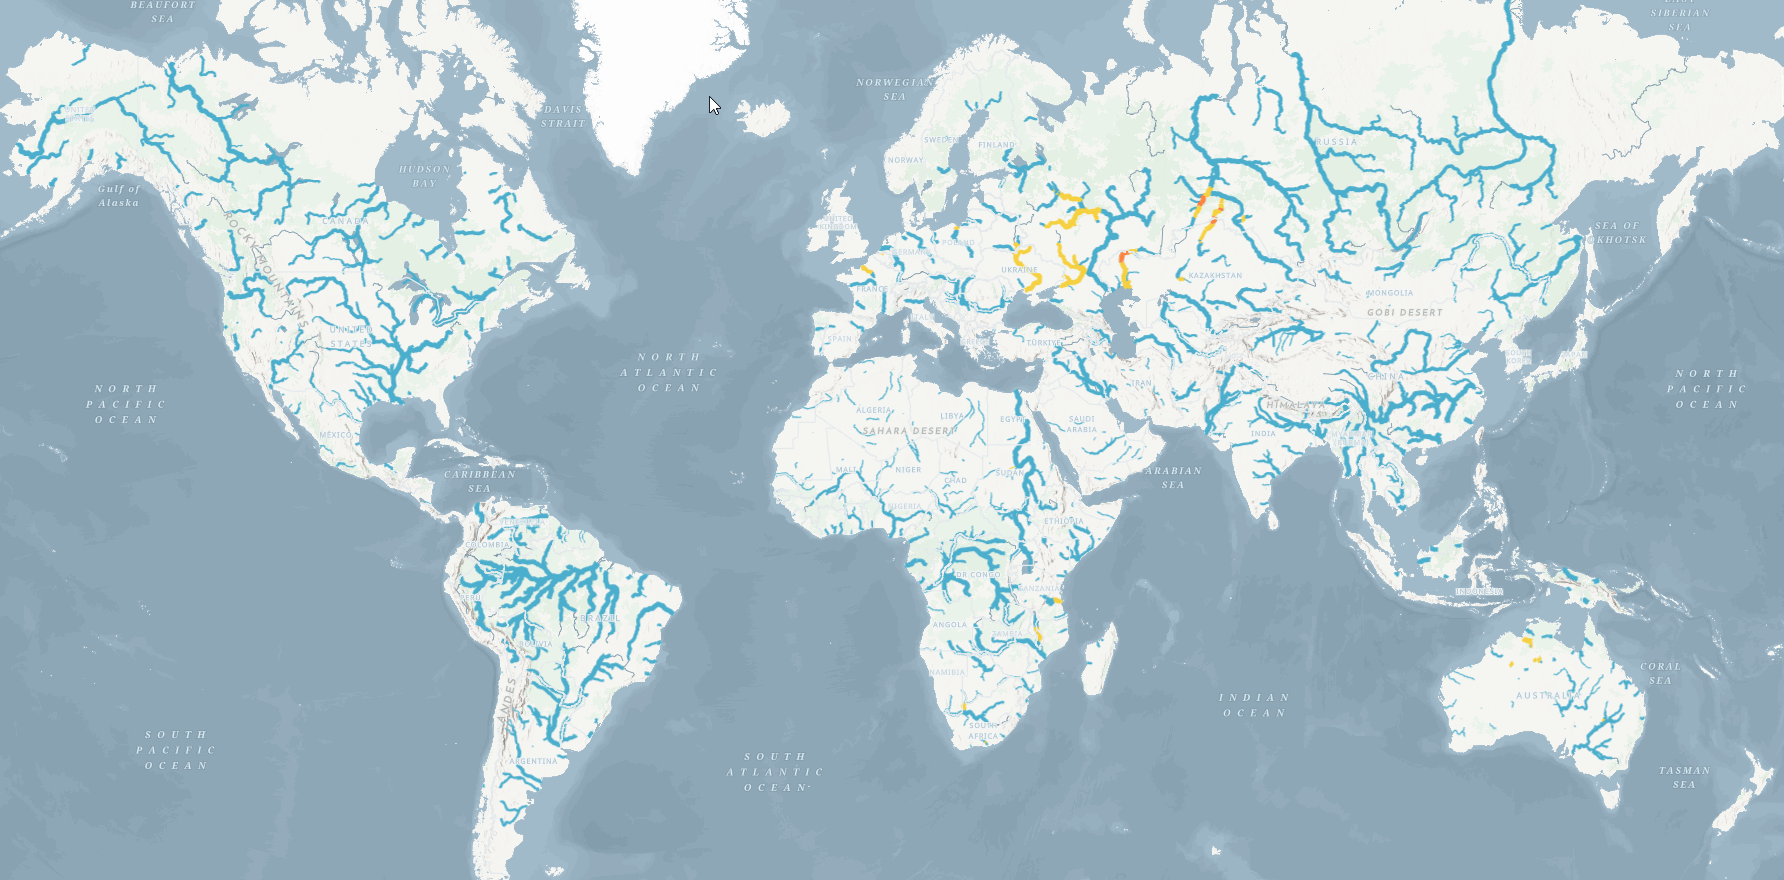
3. Symbology using return periods
The GEOGLOWS layer is symbolized using the return periods for each river reach. The return periods are directly related to the annual probability of exceedance. In essence, the return periods show how extreme a given streamflow forecast is compared to the historical simulation. Normal or expected flows (blue) are shown in a different classification from flows that exceed the 2 year (yellow), 10 year (orange), 25 year (red), and 50 year (purple) return periods.
Moreover, the selected color ramp works well on different basemaps from the classic topo map to imagery or dark themes.
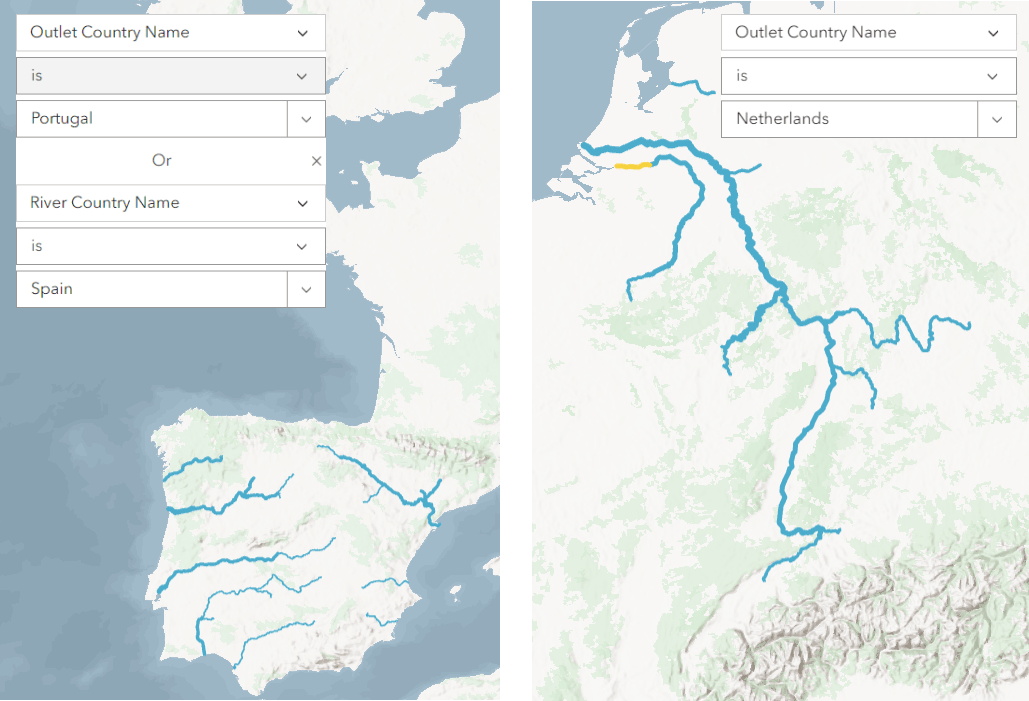
4. Customizable filters for geographic regions
The updated GEOGLOWS 2.0 service includes fields to create custom maps for different geographic regions. The fields such as River Country Name, Outlet Country Name, TDX Hydro Region Number, or Terminal TDX Hydro Link Number can be used to apply a filter and subset the data set.
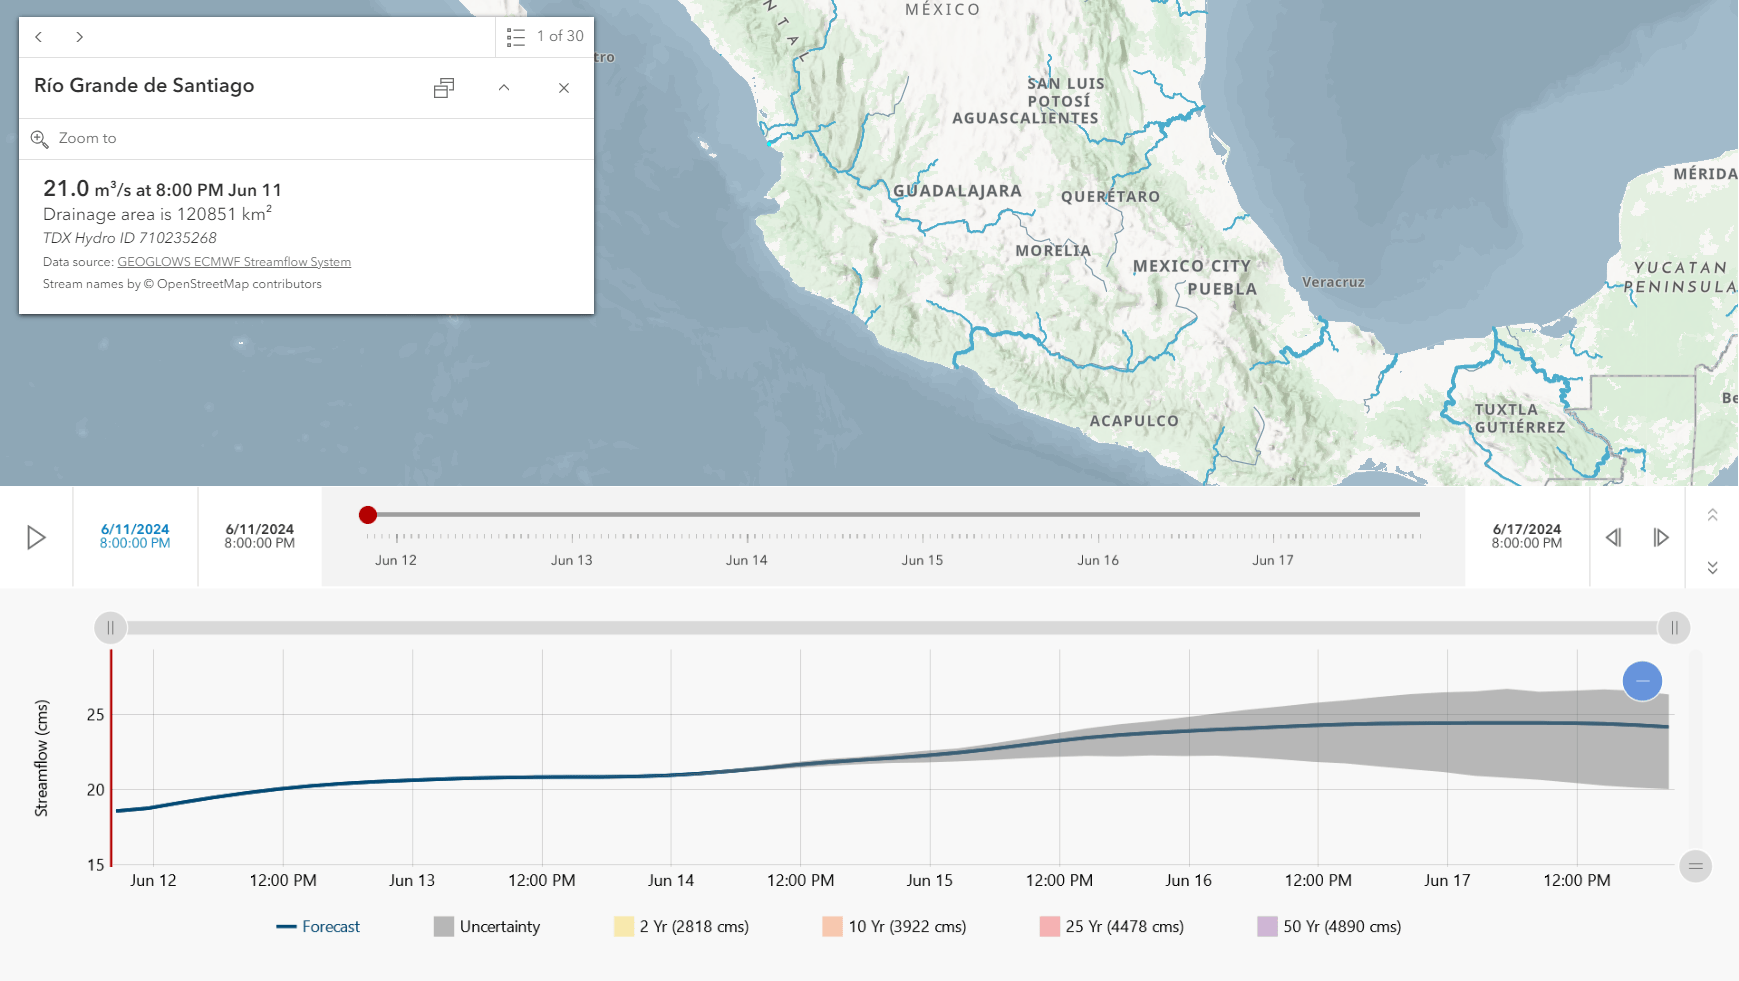
5. River forecast plots using ArcGIS Instant Apps
The GEOGLOWS service is part of the upcoming Streamflow Viewer template of the ArcGIS Instant Apps. The streamflow viewer template can be used to create an app that includes an interactive plot of the GEOGLOWS forecast, showing the variation of streamflow over time.
Summary
GEOGLOWS 2.0 is a comprehensive streamflow model, its forecast in Living Atlas provides river flow information in three-hour intervals for the next 10 days for around 7 million reaches. The GEOGLOWS Living Atlas layer is a multi-scale service, it displays river names from Open Street Map, can be customized for any geographic region, and the forecast can be plotted using ArcGIS Instant Apps.
More Information?
Visit the official GEOGLOWS service webpage, review the GEOGLOWS data guide, or join the GEOGLOWS user group.
Interested in water resources and GIS? visit the Esri Water Resources industry page or join the Esri Community and ask questions to our experts.


Article Discussion: