An improved version of the USGS/MRLC National Land Cover Database in the Living Atlas, providing the ability to map and analyze land use patterns since 2001.
It’s no surprise to say that the landscape of U.S. has experienced dramatic changes in some areas since the beginning of the 21st Century – but it’s been difficult to consistently quantify just how much things have changed.
Until now.
For years, the Living Atlas has included a few analyses from the National Land Cover Database, developed by the Multi-Resolution Land Cover Characteristics Consortium (MRLC) – a group of federal agencies, led by the USGS, and tasked with using remote sensing to analyze land cover changes across the nation. However, there has not been a seamless timeseries of this data for detailed analysis. This year, MRLC released a timeseries of harmonized data, and this new generation of NLCD is now available in the Living Atlas.
Developing this new generation of NLCD was no trivial effort. It required reprocessing terabytes of multi-spectral imagery from the USGS Landsat satellite missions for each year and applying the same methodology across the 2001-2016 analysis period. This reprocessing makes the data infinitely more usable, since individual years can be compared, unlike in previous versions.
The results speak for themselves.
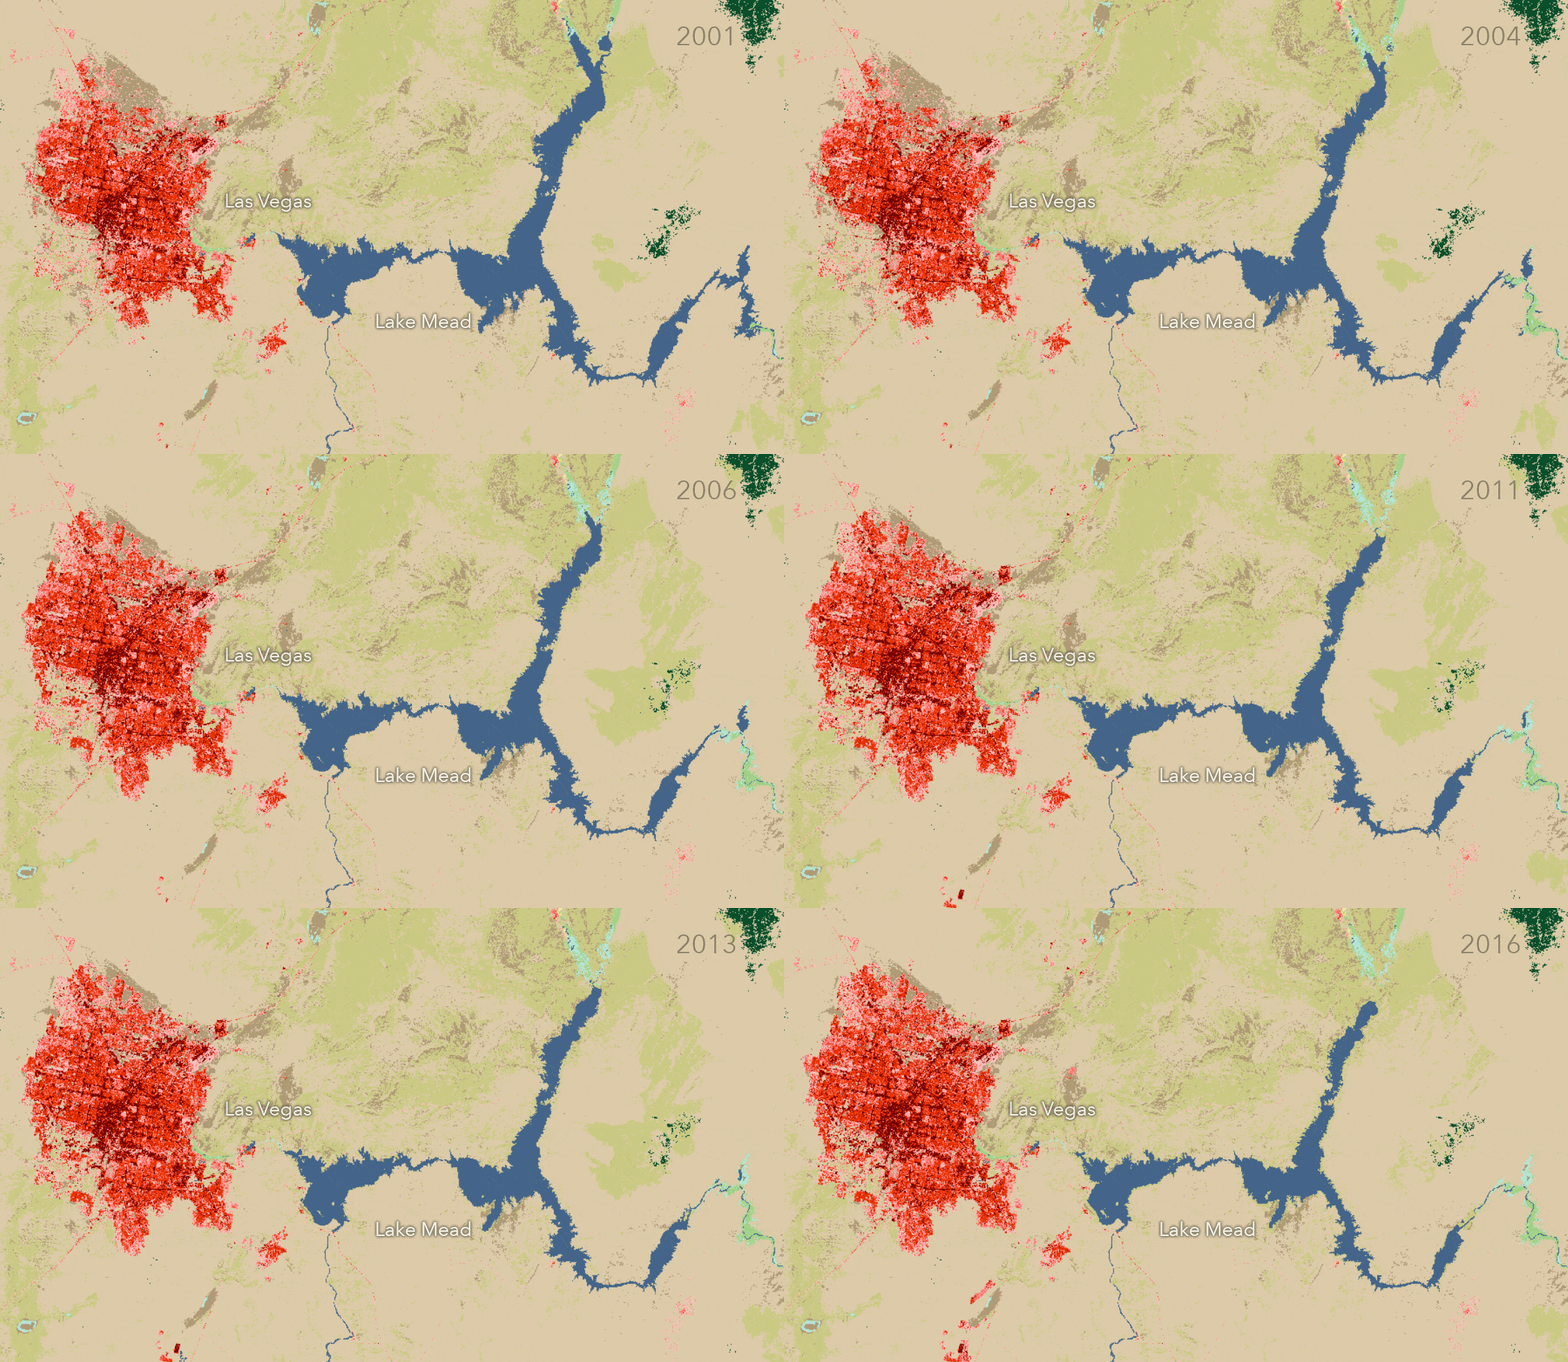
The rapid growth of Las Vegas over the last few decades is well known, as is the decline in water levels of nearby Lake Mead. However, this timeseries really puts the relationship into context. Notice the asynchronous expansion of the former and contraction of the latter in subsequent years.
By isolating the Open Water classification for the two years we can see just how much Lake Mead changed:
- Open the Layer Properties and create a definition query for the year 2001.
- Run Copy Raster to download the area of interest.
- Edit the definition query to be 2016 and re-run Copy Raster.
To perform a quick calculation on the change in area:
- Open the Attribute Table for 2001.
- Create a new field called ‘hectare’.
- Run the Calculate Field geoprocessing tool and using Arcade, have hectare = ($feature.Count*900)/10,000. That will convert each 30-m pixel (Count) into hectares.
- Repeat for 2016.
From that we see that from 2001 to 2016 there was a 40% decrease in the surface area of Lake Mead.
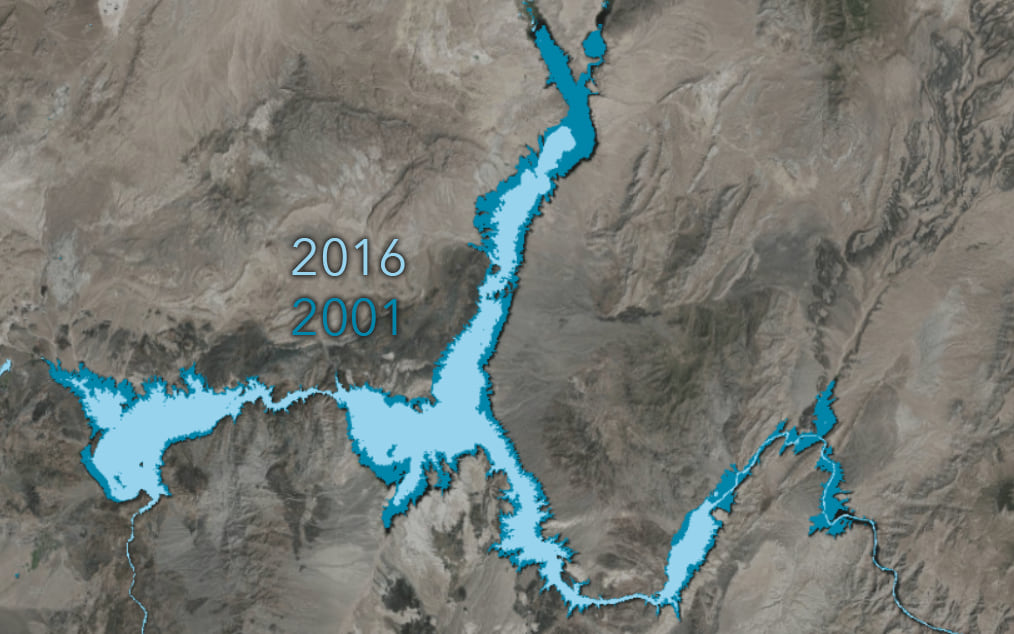
Using the NLCD and Processing Templates in the Living Atlas
The NLCD provides 30-meter per pixel resolution of the land surface. Each pixel (or 0.09 hectare) is classified into 20 different land types. Additionally, we have added in several cartographic versions and other classifications of the data using Processing Templates.
- Three color versions of the NLCD: Cartographic, Cartographic Saturated (for use with transparency on a basemap), and MRLC (the standard USGS color palette).
- The Simplified Renderer reduces the 20 classifications down to 9 (e.g., combining forest types).
- Forest and Developed Renderers show only the tree covered or developed areas, respectively – meaning you do not need to reclassify areas to isolate these commonly mapped variables.
- Analytic Render is used for timeseries analysis, detailed below.
To access these Processing Templates in ArcGIS Pro, go to the layer properties and click on Processing Templates. Each template can be selected from the pull-down menu.
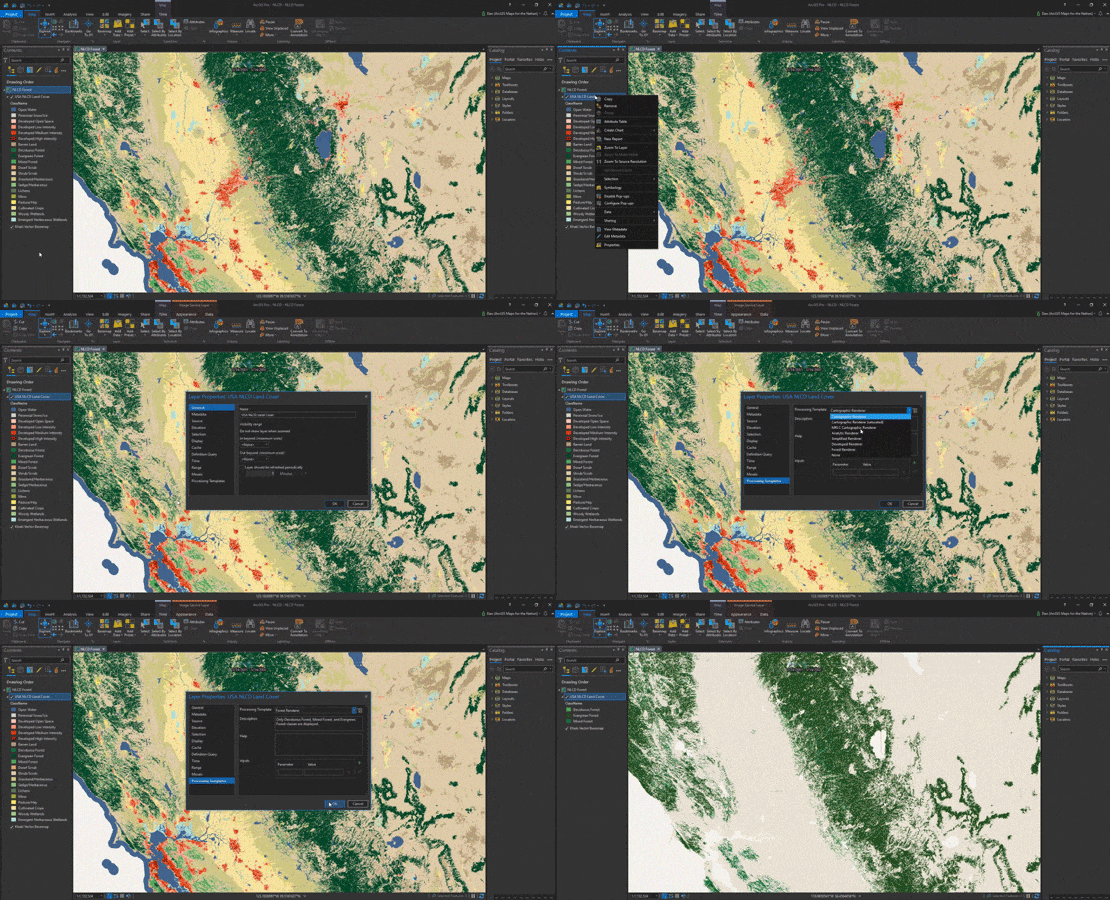
In ArcGIS Online, click the layer properties and go to the Image Display options.
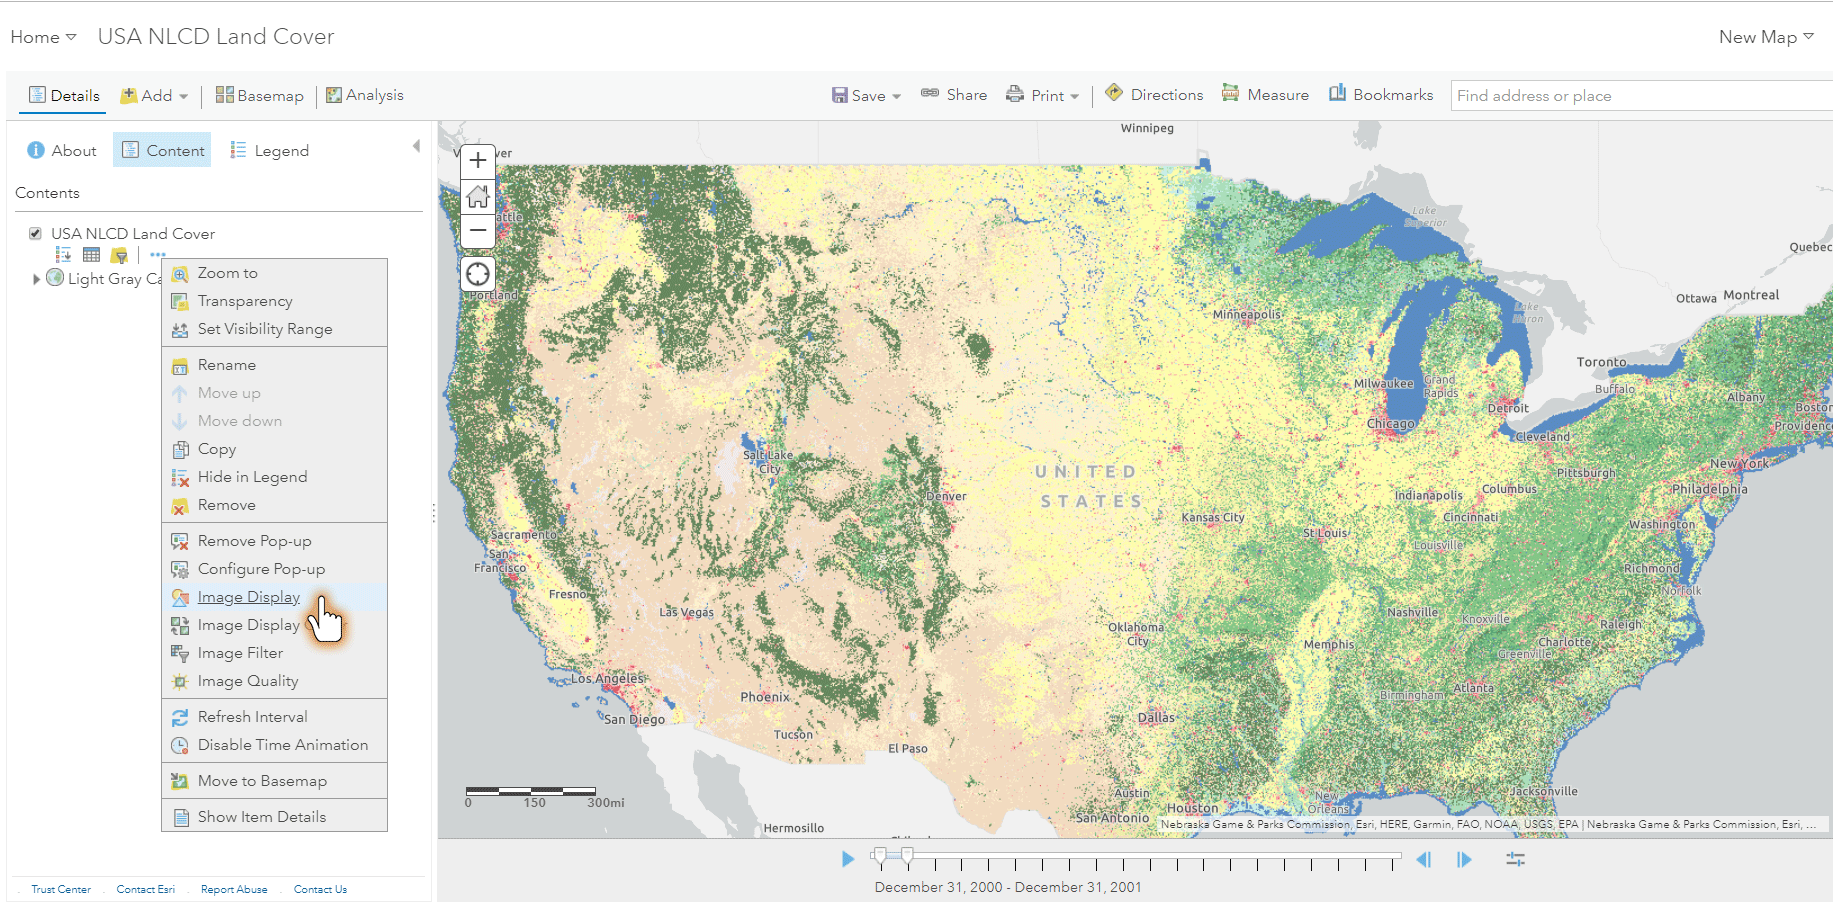
The NLCD Timeseries
An important consideration when using the NLCD is that not all areas of the U.S. are updated at the same time or frequency.
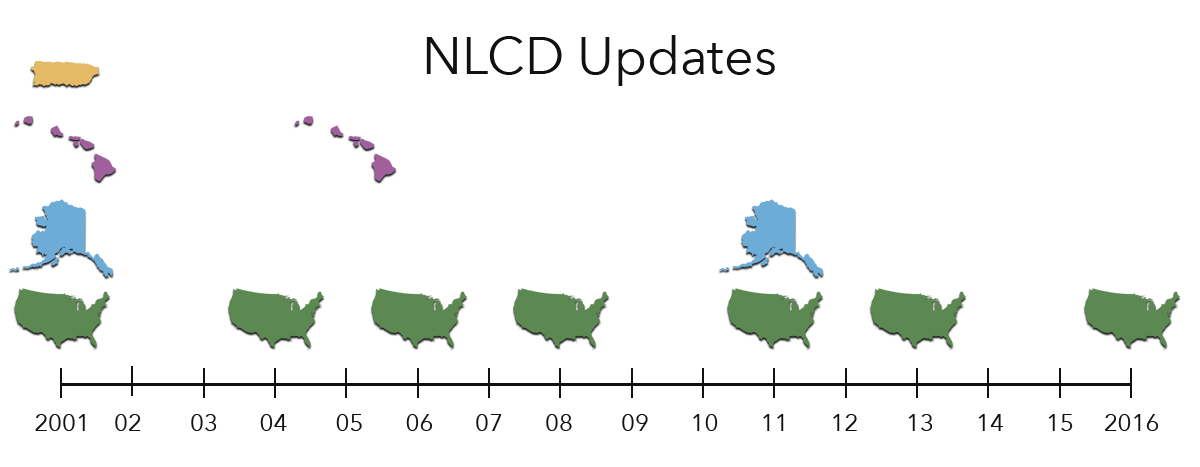
In the chart above, you’ll notice that while the contiguous U.S. was updated in 2001, 2004, 2006, 2006, 2011, 2013, and 2016, other the non-contiguous states and territories of Alaska, Hawaii, and Puerto Rico were updated on somewhat different timeframes.
This variability in time and space is where the Analytical Processing Template comes into play. When this template is selected, you can run raster functions or other analyses on the timeseries and null values will be inserted for the blank years, even though there appear to be frames with no change when animating through time.
A Tour of the Nation’s Landscape Changes
Since 2001, I have lived in 6 cities from the East to West Coast, providing me with an appreciation of how things really have changed when I revisit these areas. Here are a few things that I have experienced that the NLCD really helps to illustrate. Each is a 2001-2016 comparison.
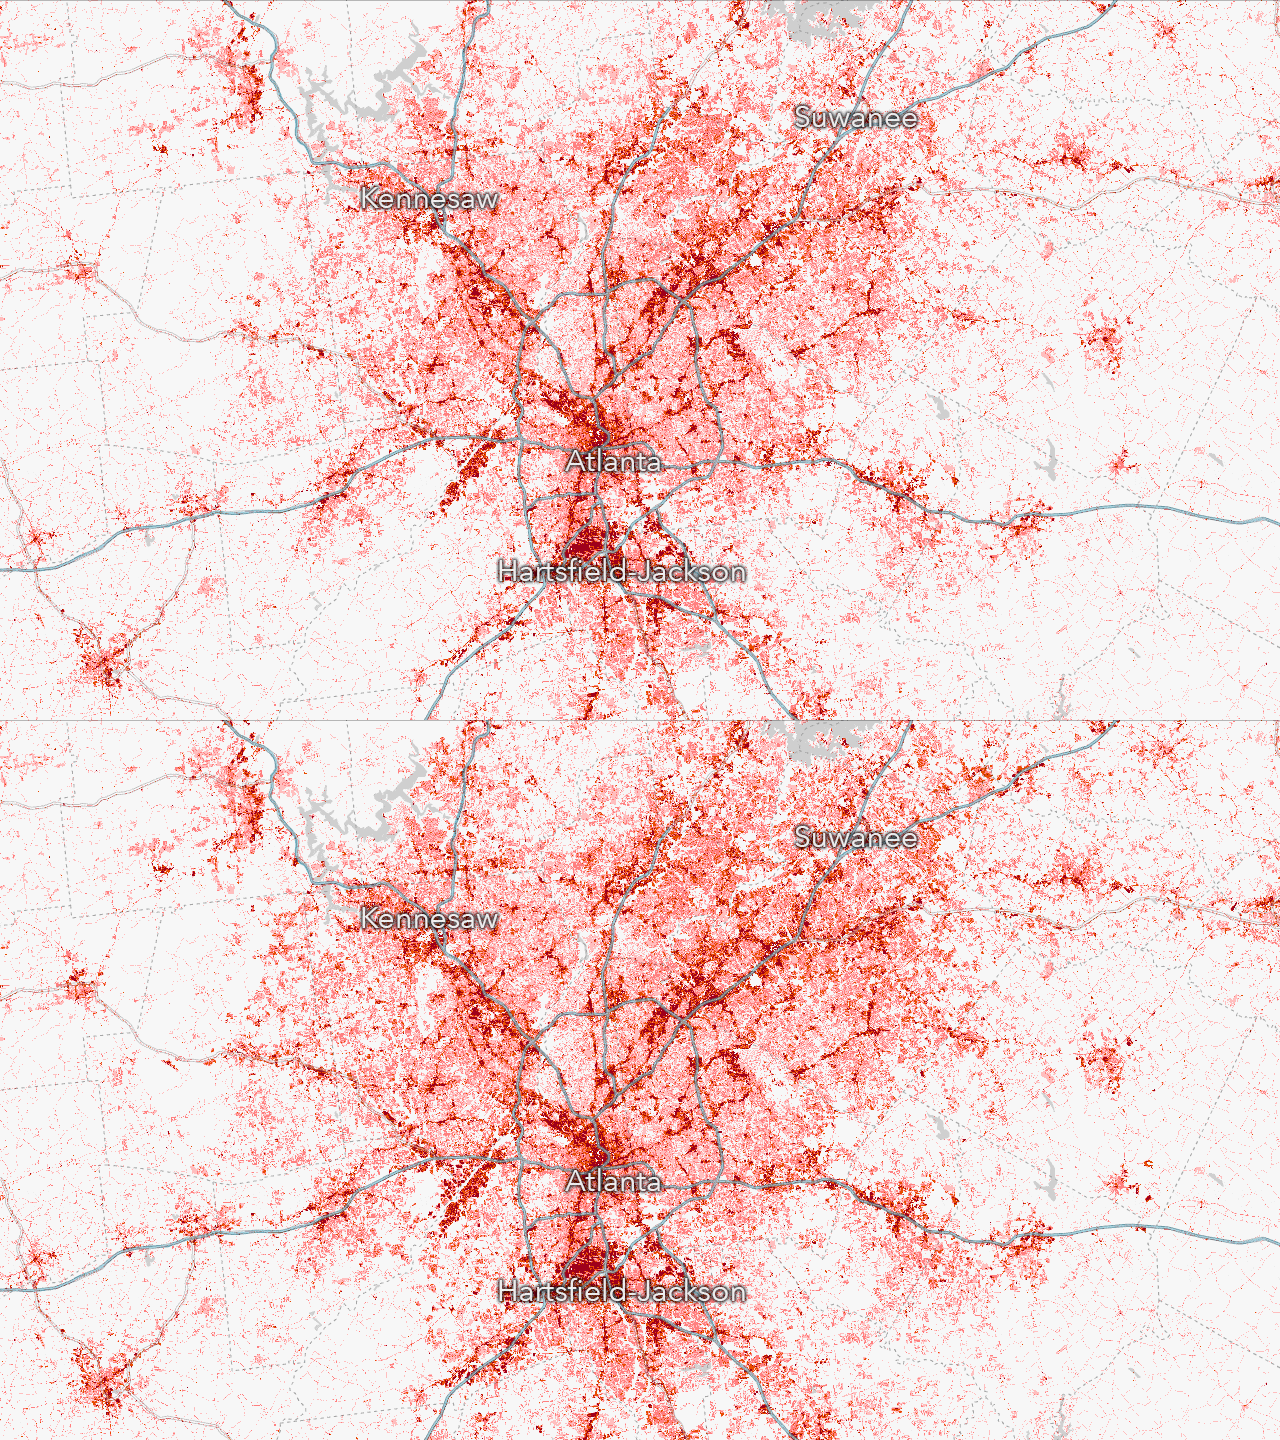
Back in 2001, I was in grad school in Atlanta. And although midtown was changing, the OTP (“outside the perimeter”) was rapidly developing. We can see this expansion by using the Developed Renderer and adding in US Interstates from the Living Atlas as a reference for I-285.
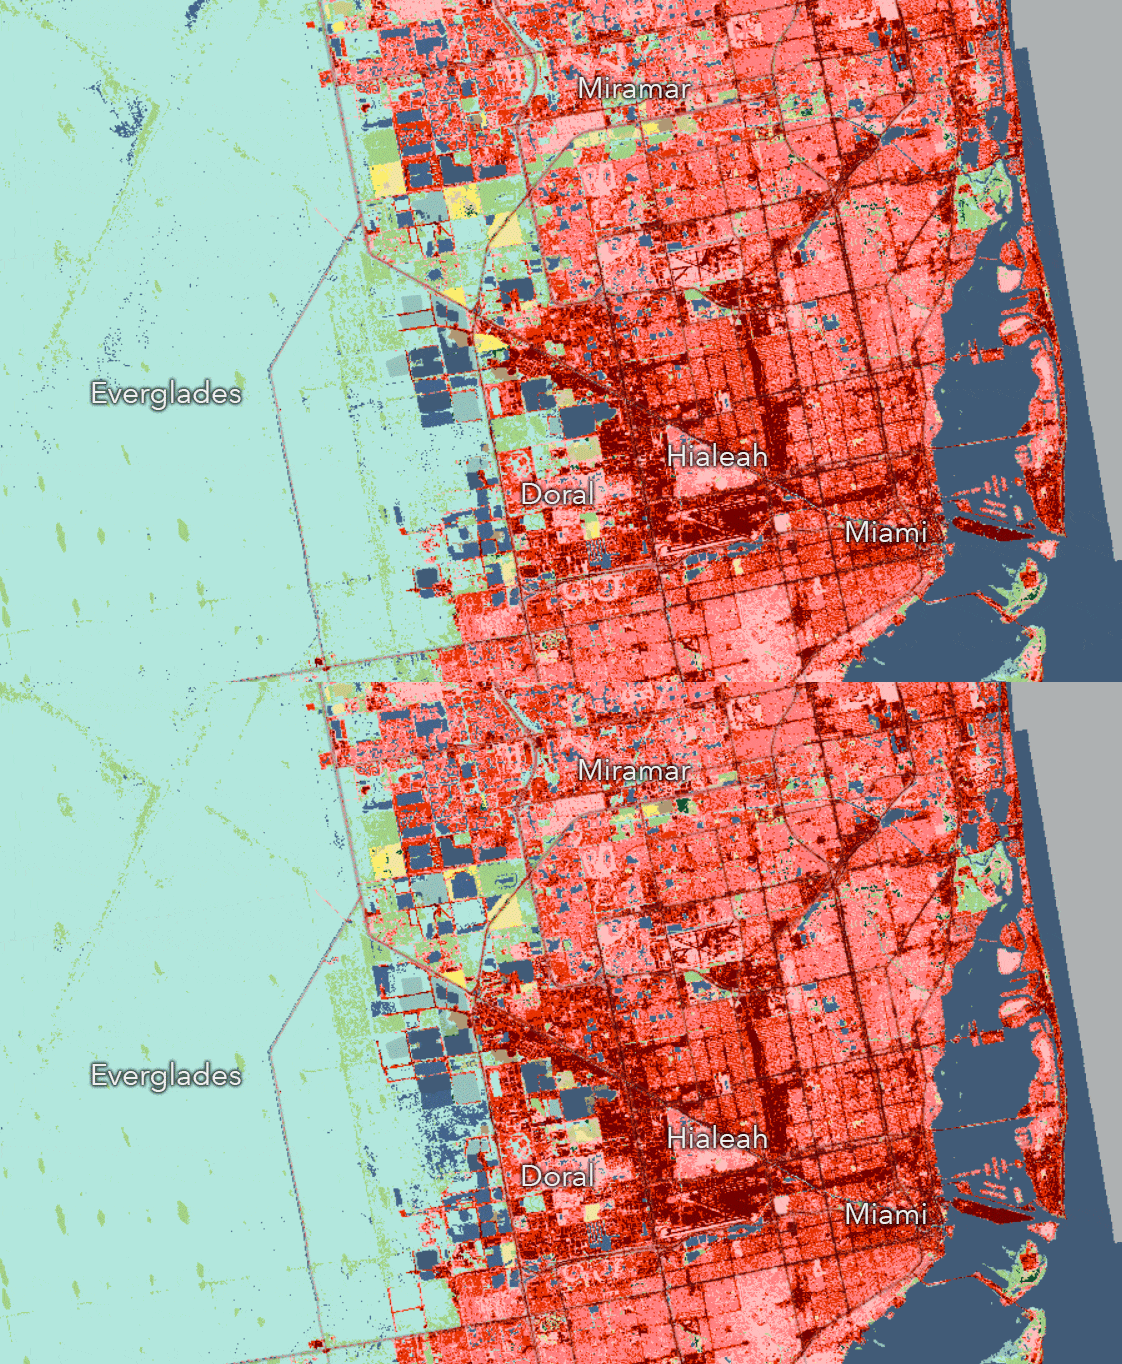
After Atlanta, I moved to South Florida to work on the Everglades Restoration Project. Granted, I remember when Plantation (Broward County) was the edge of civilization in the early 80s, but in the 2000s, Miami was also making a continuous march westward, converting wetlands into subdivisions.
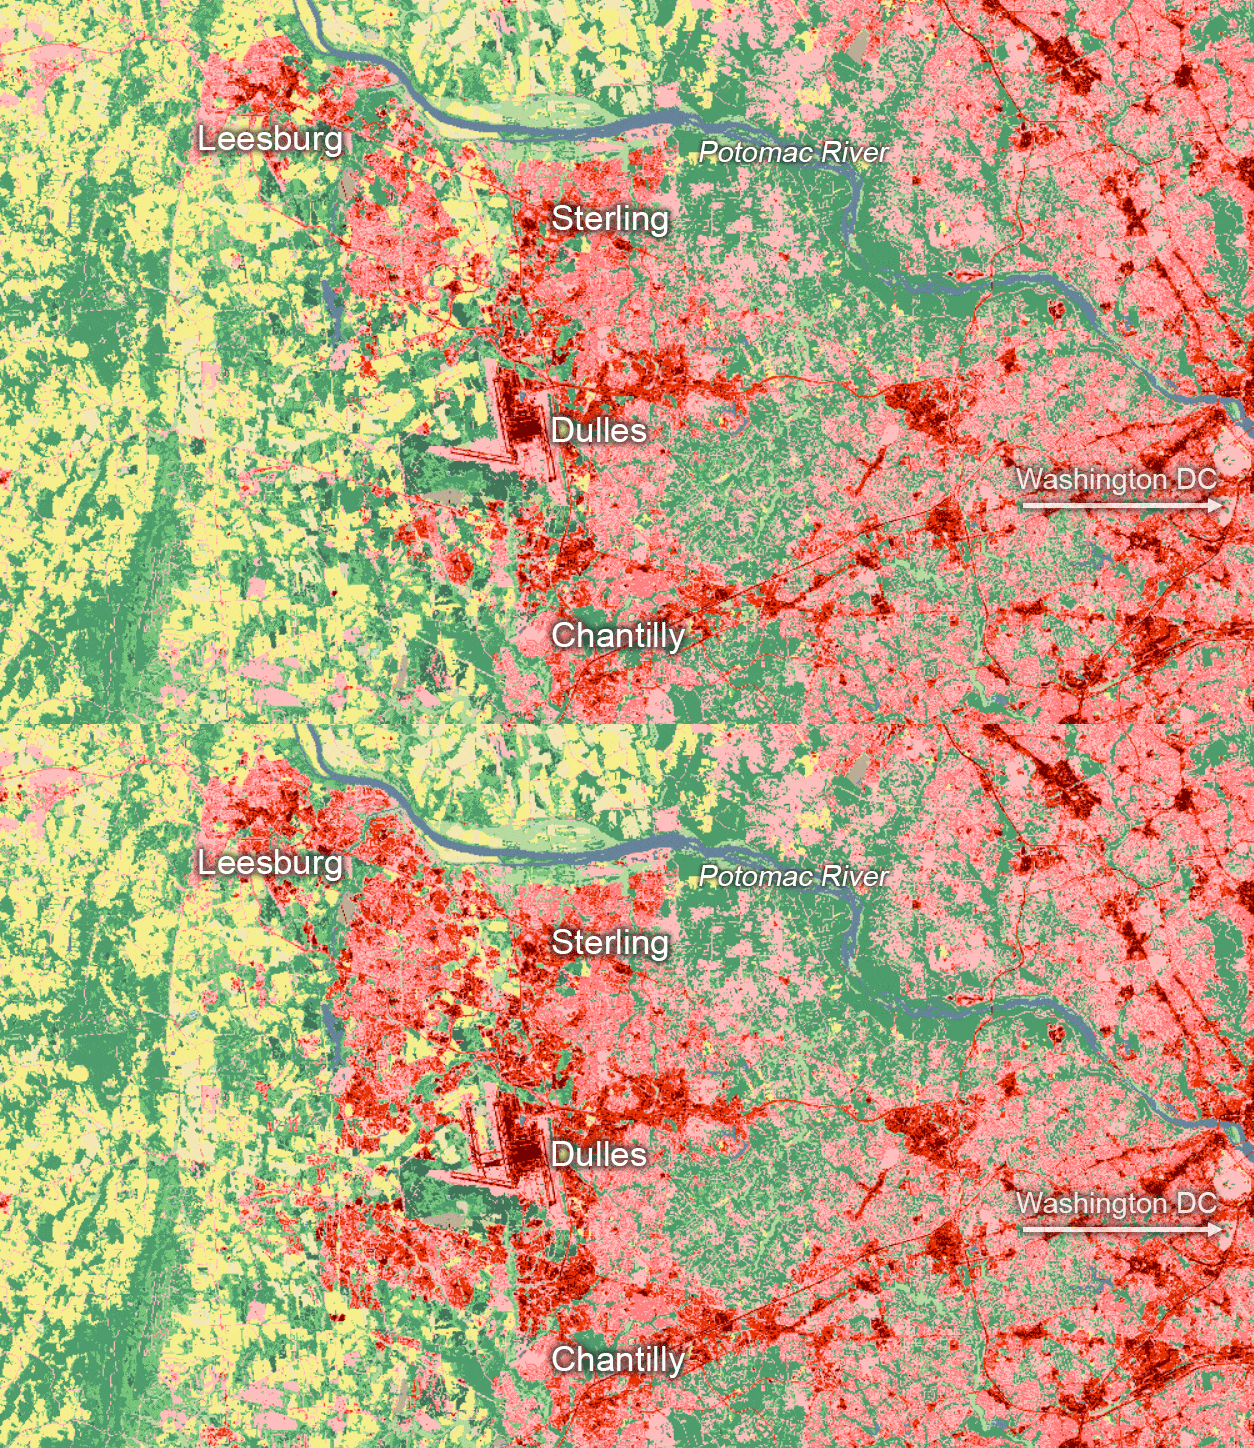
Next it was back up north to our nation’s capital, Washington DC. Home to the worst travel times in the country, where forty-mile commutes are common, even though DC has the 3rd largest mass transit system in the country. Like Atlanta, the DC region was also sprawling as it quickly adapted to the demand for housing as more businesses moved to the region, along with the expansion of the federal government workforce.
Now it’s Palm Springs, where the wildland – urban interface is quite clear from the vistas of mountain ranges and the sprawl visible from the tops of them. Like Las Vegas, this area sees an expansion of towns throughout the Coachella Valley along with the shrinkage of the inland Salton Sea. Another interesting feature is the 2013 wildfire, the scars of which are visible in the 2016 data.
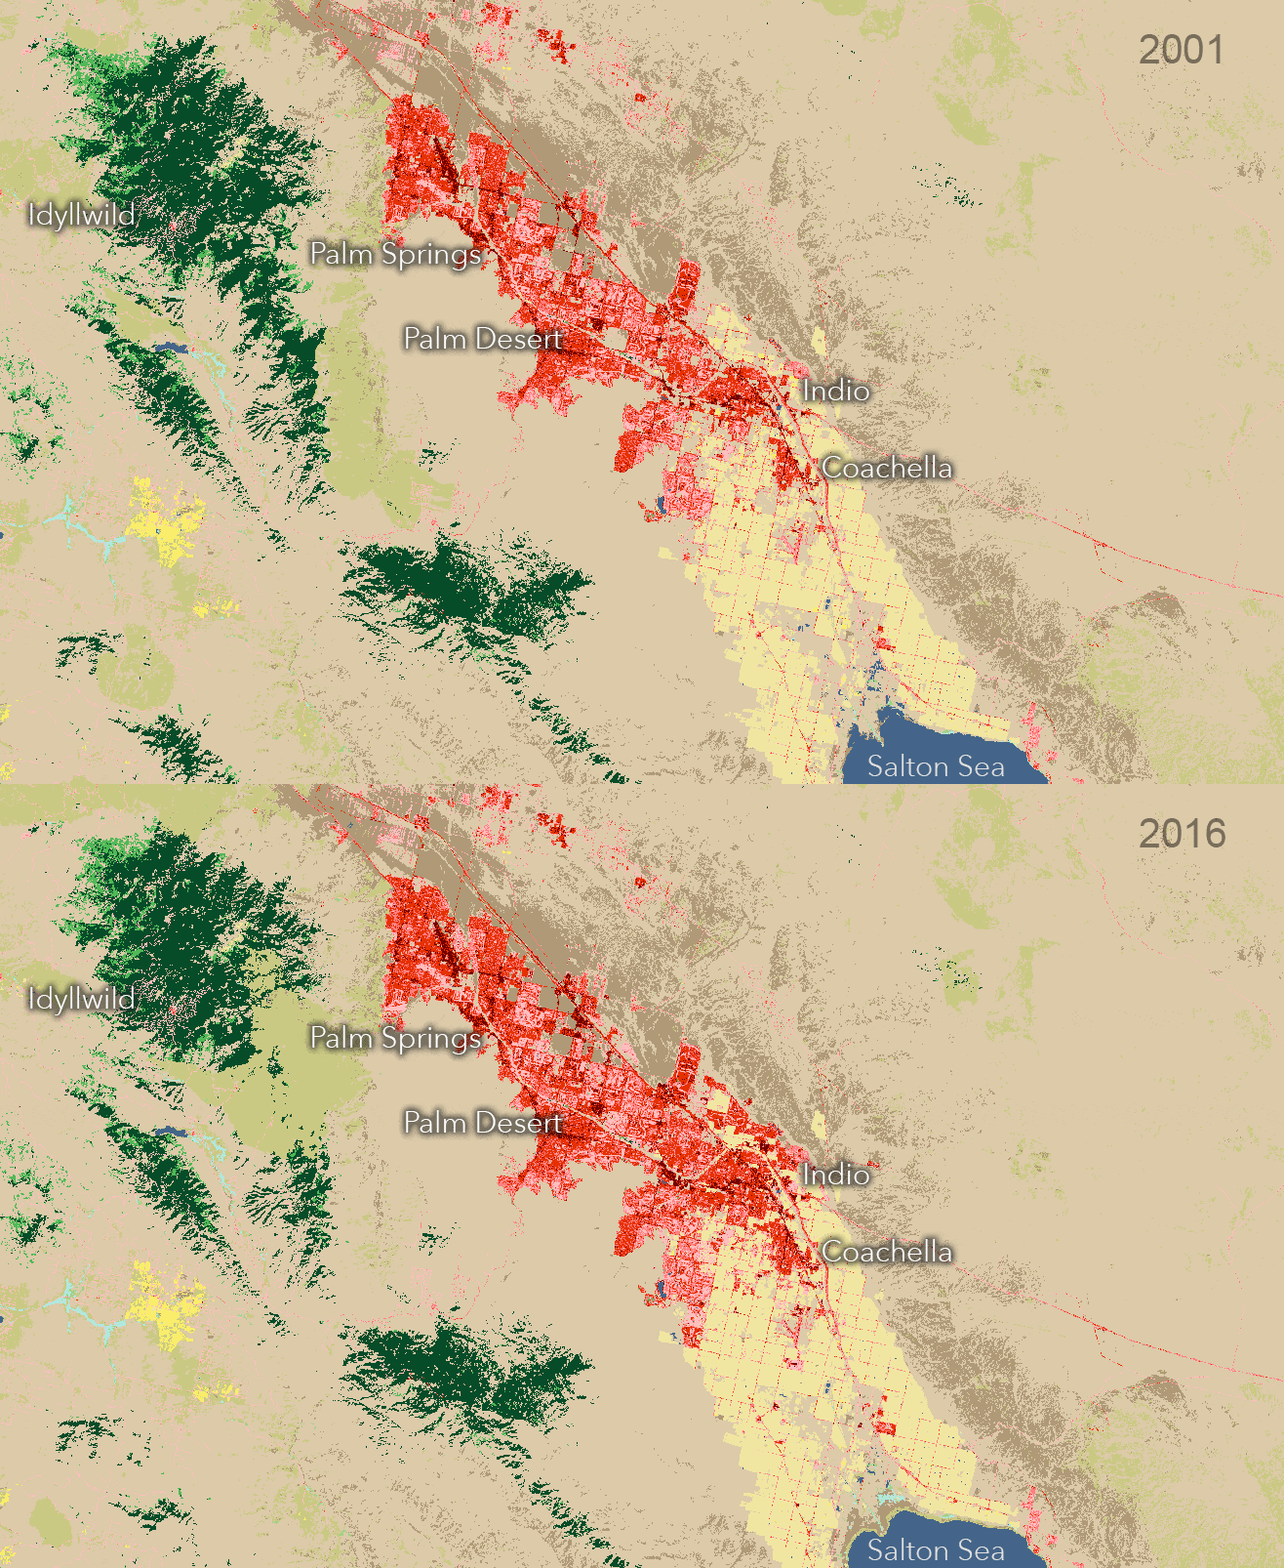
These pockmarks of burn scars can be seen throughout California, especially in the wildfire ravaged north. By using the Forest Renderer, these changes become even more apparent.
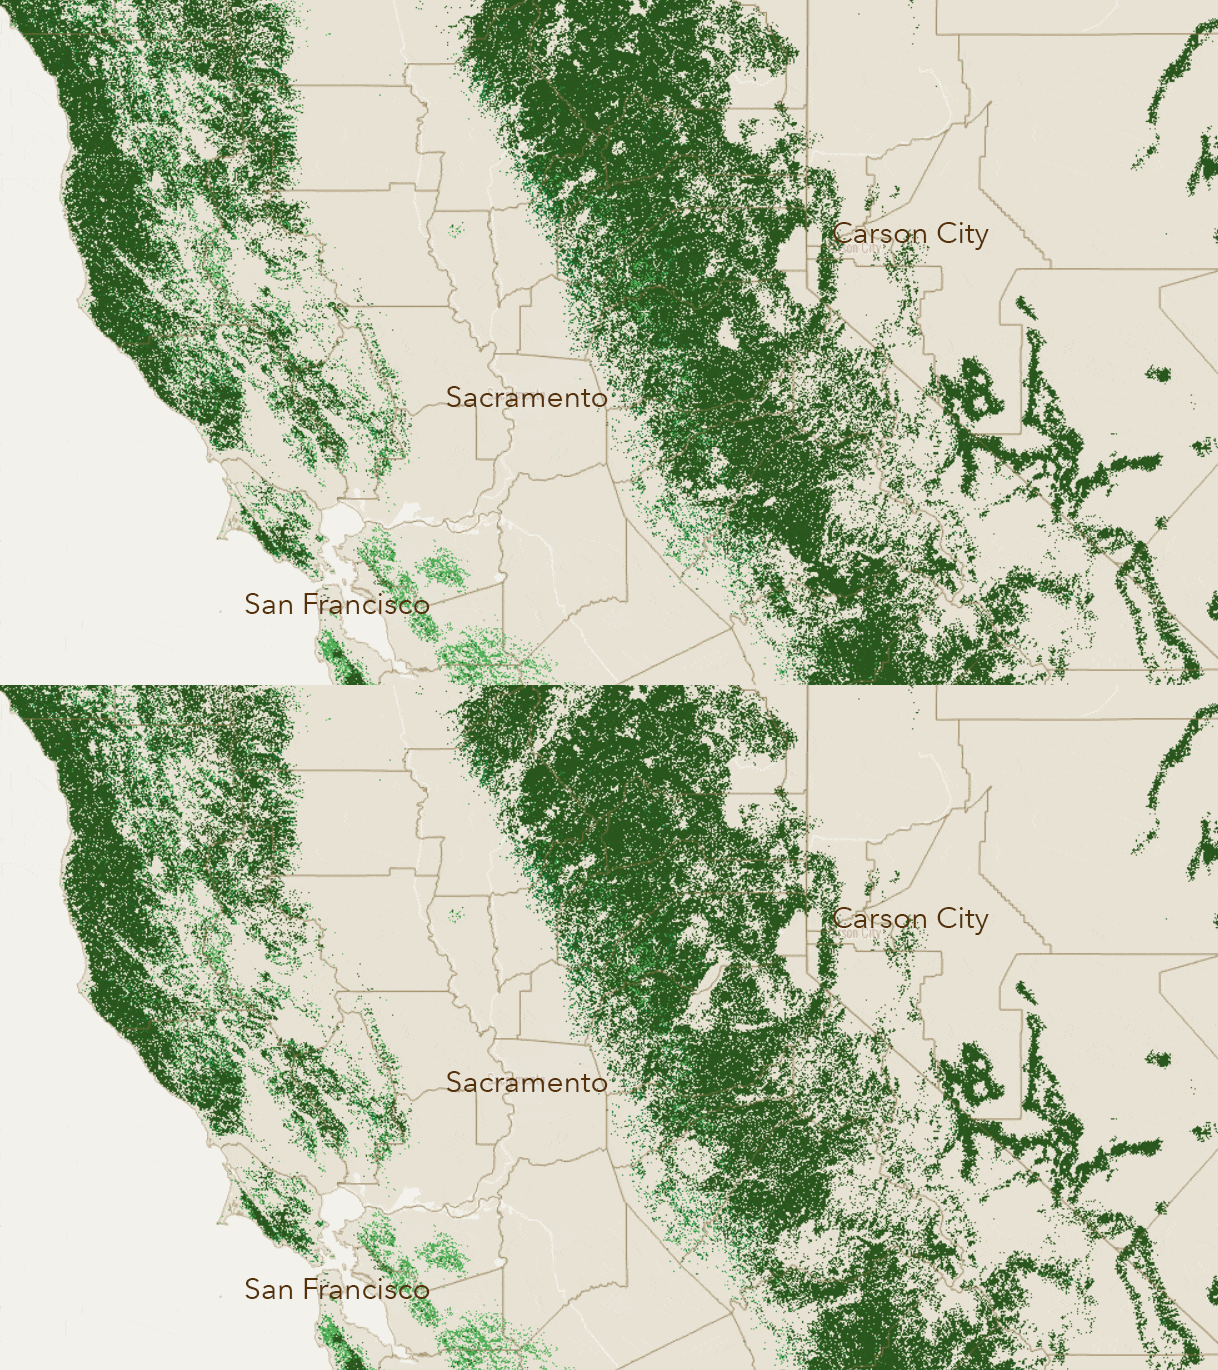
These are some of my stories, but with 20 classes of land cover over millions of square miles and multiple years, there are an infinite number of stories to tell by analyzing and remapping this data.
Stay tuned…later this year we’ll have another batch of new services displaying percent forest canopy and percent impervious surface. Thank you to the USGS and MRLC for providing this amazing resource.
And one last note from the MRLC: this new version should not be used in conjunction with years or analyses from older versions that you may have in ArcGIS Online or locally.
For questions or comments, especially about additional processing templates, please visit our GeoNet.

Commenting is not enabled for this article.