In the news: Severe or exceptional drought conditions now encompass 90% of the Western U.S. Recent hot, dry weather in the Pacific Northwest has spread across the Northern Rockies to the Upper Midwest resulting in an expansion of drought conditions. Today in California, Governor Gavin Newsom has asked residents to cut household water consumption by 15%, and added nine more counties to the state’s drought emergency list.
Make a drought map
ArcGIS Living Atlas of the World includes authoritative live feeds and other content that helps you learn more about current conditions and events. Follow these steps to make your own map of current drought conditions in a minute (or less), using Living Atlas content.
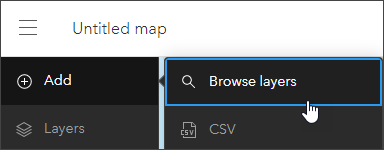
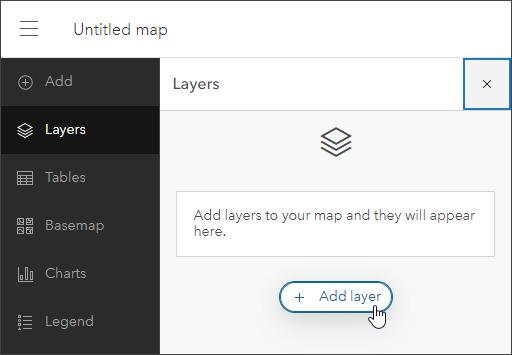
Step 1 — Sign in to your ArcGIS account and open Map Viewer. There are two ways to add layers from the Content (dark) toolbar:
(1) Click Add, then Browse layers.
(2) Click Layers, then Add layer.
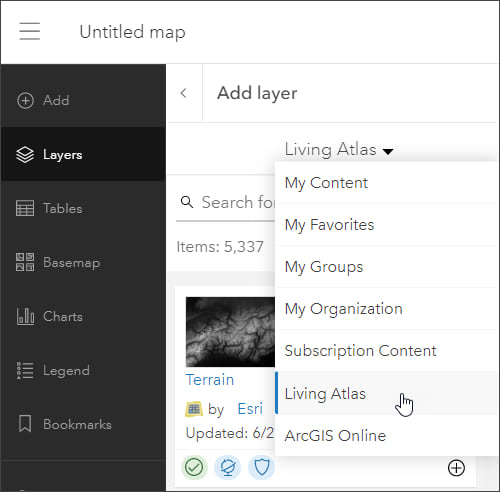
Step 2 — Choose Living Atlas from the Add layer drop-down.
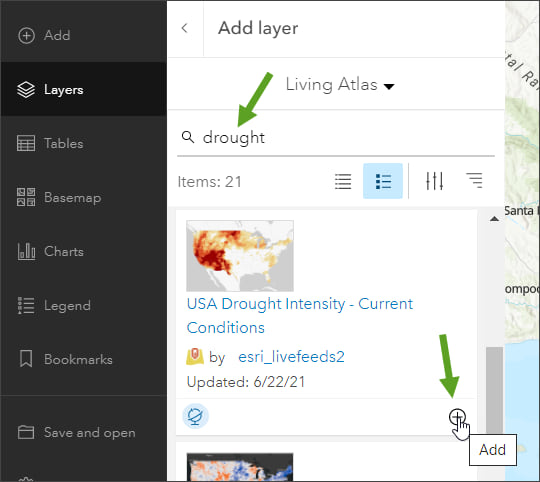
Step 3 — Enter “drought” in search to locate USA Drought Intensity – Current Conditions. Click (+) to add it to the map.
Tip: To learn more about any layer, click the layer title to View item details.
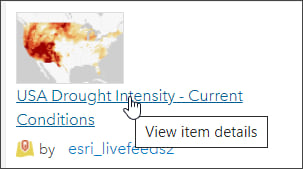
From the USA Drought Intensity – Current Conditions item details we can learn that the layer is a feature layer sourced from the National Drought Mitigation Center. The layer displays current drought intensity categories for the entire U.S.
The layer is a live feed and is updated every week, showing the conditions from the previous week. These updates occur every Thursday. When you add this layer to your map, it will show the latest drought conditions automatically .
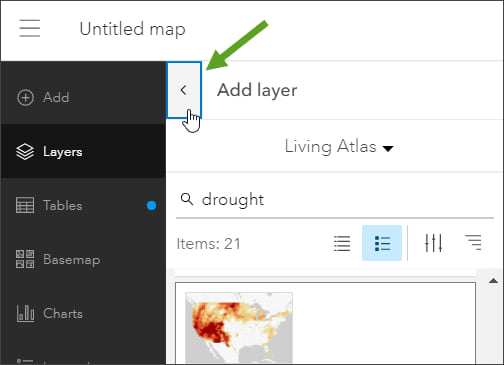
Step 4 — Click the left arrow at the top of the Add layer panel to return to the map contents.
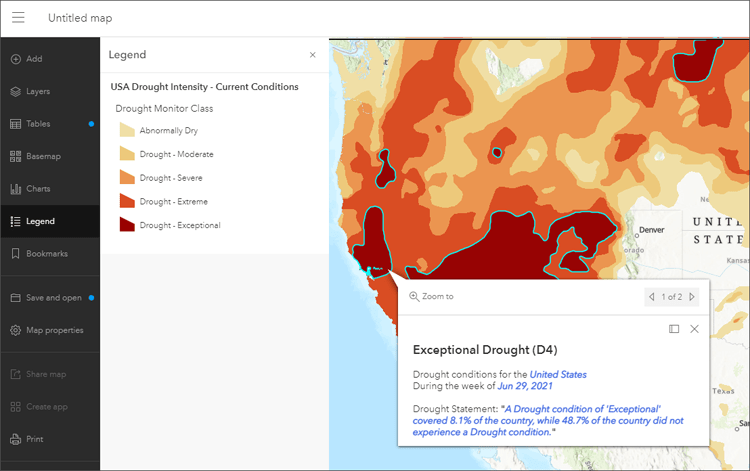
Technically, our current drought conditions map is finished in well under a minute, showing the current drought conditions by Drought Monitor classification. The pop-up includes additional information, such as the date recorded and comparison to conditions in the rest of the U.S.
Improve the map
Experiment using different basemaps and layer settings until you get the desired result. When finished, save your map.
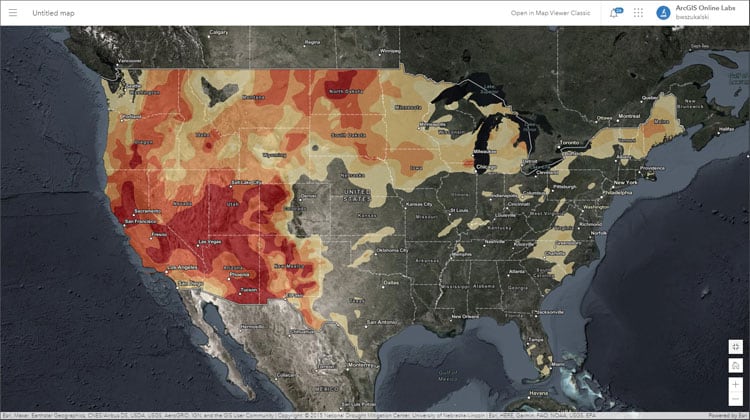
Below, the basemap has been switched to Firefly Imagery Hybrid and transparency has been applied to the drought layer.
You can quickly create an app showcasing your map using any of the instant apps or configurable app templates, or use it in a story map.
More information
For more information, see the following:
This blog article was originally published on July 8, 2021, and has been updated.

Commenting is not enabled for this article.