If you could peek into the future and see Earth’s ecosystems in 2050, what would be different? What would you do with this knowledge?
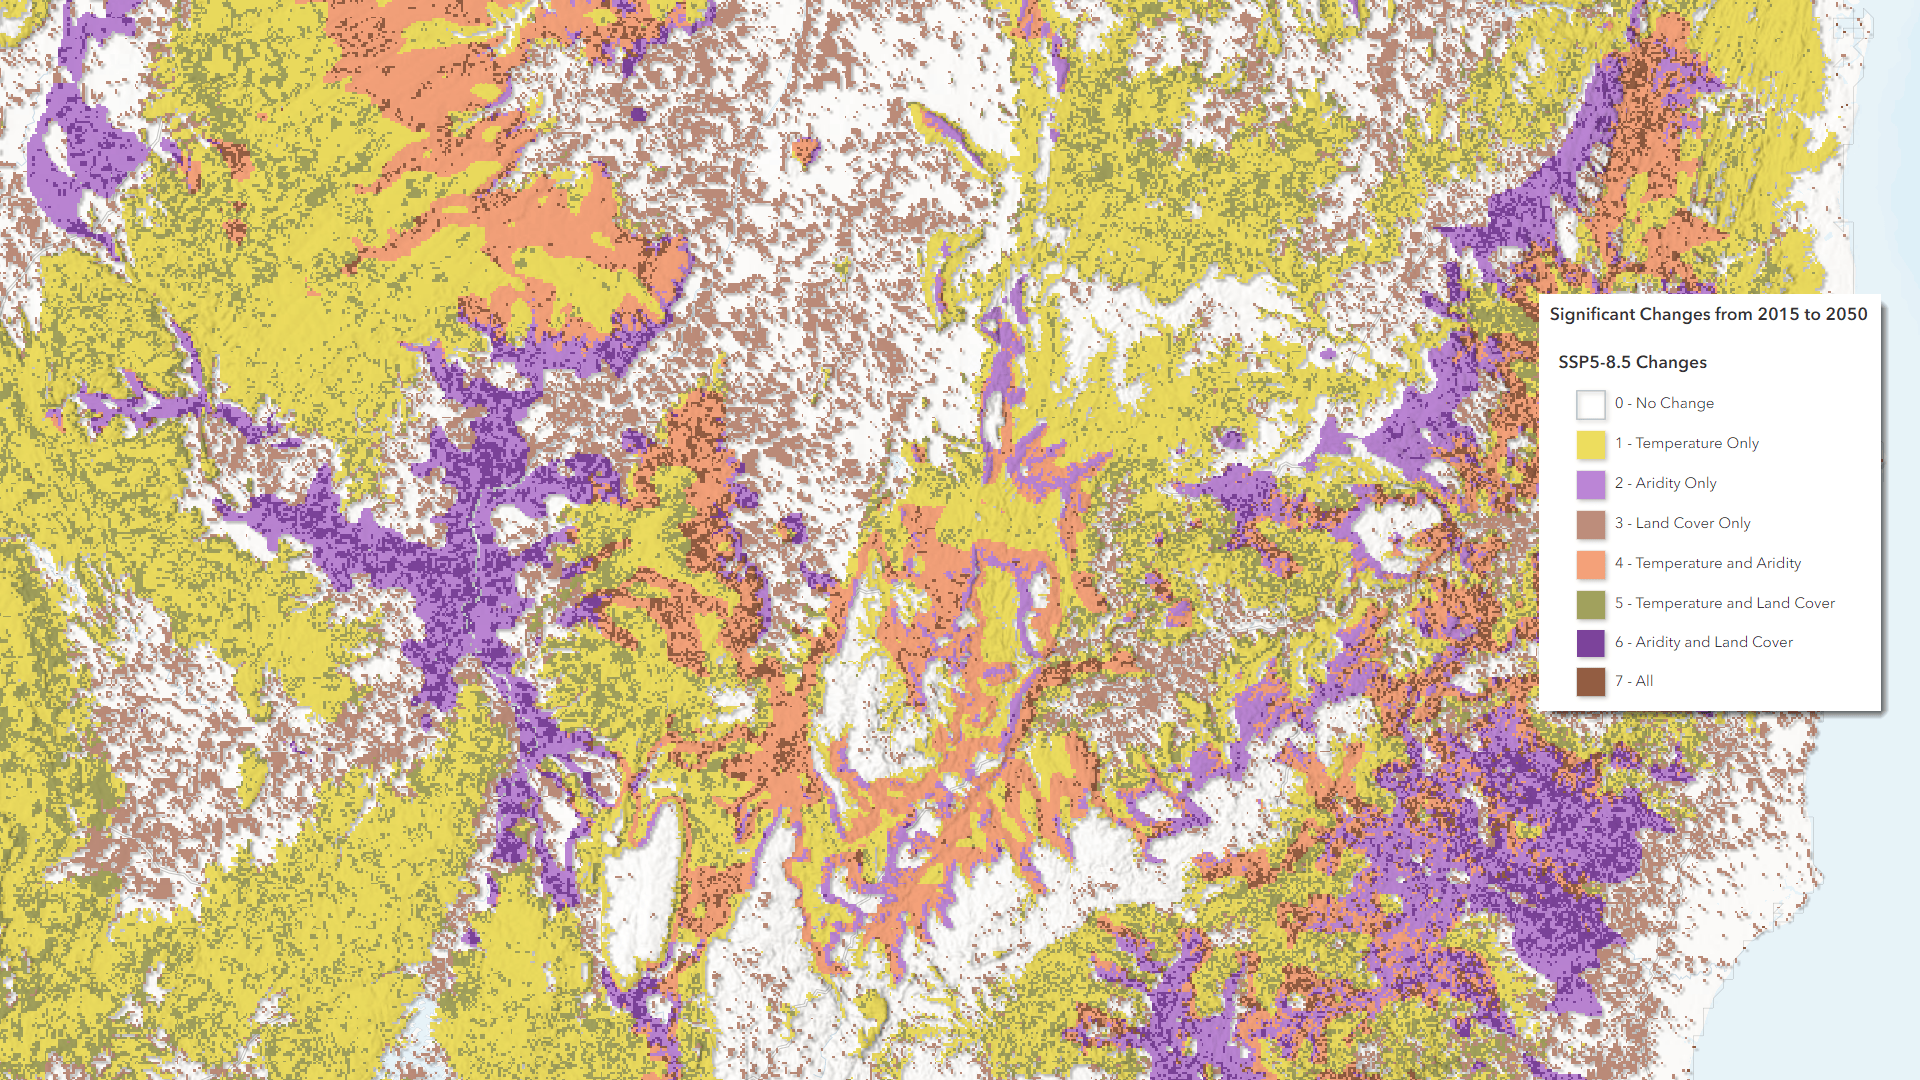
Now, you can have that peek. We have developed a set of global layers at 1 km resolution for projections of terrestrial ecosystems in 2050 and compared them to today’s ecosystems to learn what could change. The banner image above shows the types of change that could affect terrestrial ecosystems within a region of Brazil’s Atlantic coast.
Who needs this and why?
Who: Governments and researchers who develop local, regional, state, or national land management strategies and agricultural policies.
Why: There are many reasons, here are three we believe are significant:
- Depending on how we choose to act, we found that future climate projections indicate roughly 35% of the World Terrestrial Ecosystems (WTEs) we modeled for 2015 could change by 2050.
- Ecosystems include where people live and the land they depend on for food, building materials, and many other services that make life as we know it possible. If those ecosystems are projected to undergo disturbances that diminish their health and function, the people who depend on them need to know.
- The projected changes are based on models of future climate and the needs of growing populations for settlement and agriculture. When changes to our climate are significant enough to affect the ecology around us, it signals our need to change or adapt.
Therefore, we believe maps of where ecosystems could change should play a role in planning adaptation strategies for climate change, given the needs of local populations. We modeled ecosystem changes based on where significant shifts in climate and changes in the amount of land needed for human uses are likely to occur.
The locations of ecologically meaningful shifts in climate based on CMIP6 models appear reliably plausible. In these models, however, only the amount of land change for human uses within a region is relevant; the specific locations are simplistic – based only on proximity to need and do not account for existing local plans or land protection status. By knowing which areas of a country or state are projected to undergo ecosystem-altering change and the amount of land needed for human uses, we can develop strategies to assign the best locations for where the land use changes ought to be made.
How you can get started exploring these new layers:
We produced four sets of input datasets and output WTEs:
- Baseline WTEs representing recent climate regions, land cover, and land use for 2015.
- 2050 WTE projections modeled for SSP1-2.6, a.k.a. the “Green” scenario.
- 2050 WTE projections modeled for SSP3-7.0, a.k.a. the “Rise of Nationalism” scenario.
- 2050 WTE projections modeled for SSP5-8.5, a.k.a. the “Fossil Fueled” scenario.
We created the WTE 2015 to 2050 Comparison Explorer app to help explore these models. Use this app to build your understanding of the kinds of change that may occur by 2050. The app has an info screen with the above information and a suggested sequence for exploring the WTEs and the comparisons between 2015 and 2050.
The raster datasets (.tif format) shown in the app are licensed under a CC By 4.0 license and are available as image services in ArcGIS Online and for download at DOI: 10.6084/m9.figshare.26078788. The ArcGIS Online services can be found in the WTE 2015 to 2050 Comparison Project Layers and Maps group
Dec 27, 2024 update: Our peer-reviewed open-access journal article is available this week: Potential 2050 distributions of World Terrestrial Ecosystems from projections of changes in World Climate Regions and Global Land Cover in Global Ecology and Conservation, Volume 57, January 2025, e03370.
How to read and interpret these maps:
Comparing maps of WTEs in 2015 to projections for WTEs in 2050 is not easy – there are too many changes in too many locations, and many are subtle. We who know the data best struggled to do this and knew we needed to try something different. We found that showing the types of change rather than the resulting ecosystem types was much easier to approach. These change layers show whether significant changes to mean annual temperature, aridity, and land cover occur between 2015 WTEs and models showing 2050 projections for WTEs.
We also learned that the two climate variables functioned differently than the land cover changes. The climate variables are inherently geographic and show where change may occur. The land change models only assign change to each nearest pixel. Thus, the amount of land change in each country or administrative unit is valuable, but the specific locations are not plausible in many cases.
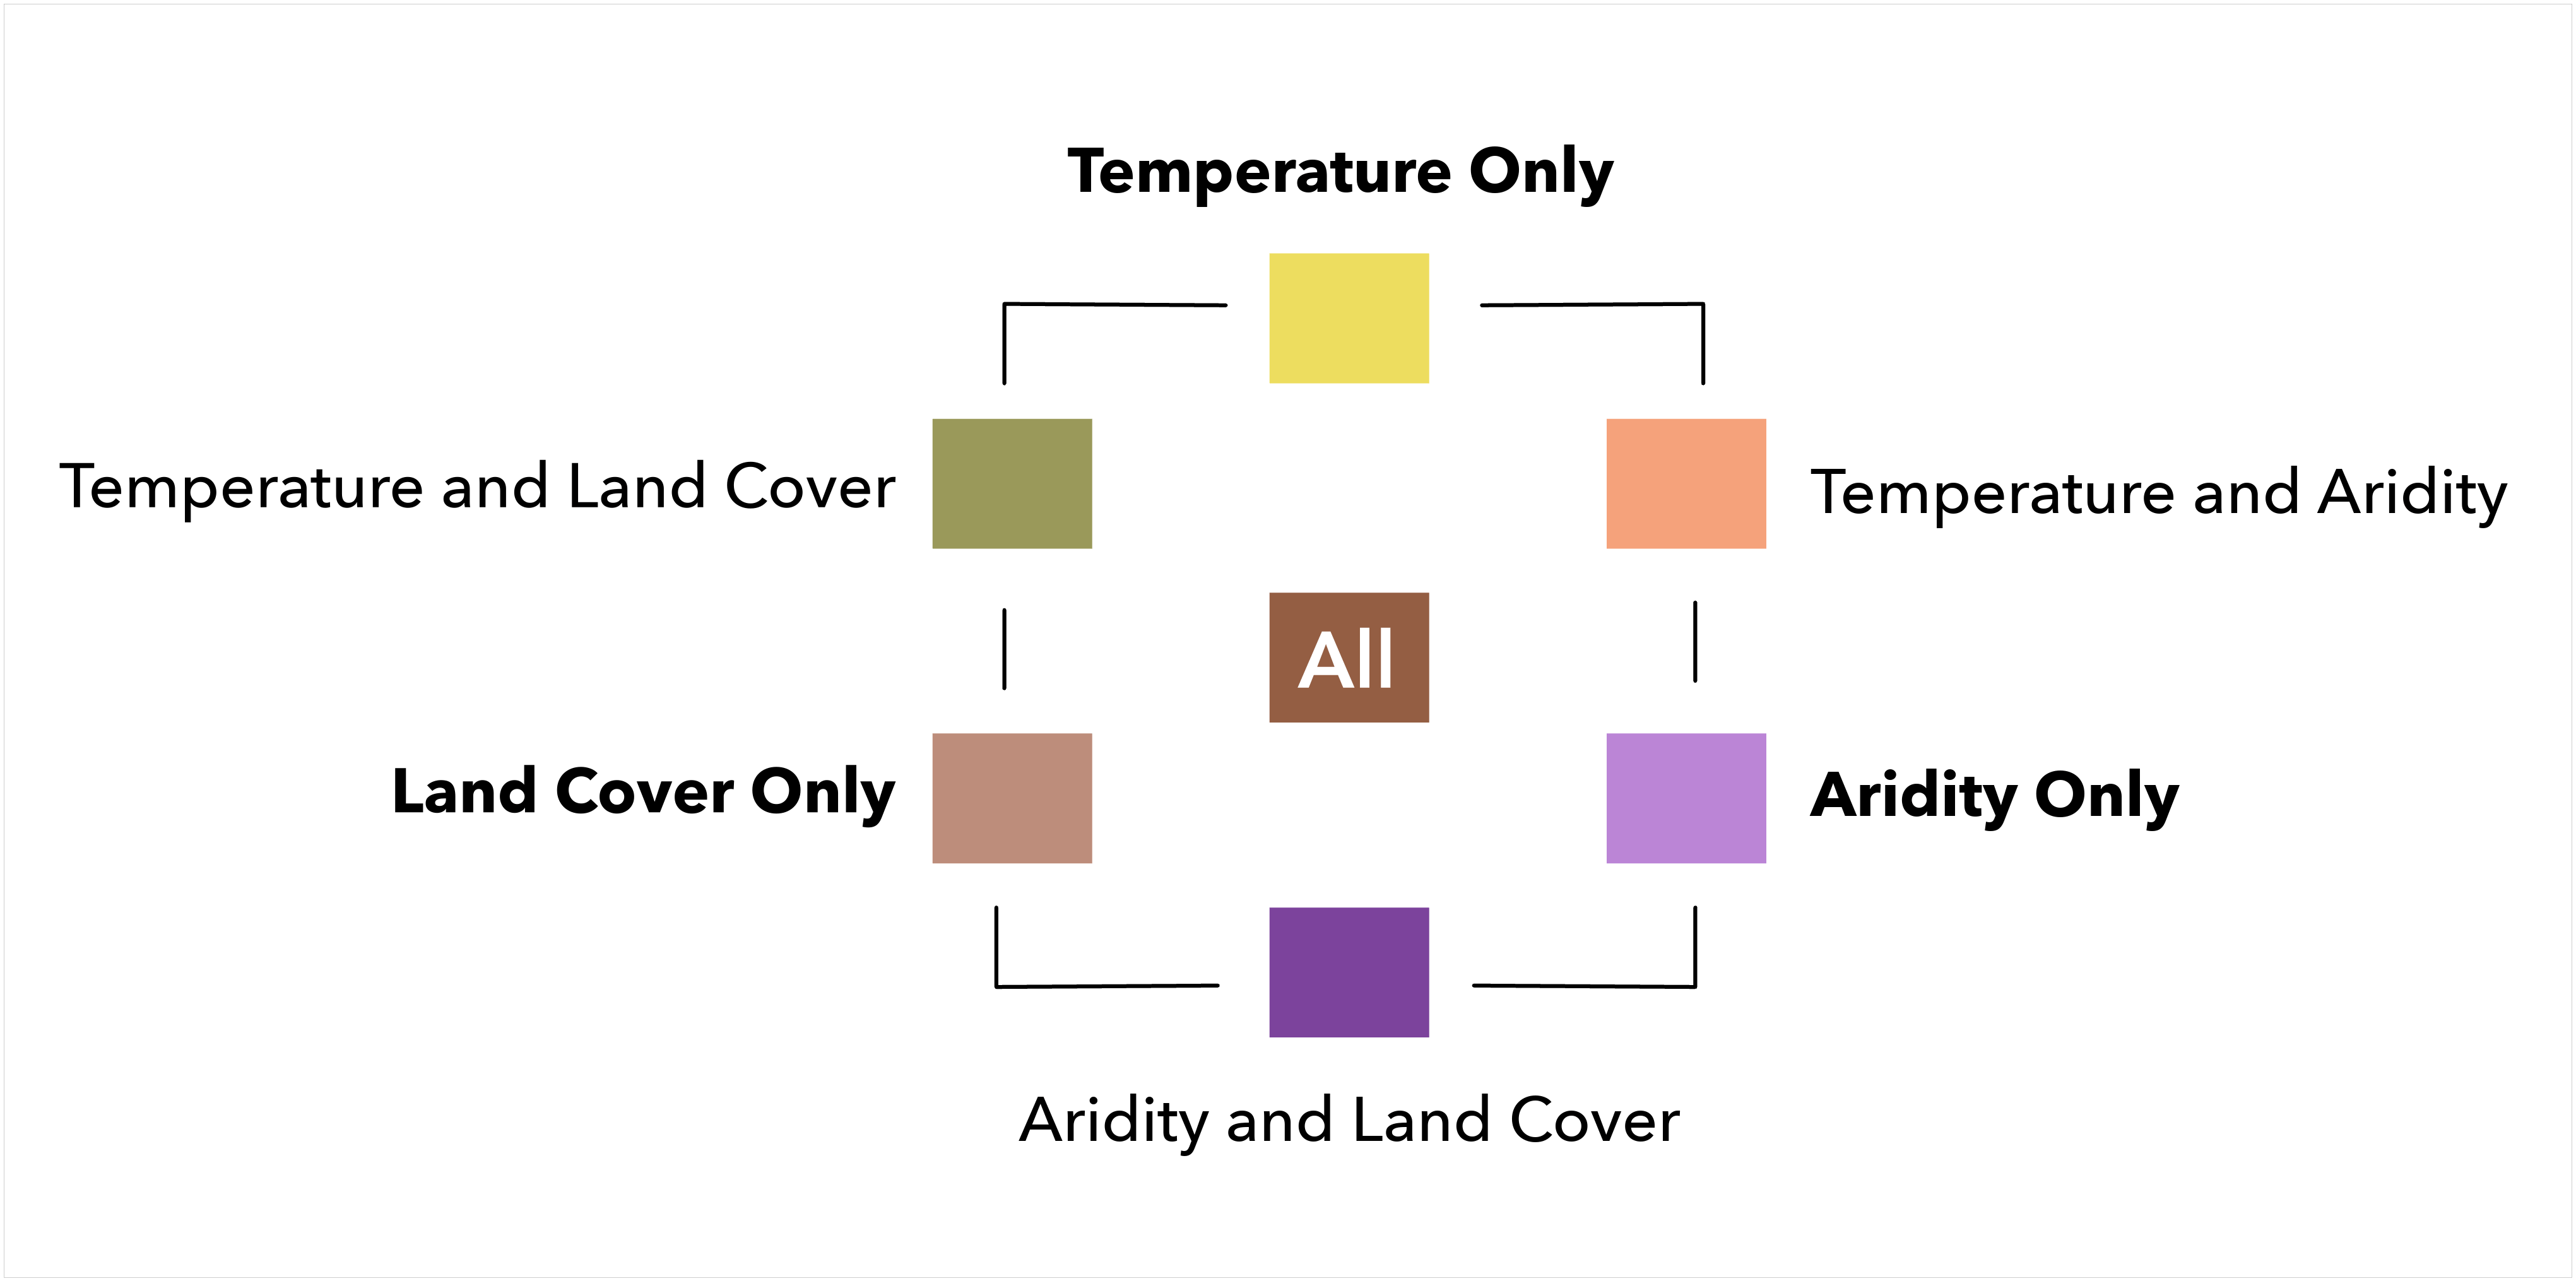
This diagram shows the three variables, their combinations, and the colors we used on the maps. We chose not to include the change direction, partly because it makes the map far more complex. These maps are intended as the first step in learning how climate change, ecology, and humans exist and interrelate in a geographic context.

Authors
This work was produced by a team of authors who contributed expertise in ecology, geography, geology, climate science, land cover modeling, planning, and GIS engineering, and represent these organizations:
- USGS, with contributors based in Reston, VA; Sioux Falls, SD; Flagstaff, AZ; Raleigh, NC; and Denver, CO
- Esri, with contributors from the Living Atlas and Science Teams
- Conservation International
- Wildlife Conservation Society
- The Nature Conservancy
- NatureServe
- Clark University

Article Discussion: