ArcGIS Living Atlas of the World is the foremost collection of curated geographic information from around the globe. It includes ready-to-use maps, apps, and data layers from Esri and the global GIS user community that support your work. Visit the ArcGIS Living Atlas of the World website where you can browse content, view the blog, and learn how you can contribute.
ArcGIS Living Atlas is an integral part of the ArcGIS system; you can use it to make maps in ArcGIS Online, ArcGIS Desktop, ArcGIS Enterprise, or use it within ArcGIS Web APIs and SDKs.
ArcGIS Living Atlas is updated frequently, and has evolved and expanded greatly over the past year. Content is often published on its own release schedule, so it’s possible to miss an update or new offerings during the course of the year. The following is a compilation of what’s happened with ArcGIS Living Atlas in 2019, using ArcGIS Online release milestones.
March 2019
The OpenStreetMap vector basemap maintained and hosted by Esri was officially released. The OpenStreetMap basemap is one of the standard basemaps in the basemap gallery for organizations that have enabled vector basemaps. Small areas can be exported for offline use. See What’s New with OpenStreetMap Basemap (March 2019) for more information about this release.
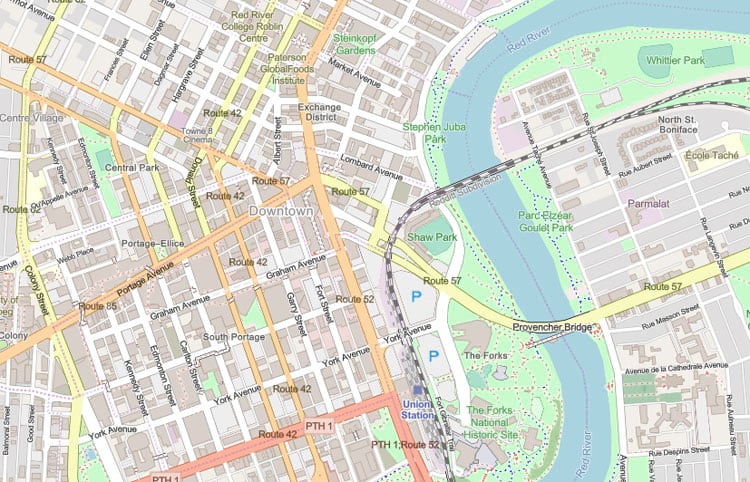
Esri vector basemaps became available in Czech, Finnish, Hebrew, and Swedish.
The new Community Maps Editor app beta was announced. The app is used by contributors to add detail to areas of interest and enhance Esri’s basemaps. Add building footprints, athletic fields, walking paths, trees, and more. For more information see Introducing Community Maps Editor.
Demographic maps for the Netherlands, Switzerland, New Zealand, and several other countries in the Middle East and Latin America were updated using the latest data from providers. For more information on updates, see What’s new in Esri Demographics.
June 2019
The World Imagery basemap was updated with the latest DigitalGlobe EarthWatch Vivid and Metro imagery. Small-scale extents now include the latest Earthstar Geographics TerraColor imagery.
World elevation layers, including terrain and bathymetry, were updated with high resolution data. For details see High resolution data updates to Living Atlas World Elevation Layers (June 2019).
Demographic maps for several countries were updated. United States demographics was updated with 2019/2024 data. For more information, see What’s new in Esri Demographics.
Popular environmental content has been updated, including the National Land Cover Database, USA Cropland, and SSURGO soil data. For more information see:
- Time-Enabled Croplands Reveal the Rhythms of American Agriculture
- Mapping Two Decades of Landcover Change in the U.S.
Esri published World Hillshade (Dark), offering a hillshade that’s especially useful as a backdrop when terrain context is desired. It’s also helpful when you want other layers to stand out. For more information, see Introducing Dark Hillshade.

Vector basemaps
Several new vector basemaps were introduced, including:
Navigation (Dark Mode) is designed to complement existing navigation style maps with a custom ‘dark mode’ navigation map style that is designed for use on mobile devices in low-light or night conditions.

Community Map provides a customized world basemap that is uniquely symbolized. It is optimized to display special areas of interest (AOIs) that have been created and edited by Community Maps contributors. These special areas of interest include landscaping features such as grass, trees, and rock and sports amenities like tennis courts, football and baseball field lines, and more. Take a tour of Community Map additions.

National Geographic Style reflects the distinctive National Geographic cartographic style in a reference map of the world. It also leverages content from the Global Ecological Land Units map, adding an ecosystem-based context for the planet.

OpenStreetMap Vector Basemap is updated every few weeks with the latest OSM data. It’s freely available to any user or developer. OpenStreetMap Vector Basemap introduces two new map styles. OpenStreetMap (Esri Street style) is rendered using a cartographic style similar to the World Street Map style. OpenStreetMap (Esri Imagery Hybrid style) uses a style similar to the Esri Vector Basemap Imagery Hybrid style, with imagery set to 25 percent transparency to better display the reference layer. See these styles in the OpenStreetMap group.
Watercolour creates a unique and “artsy” look by applying a style of hand-painted watercolors.

Other updates
Several live feeds were published as hosted feature layers which are publicly available to anyone, furthering Esri’s commitment to supporting emergency management and disaster preparedness around the world. These services will update automatically in maps and apps, delivering the latest critical information. The first set of live feeds delivered focused on weather, with the announcement that additional live feeds are to be released as hosted feature layers throughout the year.
The Community Maps Editor app was extended to enable you to edit commercial points of interest for basemaps. Living Atlas submissions were extended to allow dashboards created with Operations Dashboard to be submitted for review and inclusion.
Esri Maps for Public Policy
Esri released Esri Maps for Public Policy, which is powered by the Living Atlas. It’s a free resource for policy makers to actively engage in community decision making. Communities now have access to ready-to-use maps from curated datasets that help you learn more about social equity and health, economic opportunity, transportation and infrastructure, resilience and sustainability, environment and natural resources, and public safety.
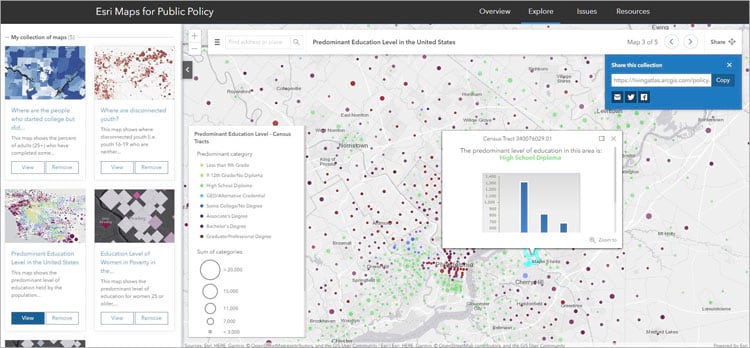
Browse existing map collections, and make your own collections to share with others and make your point. View 7 Tips for Effective Policy Maps to help make your maps more impactful and clear.
Visualize how the population has moved throughout the United States from 2015 to 2016 with a set of maps showing population flow from state to state, and county to county.
County Health Rankings 2019, a collaboration between the Robert Wood Johnson Foundation and the University of Wisconsin Population Health Institute, measures the health of nearly all counties in the nation and ranks them within states.
View the excellent policy apps and maps from the Trust for Public Land. Its ParkServe® and ParkScore® apps and maps became available in the Living Atlas and Esri Maps for Public Policy sites.
October 2019
Living Atlas apps
Living Atlas includes a collection of featured apps that enable you to unlock Living Atlas content to use it more effectively and gain understanding. You can find highlighted apps by going to the Apps tab at the Living Atlas website. Two new apps were added for this release.
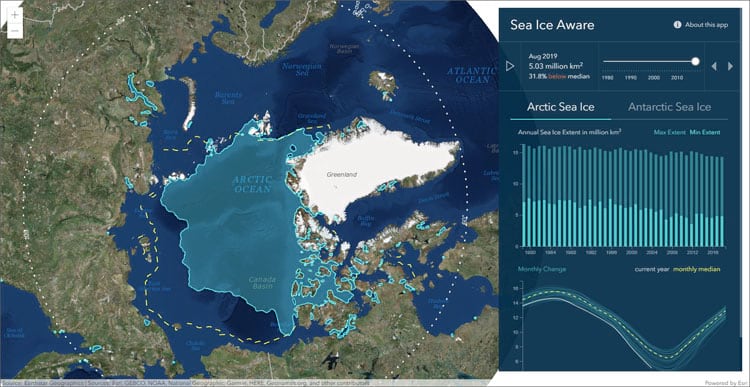
Sea Ice Aware
Areas of the ocean that have frozen are considered “sea ice” and can vary from slushy, barely solid areas to sheets of ice that are meters thick. Since the late 1970s, satellites have been used to monitor both the extent and concentration of sea ice around the world, and the National Snow and Ice Data Center (NSIDC) generates sea ice extent analyses from this data.
Hurricane Aware
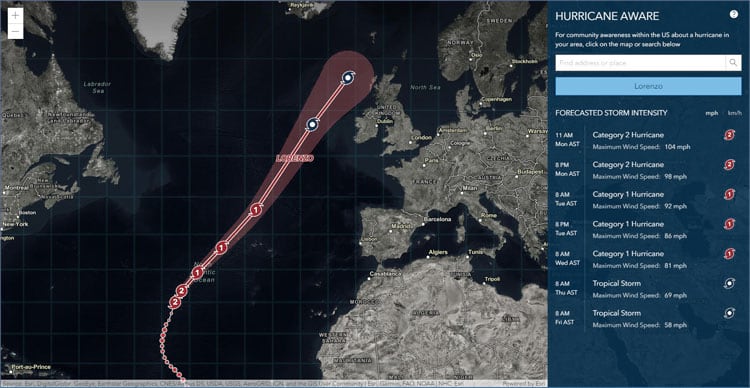
Hurricane Aware provides information about the potential impacts of tropical storms in the United States. The Living Atlas data shown here come from authoritative U.S. government sources including the National Weather Service, which provides forecasts for hurricanes, precipitation, and wind gusts. It also comes from derived American Community Survey demographic data from the U.S. Census.
Other new and updated content for this release included the following:
USA NLCD impervious surface time series represents urban impervious surfaces as a percentage of developed surface over every 30-meter pixel in the United States. The layer is organized into a time series from 2001 to 2016 for the lower 48 conterminous US states. For more information view the item details.
Critical habitat layers were updated with recent data. View a list of habitat layers.
World Database on Protected Areas (WDPA) layers were added. This content represents the most comprehensive global database on terrestrial and marine protected areas. View the list.
USA Federal Lands layers were updated with more recent information. The updated layers included:
- USA Federal Lands
- USA Fish and Wildlife Service Lands
- USA Forest Service Lands
- USA National Park Service Lands
- USA Bureau of Land Management Lands
Arctic Sea Ice Extent and Antarctic Sea Ice Extent were published in mid-June. These services include content from the the National Snow and Ice Data Center (NSIDC) showing sea ice concentration and extent analyses from a variety of microwave satellite data sources.
New USA Protected Area layers were published, extending the collection of previous layers. The USGS Protected Areas Database of the United States (PAD-US) is the official inventory of public parks and other protected open space. With more than 9 billion acres in more than 350,000 holdings, the spatial data in PAD-US represents public lands held in trust by thousands of national, State and regional/local governments, as well as non-profit conservation organizations.
The Oceans Hybrid Coordinate Ocean Model (HYCOM) layers came out of beta. View a list of HYCOM layers.
Demographic maps for Canada, Germany, Japan, Netherlands, and South Africa were updated.
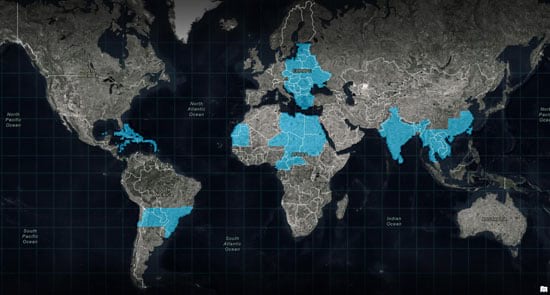
The World Imagery basemap was updated with the latest Maxar EarthWatch Vivid imagery covering all of India and the Caribbean, as well as parts of Europe, Africa, Southeast Asia, and South America.
Community Maps updates
The Community Maps Program works with authoritative GIS data contributions to build the ArcGIS Living Atlas of the World basemaps, including Imagery, Streets, Topographic, and Ocean maps.

Over 140 organizations worldwide recently contributed their content to update, enhance, and extend world referential basemap layers and imagery. In addition, new workflows became supported making sharing content easier.
Learn more about the community and what you can share, and how you can share it at the Community Maps website.
World geocoding service
The World Geocoding service was updated with point address data from BuildingFootprintsUSA. This improved the service with new locations and increased rooftop matches across the US.
Living Atlas Learn ArcGIS path
Learn ArcGIS is a website containing timely and engaging guided lessons that are based on real-world problems, covering the entire ArcGIS platform. A new Learn ArcGIS path focused on the Living Atlas was delivered. View the hands on lessons that will help you gain more from the Living Atlas.
December 2019
Living Atlas Apps
Living Atlas apps leverage Living Atlas content to create interesting and useful visualization and analysis tools. World Imagery Wayback provides a dynamic browsing and discovery experience of the World Imagery basemap archives.
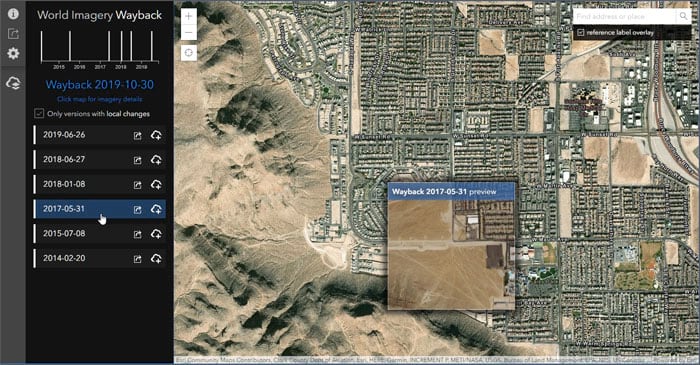
Wayback was enhanced to include better sharing capabilities, configuration options, and an improved mobile experience. For more information, see Wayback app enhancements or view other Wayback blog articles.
Geocoding
Significant improvements were made in the underlying data and capabilities for the following countries: Czechia, Denmark, and New Zealand.
Basemaps
The World Imagery basemap was updated with Maxar Metro updates for 470 cities around the world. Other basemaps were updated using HERE quarterly updates, content contributed via the Community Maps program, and OpenStreetMap refreshes. All vector basemaps are updated on a three-week cycle.
Community Maps
The Community Maps Program enables users to provide feedback, add features, and share data layers and services. Contributed content is added to Esri basemaps.
Community Maps was enhanced with improved sharing workflows, map editing, and feedback, and includes basemap updates. The new Community Maps Editor group has enabled participants to add over 80 thousand unique features since January of 2019. The Basemap and Geocoding feedback group has also increased in activity, and continues to improve Esri’s suite of basemaps with over 10 thousand feedback items.
Elevation
World Elevation dynamic image service layers (Terrain and TopoBathy ) were updated with a few high resolution datasets from Austria, Spain, USGS 3DEP and NOAA NCEI. These layers are suitable for analysis and visualization. See High resolutions updates to elevation layers for more information.
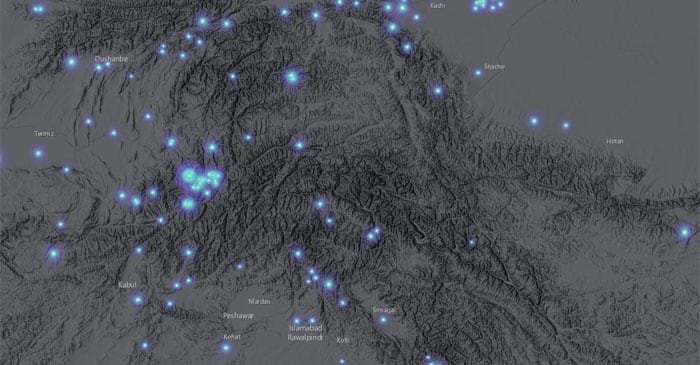
World Elevation tiled layers (World Hillshade, World Hillshade (Dark), Terrain 3D and TopoBathy 3D) became enhanced with many high resolution elevation datasets including USGS 3D Elevation Program (3DEP) at 1 m resolution, Estonia (1 m resolution), Grand Geneva (50 cm resolution), Tyrol and Carinthia, Austria (5 m resolution), and several cantons in Switzerland; and Basel-Landschaft (25 cm resolution), Solothurn (50 cm resolution), and Aargau (50 cm resolution).
Environment
Critical marine spatial planning layers underwent maintenance that automates updating when the underlying source data is updated, changed or modified. These hosted feature services are fully functional and can be used for visualization and analysis. Updated layers included the following:
- USA Active Oil and Gas Lease Blocks
- USA OCS Lease Blocks
- USA Offshore Pipelines
- USA Official Protraction Diagrams
- USA Outer Continental Shelf Planning Areas
- USA Shipping Zones
- USA Territorial Sea Boundary
- USA Unexploded Ordnance
- USA Deepwater Ports
- USA Anchorage Areas
The Federal Emergency Management Agency (FEMA) identifies Special Flood Hazard Areas as part of the National Flood Insurance Program’s floodplain management. Esri provides an image service and a hosted feature service for both raster and vector analysis. The following FEMA flood hazard layers have been updated:
- USA Flood Hazard Areas
- USA Flood Hazard Areas (update in-progress)
The USGS National Hydrography Dataset (NHD) layers represent the water drainage network of the United States. These layers show key features of the National Hydrography Dataset Plus Version 2.1, which is a geo-spatial, hydrologic framework dataset created by the USGS and used for many types of modeling applications. NHD layers have been published in a variety of formats as follows:
- National Hydrography Dataset Plus Version 2.1 – hosted feature layer
- National Hydrography Dataset Plus Version 2.1 – vector tile layer
Other updates include:
- GEOGloWS ECMWF Streamflow System (6 Day Forecast)
This map service is designed for fast data visualization of Global Stream Flow forecast for over 1 million reaches across the globe. - Earthquakes live feeds (item page link coming soon)
This layer displays recent earthquake information from the USGS Prompt Assessment of Global Earthquakes for Response (PAGER) program. In addition to displaying earthquakes by magnitude, this service also presents earthquakes by impact. Impact is measured by population as well as models for economic and fatality loss. This layer is transitioning to hosted feature services, and will no longer require subscriber access.
Demographics
The American Community Survey (ACS) is an ongoing survey by the U.S. Census Bureau. It compiles information such as ancestry, citizenship, educational attainment, income, language proficiency, migration, disability, employment, and housing characteristics.
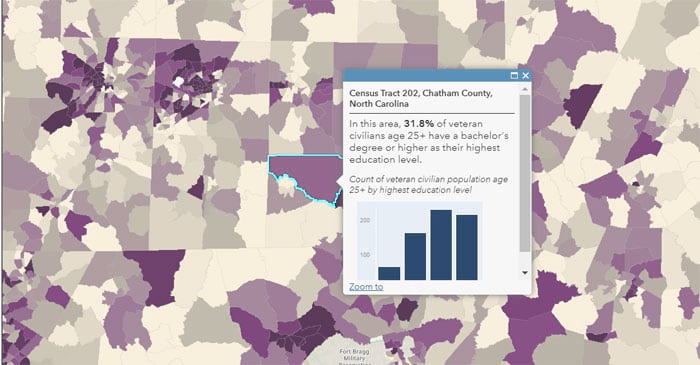
Living Atlas ACS layers were updated with new Census data. The Living Atlas ACS layers include 78 items containing the most current information, with 5-year estimates on demographic, housing, and workforce characteristics of the U.S. population. New layers included:
- ACS Education by Veteran Status (centroids and boundaries)
- ACS English Ability and Linguistic Isolation Variables (centroids and boundaries)
- ACS Labor Force Participation by Age Variables” (boundaries and centroids)
- ACS School Enrollment Variables (centroids and boundaries)
- ACS Housing Tenure by Heating Fuel Variables (centroids and boundaries)
- ACS Housing Tenure by Heating Fuel VariaACS Housing Costs by Age Variables (centroids and boundaries)
In addition to new topics, the layers have improved metadata in the form of long field descriptions for each attribute, providing users with definitions that are helpful when deciding which attributes are most appropriate for their needs. For more information, see Updates to American Community Survey Living Atlas layers.
Miscellaneous Living Atlas additions
Other maps and layers that were recently added to the Living Atlas included the following:
- HUD Fair Market Rents
- CalFire Fire Perimeters 1878 – 2018
- Monopoly Map of housing values
- Where are extreme commuters?
- Projected Population Change 2010-2023
For the latest
For all the latest information, see the Living Atlas blog. For news and announcements regarding Living Atlas content in the coming year, stay tuned to the ArcGIS Living Atlas of the World website.
See also: 2019 ArcGIS Online year in review.

Commenting is not enabled for this article.