During Esri’s 2025 Federal GIS conference, MITRE President and CEO, Dr. Mark Peters, delivered a keynote address highlighting MITRE’s success supporting federal sponsors with its deep technical expertise and robust understanding of geospatial infrastructure. Following his remarks, Dr. Alex Philp and Ryan Hollins (MITRE), with Amy Clarke (Esri), shared a demonstration of “Project Homeland,” an ongoing effort to understand critical infrastructure dependencies and identify system vulnerabilities to boost resilience against compounding threats such as extreme weather events and cyber-attacks. Their demonstration highlighted the use of ArcGIS Knowledge, showcasing the value of applying spatial graph analytics to solve real-world problems. It emphasized how ArcGIS Knowledge can help users to discover critical vulnerabilities within a complex network of data.
MITRE
For the past 65 years, MITRE has operated as an independent, leading technology and research development company. With cross-domain technical knowledge and expertise, MITRE delivers a data-driven, system-of-systems approach to engineering united under a single mission: to solve problems for a safer world. Over the years, they have collaborated with government agencies, industry partners, and academic institutions to address challenges in both civilian and defense sectors by way of their public-private partnerships and federally funded research and development centers (FFRDCs). As a not-for-profit institution dedicated to the public interest, they serve as a trusted national resource.
Project Homeland
MITRE launched Project Homeland to provide dynamic situational awareness of critical infrastructure networks and bolster systemwide resilience. Threats such as extreme weather events, natural disasters, cyber-attacks, or even acts of violence or terrorism, can have cascading impacts on these systems. Using ArcGIS, Project Homeland is developing new approaches to illuminate the hidden dependencies within critical infrastructure networks, simulate real-world impacts on these systems, and identify upstream vulnerabilities. Together ArcGIS helps MITRE and their federal and local partners prioritize mitigation efforts to reduce risk and strengthen systemwide resilience.
MITRE is using ArcGIS Knowledge to apply spatial knowledge graphs and graph databases to analyze both spatial and non-spatial data. The combination of spatial entities such as hospitals, water pumps, and electrical substations with non-spatial entities like computer operating systems, application software, and other dependencies provides a deeper understanding of how these systems rely on and work with each other. Modeling this data in a spatial knowledge graph helps them find data-driven insights, such as hidden vulnerabilities and potential mitigations.
Watch the full demonstration, and read below for more details.
Fort Lauderdale
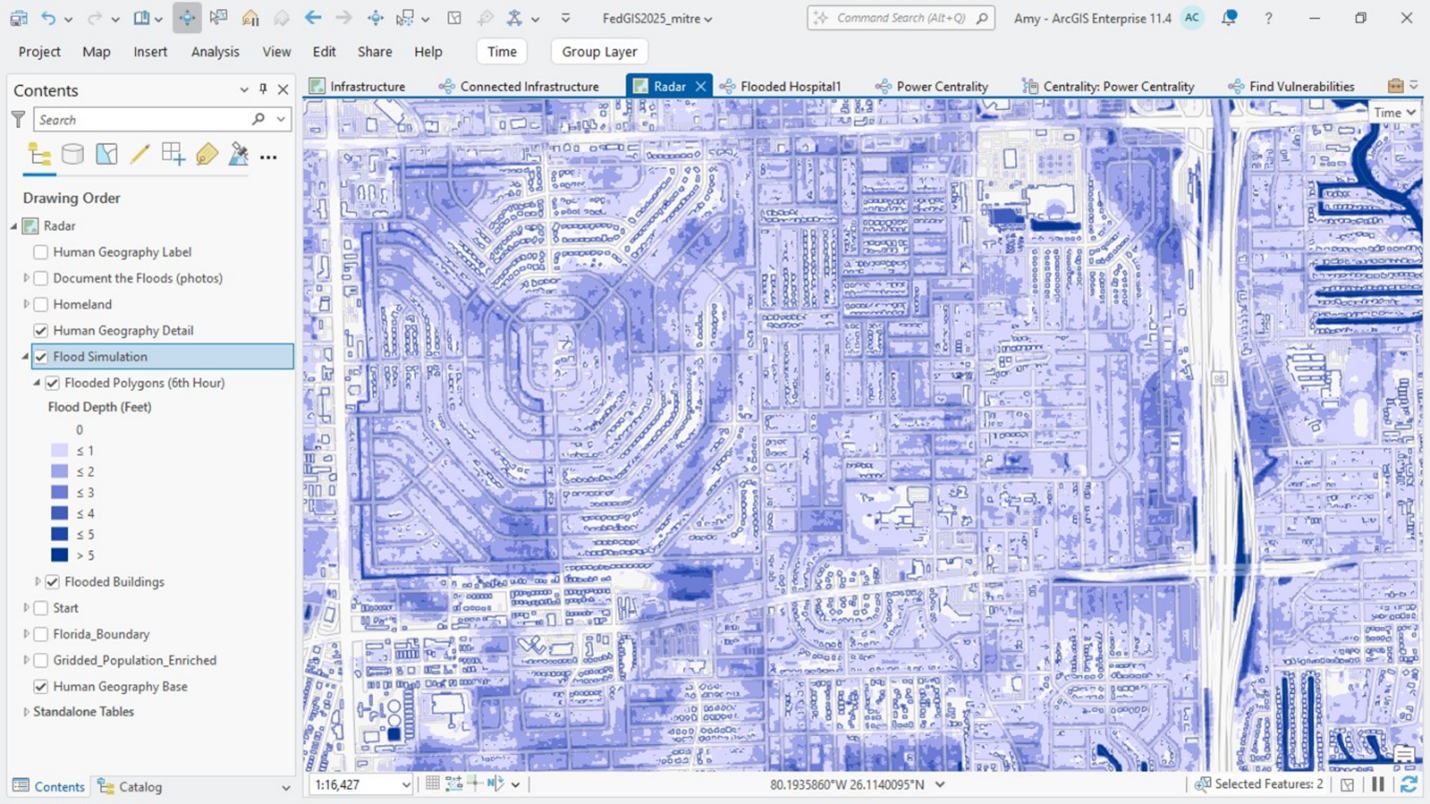
The pilot for Project Homeland was modeled around a hybrid threat scenario in Fort Lauderdale, Florida. The first threat they chose was extreme weather; specifically, a simulation of the historic April 2023 rainfall event that caused severe flooding in the Fort Lauderdale area. MITRE used the Flood Simulation tools in ArcGIS Pro to generate detailed flood data for a scenario modeled on that storm. Analyzing the output layers, they identified roadways, buildings, and utilities that would most likely be flooded during this type of extreme weather event. They also looked for neighborhoods that may be disproportionately affected, such as places where flooded roads hinder communities from evacuating to nearby emergency shelters, as well as critical functions that may be serviced by facilities which were inundated by floodwaters.
For this scenario, we used publicly available information about critical infrastructure facilities in Fort Lauderdale. This included hospitals, power plants and substations, cell towers, wastewater treatment facilities, emergency shelters, police and fire stations, and communications facilities. However, simply knowing where these facilities are located is not enough. MITRE wanted to illuminate hidden vulnerabilities in these networks. To accomplish that, they needed to understand how they’re connected and explore the interdependencies among these facilities. That’s where ArcGIS Knowledge comes into play.
ArcGIS Knowledge
MITRE wove the disparate infrastructure map layers together by building an ArcGIS Knowledge graph that models these dependencies as relationships in a network. By modeling this “system of systems” as entities and relationships in a knowledge graph, they were able to discover new insights about potential vulnerabilities in the system.
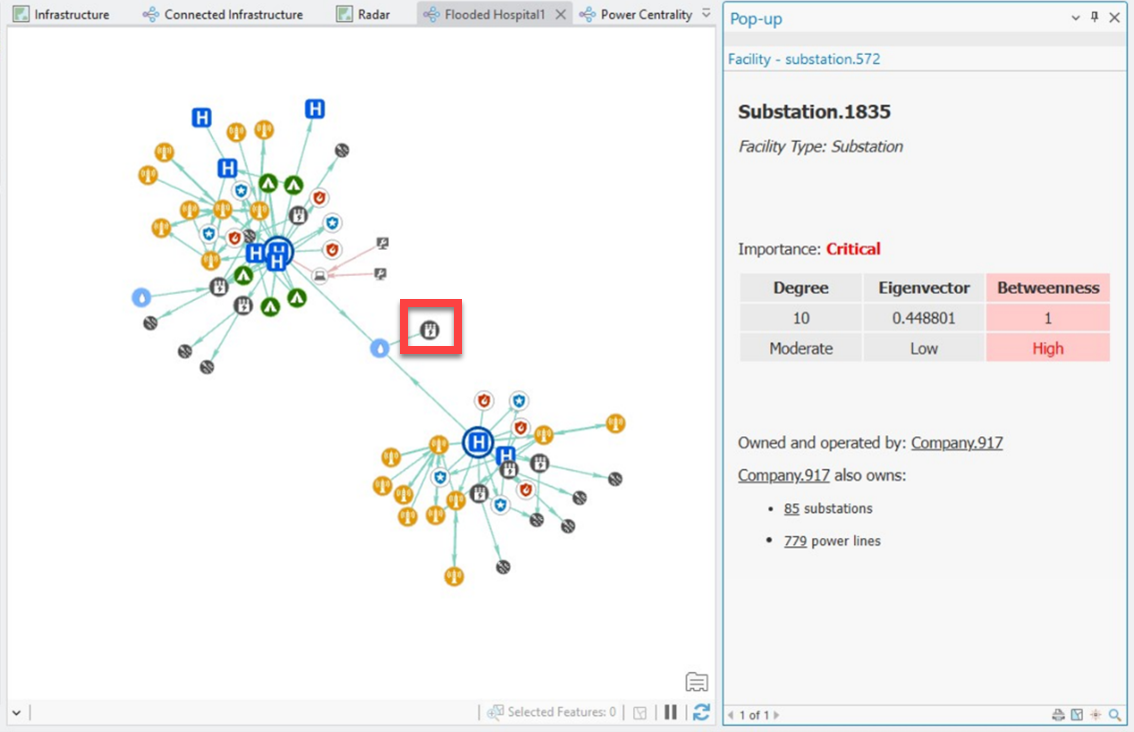
As an example, we looked at the two hospitals in the study area that were not inundated by flooding (in the simulation). Their dependencies on other infrastructure and services are represented as relationships in the knowledge graph, and by traversing those relationships we can easily identify second, third, and fourth-order effects, cascading through the network. Looking at a complex threat scenario, we can analyze relationship patterns proactively to identify potential vulnerabilities in the network.
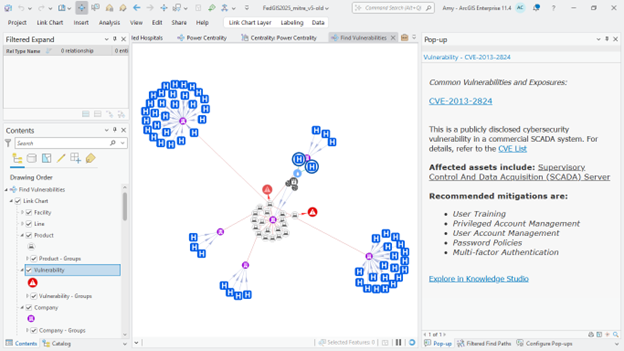
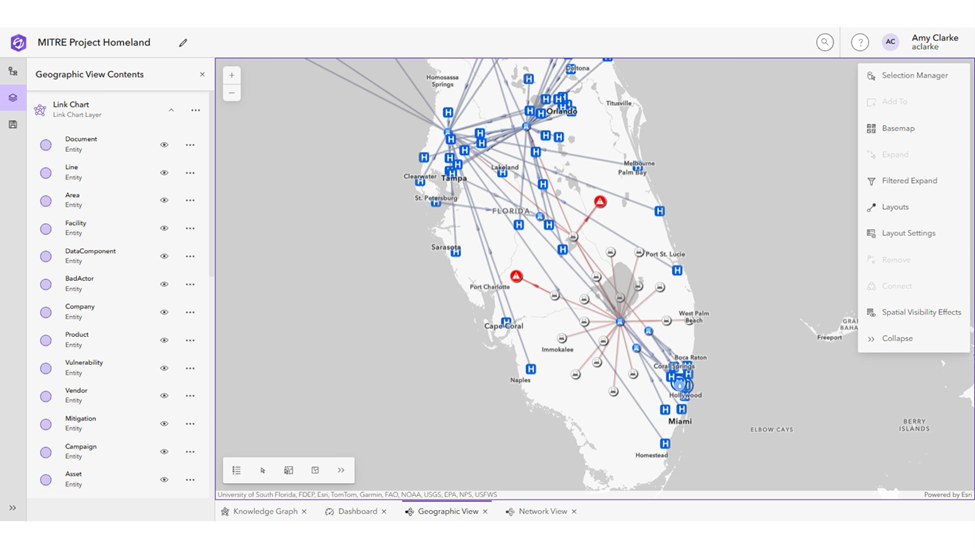
For instance, we discovered a cybersecurity vulnerability in the SCADA software used by the contractor who maintains a power substation that powers the drinking water treatment facility that the hospitals both depend on. We further learned that same vulnerability exists in other SCADA software used at several other hospitals (as shown in the next image), which means that the overall composite risk to the entire system is much higher than it appears when looking at one single system. If these cyber vulnerabilities were to be exploited while the region was also experiencing an extreme weather event, even the hospitals that were not inundated by flooding could be crippled.
If this sounds eerily familiar, similar scenarios have played out in real life, where critical infrastructure has come under attack from multiple different threat vectors at once. For example, in early October 2018, a North Carolina water utility was hit with a ransomware attack while the state was still reeling from devastation caused by Hurricane Florence.
With ArcGIS Knowledge, MITRE is able to trace the cascading impacts on critical infrastructure in these scenarios and identify and prioritize appropriate mitigations.
Knowledge Studio
As MITRE identifies new threats and potential cascading impacts on critical infrastructure, they use Knowledge Studio to share their findings. Knowledge Studio is a web-based application for using maps, link charts, and data cards to explore connected data in ArcGIS. A “geographic link chart” view combines a geographic perspective and link analysis perspective, which can show things that are not normally represented on a map such as nonspatial data and relationships (or dependencies). With the information connected in ArcGIS using knowledge graphs, analysts and decision-makers alike can visualize and explore these new insights using tools like Knowledge Studio. Ultimately, the ability to see these connections, explore all the data in context, and discover new data-driven insights helps stakeholders to work toward their mission more efficiently.
Conclusion
With Project Homeland, MITRE is using ArcGIS Knowledge to develop data-driven approaches to mitigate risk within critical infrastructure systems. ArcGIS is helping MITRE to illuminate potential vulnerabilities and understand the outsized impact these key junctures may have on the broader system, allowing them to develop mitigation aimed at reducing the greatest overall risk. Through partnership with MITRE, the public sector can use this approach to efficiently allocate resources and proactively increase community safety, security, and resilience, even in the face of compounding threats.
ArcGIS Knowledge offers market-leading mapping and spatial analytics alongside graph analysis tools at enterprise scale. If you have any questions about ArcGIS Knowledge or are interested in how it can add new insights to your own business, please reach out to your Esri account representative or visit the ArcGIS Knowledge product page.


Article Discussion: