With the release of version 11.4 for ArcGIS Enterprise, we are excited to announce the latest updates to ArcGIS Knowledge, including new features, enhanced capabilities and improved user experiences across supporting desktop and web applications. In this article we will explore a few key updates to ArcGIS Knowledge and how those updates improve functionality in ArcGIS Pro, ArcGIS AllSource, Knowledge Studio and other ArcGIS web applications.
These enhanced capabilities and improved user experiences will include:
- Unified default symbology for knowledge graphs across desktop and web apps
- Web Map support in Map Viewer, Dashboards and other ArcGIS web apps
- Timeline layouts in link charts
- User-friendly graph query parameters in Knowledge Studio
Unified Default Symbology
ArcGIS Pro, AllSource, Knowledge Studio, and applications supporting Web Maps can now use the same default symbology, labels and pop-ups saved with your knowledge graph, ensuring a more streamlined and consistent user experience across desktop and web applications. Analysts can now save the symbology and other custom settings as default properties for Knowledge Graph layers directly within the Knowledge Graph enterprise service. Those default symbology and other properties are then automatically applied when another user opens that Knowledge Graph in supported desktop or web apps. This feature helps analyst teams share their work more quickly and enables new analysts on their team to get started more efficiently with enterprise knowledge graphs in ArcGIS desktop and web applications.
Saved Default Properties options include:
- Symbology display settings
- Pop-ups, including custom Arcade expressions
- Labels
- Investigation Overview settings
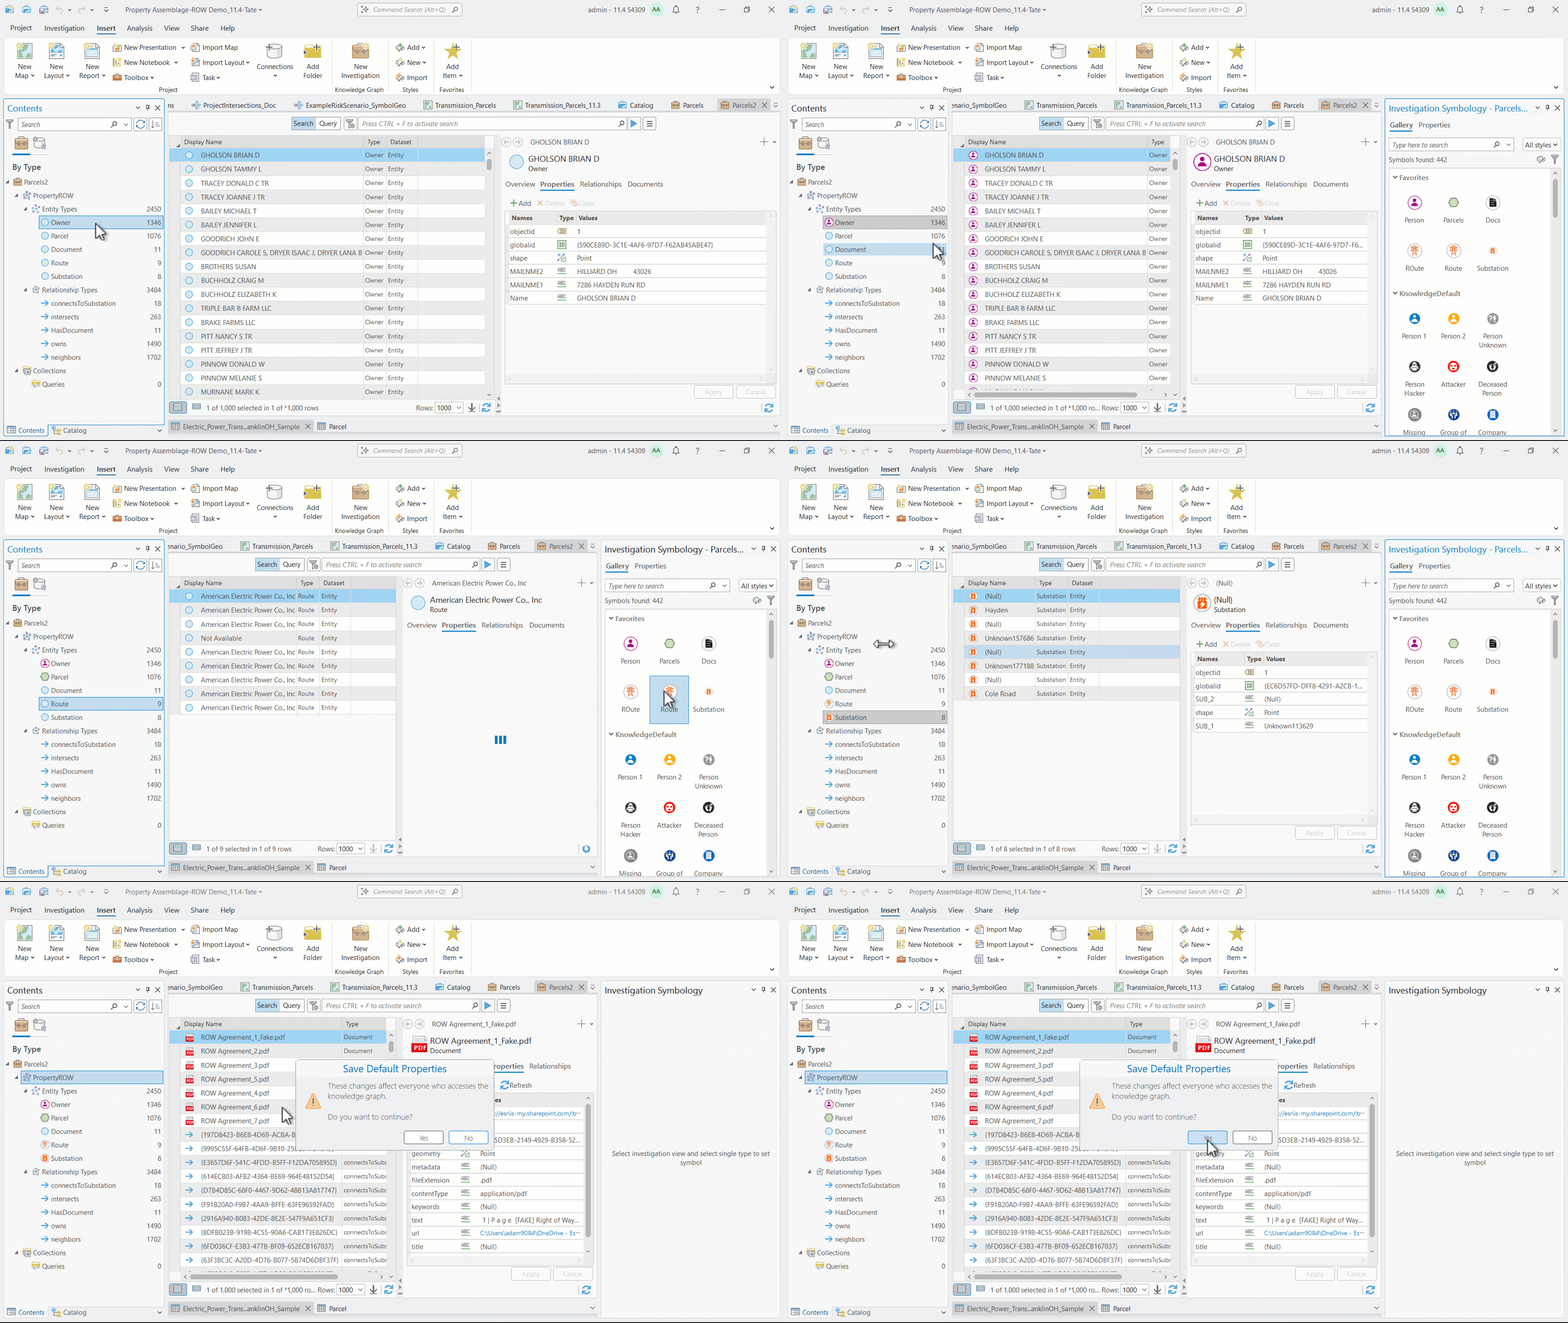
How to save default Properties
Default Symbology and other settings can be saved for each Knowledge Graph and saved Knowledge Graph layer specific to 3 key views: Link Charts, Maps, and Investigation views.
-
Within an Investigation, Map or Link Chart, set up your symbology and/or configure popups for your Knowledge Graph layer
-
Right click on a Knowledge Graph Layer within your Contents Pane or find the and select Save Default Properties
-
Use Manage Default Properties button to explore which layers have saved settings and to delete them
For existing users of Knowledge Studio in ArcGIS Enterprise 11.3, this new feature will eliminate the need for analysts to publish a Web Map or Web Link Chart from the desktop and import it into a Knowledge Studio project to enable other web users to get the benefits of symbology and pop-up settings.
Web Map and App Support for Knowledge Graphs
Web Maps with Knowledge Graph Layers are now supported in more ArcGIS web applications, allowing users to share results of analyses in maps with stakeholders in greater variety of ways.
Users can open knowledge graph layers directly into the Map Viewer from their ArcGIS Enterprise item catalog. After saving a Web Map in the Map Viewer, or publishing one from an ArcGIS desktop application, users can also add these Maps to ArcGIS configurable, off-the-shelf (COTS) applications, such as:
- Dashboards
- Experience Builder
- StoryMaps
- Instant Apps
This enhancement allows users to easily view and filter Knowledge Graph layer, view symbology, edit layer effects, view and edit labels, and view pop-ups within the Web Map viewer and these other applications.
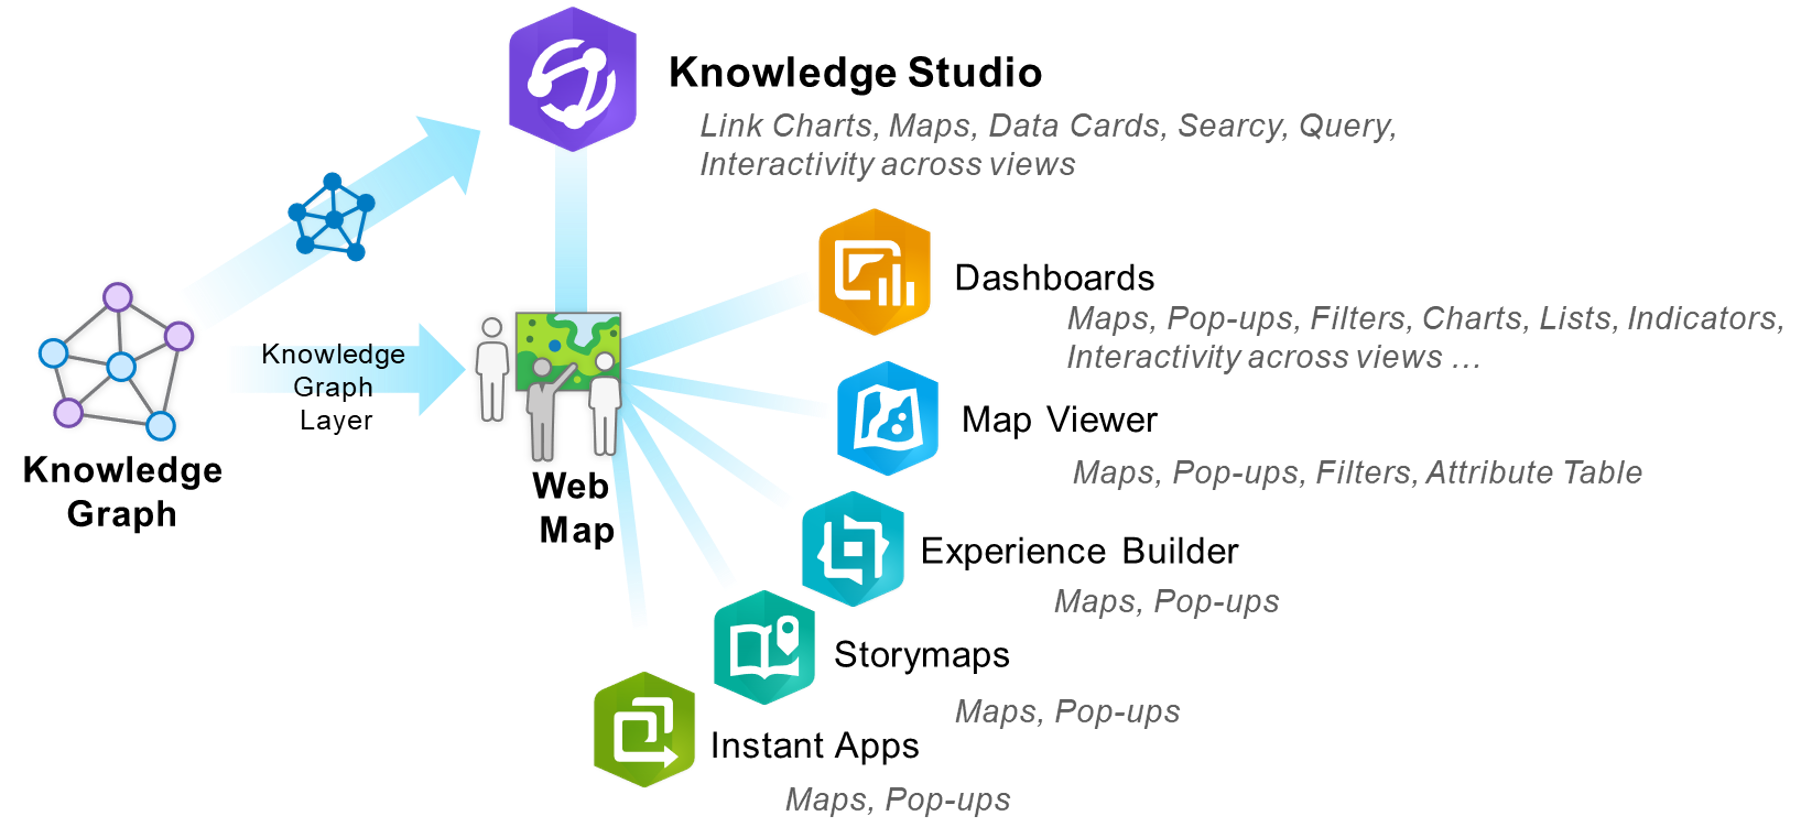
ArcGIS Dashboards, in particular, provides a dynamic exploration experience across all of its configurable dashboard elements, such as Charts, Lists, and Indicators and enables cross-filtering actions across these elements.
With the other applications, the functionality is centered primarily around viewing the Web Maps. Not all of the editing or data-driven functionality that is supported with Feature Layers is available yet for Knowledge Graph layers. However, future releases will see increased flexibility and functionality using Knowledge Graph layers as data sources within these applications.
Timeline Exploration for Knowledge Graphs
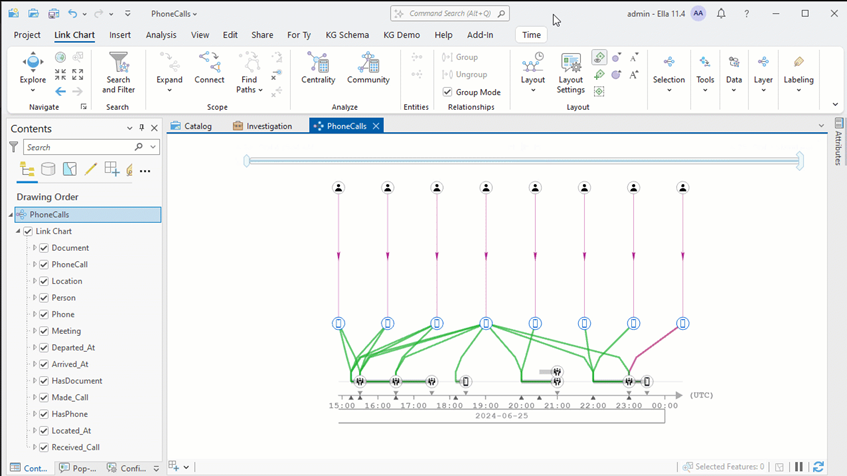
Two new timeline visualization options within Link Charts now leverage time properties in your knowledge graphs, enhancing the depth and breadth of analytical options for time-critical use cases. Analysts can now display their connected data within dynamic chronological layouts, allowing them to easily explore how entities are related while also ordering entities and relationships in time. This feature enables more comprehensive and dynamic data analysis for customer lifecycle, logistics, financial transactions and crime analyses use cases, to name a few.
These new chronological layouts work in ArcGIS Pro, AllSource and Knowledge Studio, and provides two new layout options: single timeline or multi-timeline. The single timeline puts all time-based entities in the same timeline, while the multi-timeline layout will separate them into multiple lines, one for each related entity. The date-time property can be specified for each layer in the Link Chart and must of the data field type: timestamp offset.

User-friendly Graph Query Parameters
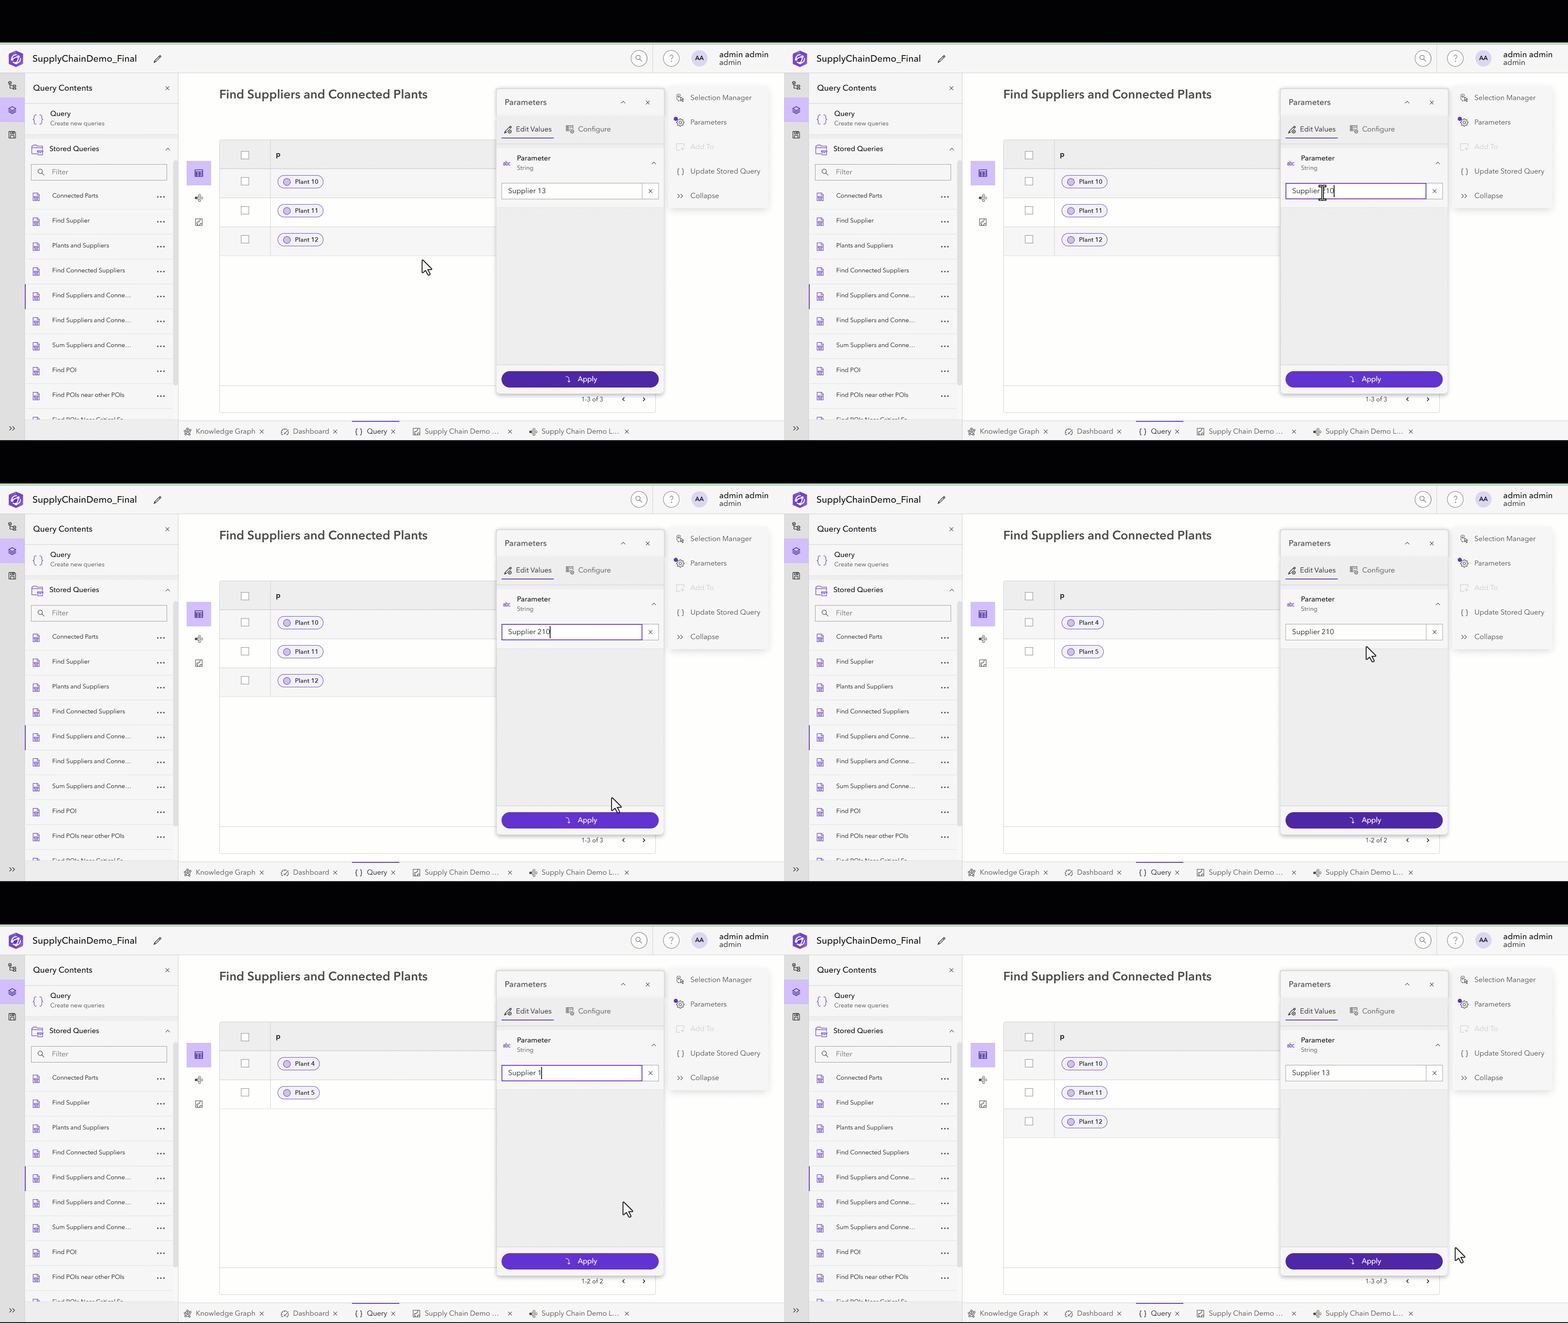
Knowledge Studio now features user-friendly query parameters for editing powerful graph queries. These new query parameters, or variables, will help new analysts and stakeholders edit saved graph queries, while hiding the complexity of the graph queries behind the scenes. Therefore, users with little experience with graph queries can swiftly open a Knowledge Studio project with number saved queries. Then they can simply edit parameters such as a specific text, date, or number field. Then hit apply and get the new results tailored to their question or specific interest.
For example, your project has a saved queries that looks for all suppliers and buyers downstream from a particular Supplier, Supplier A. A user could use the query parameter for the Supplier Name value, and simply type “Supplier B” into a simple interface, to see its downstream suppliers and buyers. No delving into the query syntax! This is just the beginning of additional features to enhance interactivity and ease of use of graph queries.
Conclusion
These updates enhance the capabilities and workflows of ArcGIS Knowledge, empowering analysts and stakeholders to explore, visualize, and analyze their enterprise knowledge graphs with ease. Stay tuned for more exciting features and enhancements in the future! For more information and to get started, visit our product page or contact our support team.


Article Discussion: