ArcGIS Knowledge introduces compelling new graph analysis capabilities to explore spatial and non-spatial relationships in ArcGIS Enterprise and ArcGIS Pro.
It enables organizations to identify and understand the complex relationships that are found within vast amounts of data using the power of graph databases.
And now, developers can leverage the ArcGIS Knowledge Server REST API to build web applications where this interconnected data can be visualized on any device with a web browser. The REST API can be used to perform graph queries across relationship links, edit entities, edit relationships, or even to edit the data model of the graph itself.
Scenario
To see the real power of this capability in action, consider a farm-to-table supply chain scenario. Food supply chains are important when considering ingredient sourcing for freshness or when tracing the origin of foodborne illness.
In this example:
- A farm produces fresh produce and goods
- Many vendors purchase goods from these farms
- Vendors supply these goods to participating restaurants as ingredients
- Customers patronize these restaurants to consume menu items made from ingredients
The flow of the food supply chain can be visualized from farm to customer or from customer back to farm with a directed graph structure.
Graph databases, such as those that power ArcGIS Knowledge, structure data differently than the rows and columns of a traditional database, and emphasize the patterns that define the relationships between entities.
Visualize results
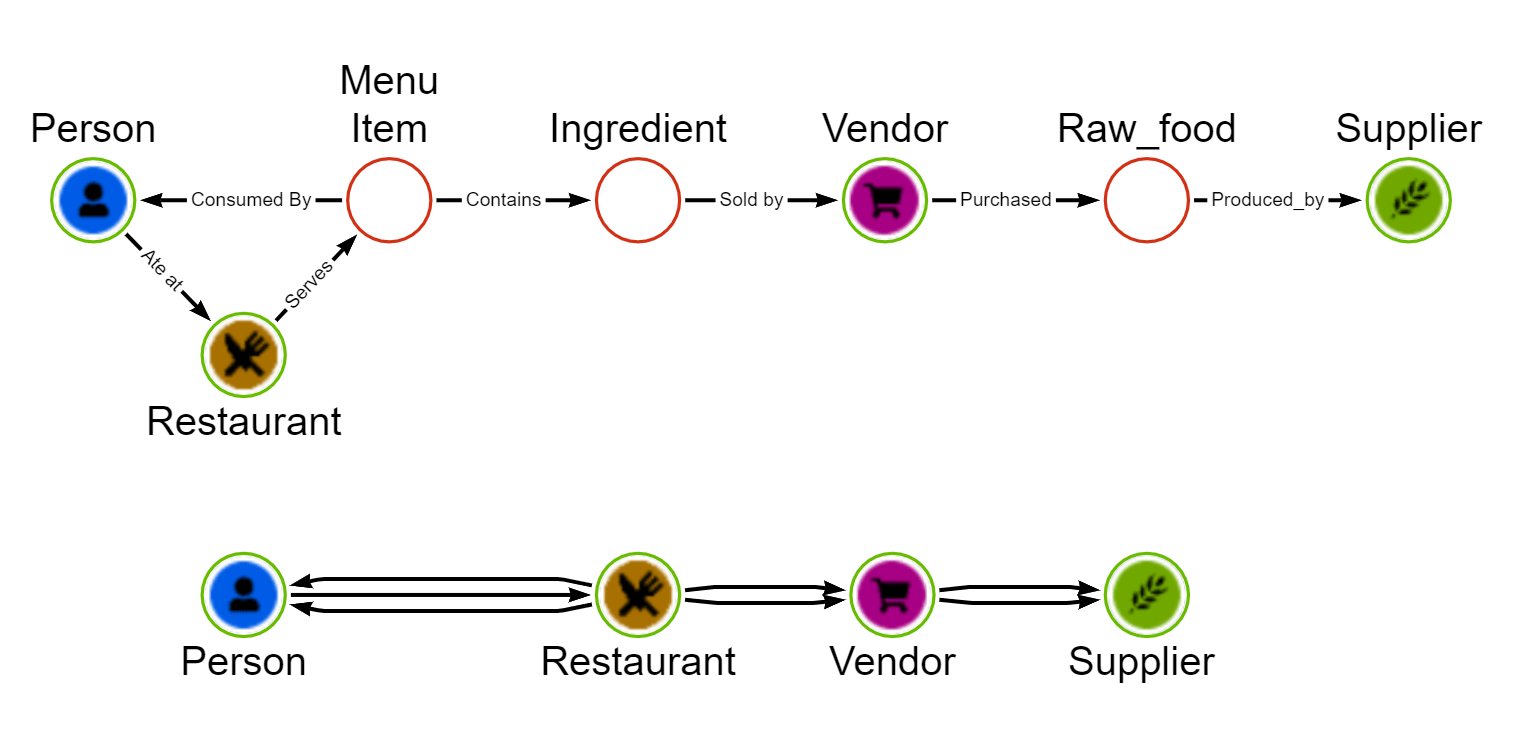
For this scenario, a supply chain has been modeled in a graph schema as shown in the diagram below.

The various geospatial entities are in the diagram represented with icons. These entities are connected to each other through to non-geospatial entities, such as the food a vendor buys from a farm supplier, or the meals that are consumed by a person dining at a restaurant.
However, to meaningfully visualize the supply chain in a geospatial context, the user needs the geospatial entities to be directly connected on the web map scene if a valid path exists between them.
Using the services and data of the REST API, the web app finds the valid paths between geospatial entities via non-geospatial intermediary entities.
These paths are then rendered as direct lines between entity locations. Furthermore, finding this information allows the user to select a particular entity and visualize the up and downstream supply chain flow.
About the APIs
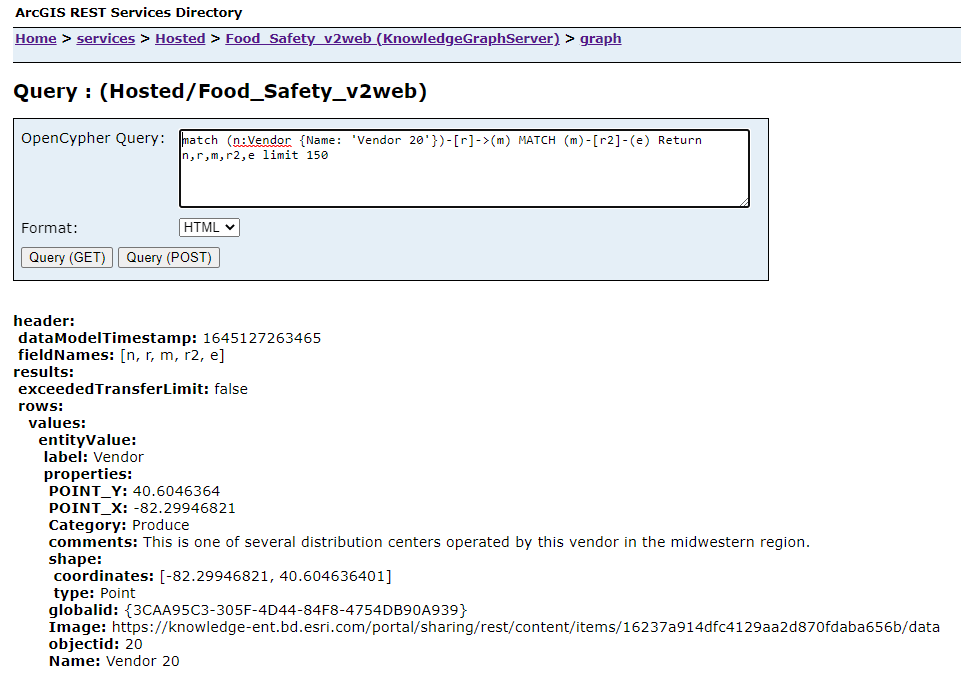
The Knowledge Graph Service APIs are in the ArcGIS REST Services Directory and organized with a similar structure to other service APIs such as map and feature services. They have similar endpoints to perform data transaction operations like query and apply edits.
One significant difference is that ArcGIS Knowledge is powered by a graph store instead of a relational database. As a result, when querying data, you will use openCypher instead of SQL. This allows you to structure queries that match patterns across the graph, to enable analysis. This workflow would be very difficult to achieve using a traditional relational database.

Regardless, these APIs and underlying data can be consumed by both Esri and non-Esri libraries. For example, the following web app was built using non-Esri tools to visualize the same farm-to-table supply chain scenario.
The web app uses a Force-directed graph drawing, is powered by the Open Source D3 graphics rendering library, and was enhanced with added additional functionality, such as expandability. The Material-UI component library provides flexibility to visualize the underlying data using a variety of tabular formats.
Conclusion
We’re excited for the future of graph data with ArcGIS and are looking forward to seeing what you, the developer community, can build with graphs powered by ArcGIS Knowledge services.


Article Discussion: