Welcome to Week 1 of ArcGIS Hub’s Civic Analytics with Notebook Series. If you missed our announcement of our new Civic Analytics with Hub community, I invite you to check it out and join our community.
Introduction to spatial and temporal analysis
This week we start with notebooks that focus on exploring and understanding the spatial and temporal aspects of street crashes in Ottawa Canada in 2018. We also have a guide to walk you through the process of finding and using data in notebooks.
For those looking, here is a great interactive Python tutorial and resource for the ArcGIS API for Python. And if you are new to ArcGIS Notebooks and would like to learn how to get started, we have this step-by-step tutorial for you.
Spatial analysis is how we understand the space around us and the world. It helps us solve complex location-analytics problems. A temporal understanding of data helps us see if patterns are consistent over time and to detect unusual patterns if any. We can check for the presence of cyclic patterns by time of day, day of the week, or season or we can compare spatial patterns that match socioeconomic or infrastructure and access. With these insights we can then advocate for improvements to services or civic infrastructure.
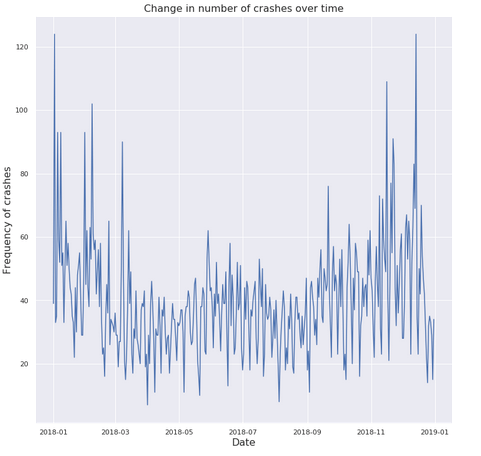
We focus on fetching data and highlighting the distribution of crashes across space and time to gain a more visual perception of civic data beyond the usual tabular structure. Starting with a simple spatial analysis that gives us a bird’s eye view of the volume of crashes in Ottawa we proceed to aggregate them by each municipality to get a visual sense of high-impact zones. The temporal analysis aggregates and visualizes these crashes based on day, time of day and month of year giving us a visual summary of data condensed as shown below.


You can participate in the discussion thread for this week’s notebooks on our Geonet thread. Additionally, I welcome you to share your analysis notebooks and results of your experiments with our notebooks in our Geonet community. Use this community as a platform to share results from your experiments with these notebooks, exchange ideas, start discussions and get in touch with like minded community members to understand and explore civic data to new depths.
Links to this week’s notebooks:
Click here to learn more about Week 2 of Civic Analytics with Hub.

Hello Manushi – I’m Mark from Coral Gables Florida. Don’t know why I’ve not found this information earlier but I’m here now. I’m interested to step through these lessons and learn some new ways to engage our citizens with our own civic data. I don’t see a link or detail information on the first lesson. I’m running the 1st notebook, but don’t see documentation on its code components. Is the kept anywhere in the lessons? I’m also doing the Going Places with Spatial Analysis MOOC so I think these blog posts will tie in nicely. Thank you for your time… Read more »