With the ArcGIS platform, you’ll never find yourself lacking for an app or method to help visualize progress toward a project’s completion.
A Key Performance Indicator (KPI) is a measured value that demonstrates progress toward a goal or objective. Planners and analysts use them to understand status, evaluate project feasibility or measure performance toward specified goals. KPIs can be derived by defining equations based on attributes from plan layers, scenarios, and contextual data using mathematical equations.
ArcGIS GeoPlanner could display a series of KPIs in a dashboard style as indicators and gauges. As GeoPlanner sunsets, creating KPIs using ArcGIS Experience Builder or ArcGIS Dashboards will provide continuity to project evaluation workflows.
This blog article highlights workflows using the following methods:
- ArcGIS Experience Builder
- Chart widget
- Text widget
- ArcGIS Dashboards
The workflows outlined here leverage the feature service from a GeoPlanner project as the input layers defining KPIs.
Use Chart and Text widgets in Experience Builder
Experience Builder is an option when it comes to visualizing progress of a project.
Use the Chart widget
The following steps provide guidance around the Chart widget in Experience Builder.
1. Open the Experience Builder app to begin.
2. Create a new experience and add the Map and Edit widgets to the canvas by either using a template containing the widgets or starting with a blank template.

3. In the Map widget settings, choose a web map and confirm it appears in the canvas.
4. In the Edit widget, specify the map you just added. Optionally, add the layer from the map as an editable design layer or use the Import All button.
This experience can be used for design purposes and to further populate chart indicators as outlined below.

Next, you’ll recreate the gauge style present in GeoPlanner.

5. Add a Section widget to the page and size it similarly to following screenshot:

6. Add a Chart widget on the Section widget and set it to full size so it fills the Section widget.
7. Select the design layer as the data of interest.
8. Choose the Gauge chart type.
9. Choose the statistics type.
You’ll sum the values of the Conifer temperate dry field.

10. Customize the other parameters.
This example uses a minimum value of 0 and a maximum value of 100.
11. In the Gauge settings, add a guide.
This example uses two guides: one to measure under-performance and another to measure ideal performance.

12. Optionally, shorten the height of the Chart widget so that there is about 15 percent space above it for a title and add a text widget into the space.
Modify the font size and weight as necessary.
The KPI is complete.

13. Click the settings for the Section widget that contains the Gauge widget, and choose Duplicate to create a copy and compare it to the other designs in the map.
14. In the duplicated Gauge widget, choose an alternative field.
15. Update the duplicated Text widget in the section widget duplicate to reflect that it is a new chart.

16. Lastly, in the settings for the Section widget, enable Arrows to move between the two KPIs.

Use the Text widget
Complete the following steps using the Text widget in Experience Builder:
1. Repeat the Experience Builder opening steps above to start a layout.
2. Add a Text widget.

3. Sum the values of a single field using the dynamic content capability of the text widget.
4. Connect the widget to the data source that contains your designs or feature template.

5. In the Dynamic content pane, click the Statistics tab.
6. Update the operator to Sum and choose which field to total.
7. Click Insert.
The equation appears in the text box and reflects the total value when you click away from it.

8. Next, add text and format it as necessary.
This example contains a title and unit of measurement. The font size is updated and the text is a bold format.

Create a KPI dashboard using ArcGIS Dashboards and Arcade
Complete the following steps to use Arcade in the Dashboards app to visualize progress:
1. Create a new dashboard.
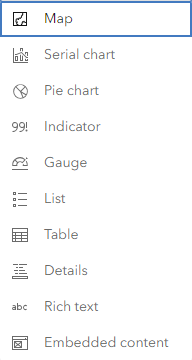
2. Add an element such as a pie chart or gauge.

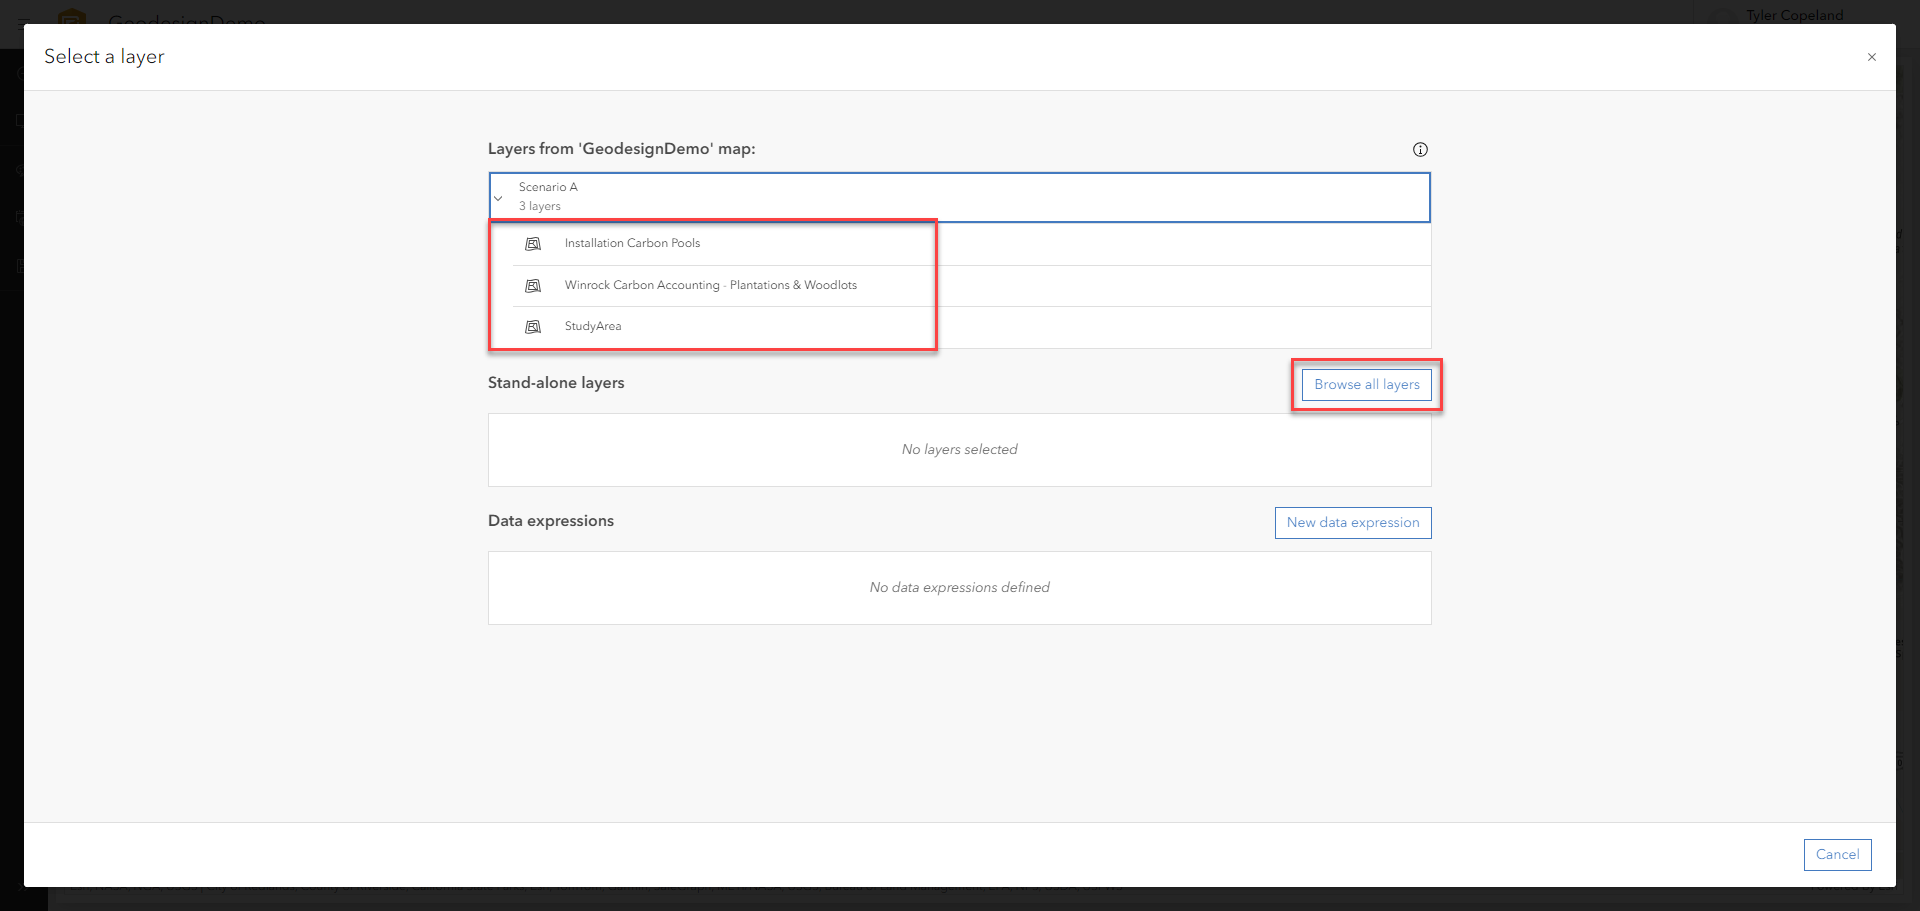
3. When prompted to select a layer in the element’s settings, specify a design layer. This will be your layer of interest.

4. Optionally, enable advanced formatting with the List, Table, or Indicator elements in their settings. Ensure that the data options have been properly set for advanced formatting to become available.
- List—Click the List tab, and click the Enable button next to Advanced formatting.
- Table—Click the Values tab, and click the Enable button next to Advanced formatting.
- Indicator—Click the Indicator tab, and click the Enable button next to Advanced formatting.
Advanced formatting allows you to account for shape area in a calculation against your field of interest.
5. Create an Arcade data expression that uses your design geometry to calculate general area.
Note:
Make sure to consider the following:
- Unit of measurement—You may need to convert the unit of measurement for the area of interest, for example, hectarage.
- Variables—Additional, or alternative, Arcade functions may be required to take variables such as map projection into account. For example, the AreaGeodetic function considers Earth’s curvature when calculating area.
The following screenshot indicates the total impact of conifer trees for each design area in hectares.

6. Under the script, enable Refresh script.
This will refresh the script as new designs are made. The interval is set to a refresh rate most appropriate for your project and can be adjusted.

Currently, this indicates impact based on individual features. To generate a cumulative sum across all features at a site level, you must create an advanced data expression.
7. Similarly, to calculate the total area of the designs, use Advanced formatting with a sum expression and the Shape_Area field.


For a deeper dive, check out sample expressions, including summarizing the spatial relationships between layers.
To summarize, ArcGIS tools and workflows can help digitize your organization’s planning workflows by using comprehensive methods that include Dashboards, Arcade, and Experience Builder.
Commenting is not enabled for this article.