Introduction
🌍 🌐 Hello, I’m Shashwot, an intern at Esri! During my time as an Esri Intern, I embarked on a fascinating project that combined my love for maps with the power of Python. Through this guide, I’m excited to share how we can utilize the ArcGIS API for Python within Google Colab to explore vast realms of geographic information systems (GIS). Whether you’re delving into urban planning, monitoring environmental shifts, or tracing historical land use, this tutorial opens the door to mastering spatial analysis using cutting-edge tools—all from your browser!
Why Google Colab?
Google Colab simplifies the setup process by eliminating the need for local installations and offering free access to powerful computing resources, including GPUs. This makes it an ideal platform for executing complex GIS operations without any hardware constraints. While Google Colab is an excellent platform for many reasons, there are some limitations to be aware of when using it with the ArcGIS API for Python. One significant limitation is the current version of the map widget, which does not support interactive GIS functionalities as seamlessly as other notebooks do.
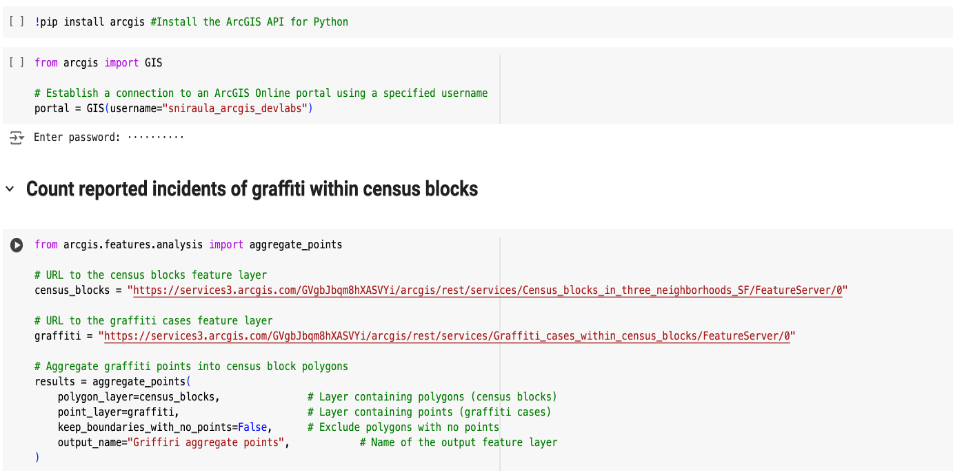
Below is a snapshot from one of my Google Colab notebooks showing a spatial analysis in action. This visual gives a glimpse into what you can achieve following our step-by-step guide.

🛠 Setting up: Install the ArcGIS API for Python in Google Colab
The journey began with setting up my tools in the cloud. Installing the ArcGIS API for Python in a Google Colab notebook was my first step into the GIS world. This process, surprisingly straightforward, involved just a few lines of code. It’s easier than you think, and you’ll be ready to access a world of geographic data in no time!
📹 Watch & Learn: Check out our step-by-step video to get set up in minutes! Don’t forget, you can always refer to the official setup guide here.
🌐 Discovering data: Access the Living Atlas with Google Colab
As part of my learning curve, I was introduced to the ArcGIS Living Atlas of the World—an extensive collection of geographic information. It was like stepping into a vast library, where instead of books, there were datasets covering everything from weather patterns to economic indicators. I’ll show you how to tap into this resource, using the example of real-time earthquake data, to demonstrate the practical applications of GIS.
📹 Watch & Learn Follow along as we explore the Living Atlas. The full documentation on how you can access the content is in the ArcGIS for Python guide. And here is a video to show how you can access it from google colab.
🔍 Deep dive: Performing spatial feature analysis
Now, let’s craft our masterpiece—performing spatial analyses using the robust tools provided by ArcGIS Web Services. Using the ArcGIS Web Services within Colab, we’ll tackle a spatial feature analysis task. This practical exercise will show you how to apply these tools to real-world scenarios, enhancing your projects with spatial intelligence.
🎥 Watch & Learn: Experience our analysis in action and follow along with our video tutorial. You can find comprehensive list of tutorial in Spatial Analysis Tutorials. We’ve integrated this Summarize data analysis into a Colab demo.
Conclusion
You’ve just scratched the surface of what’s possible with the ArcGIS API for Python and Google Colab. Ready to go further? Dive into the comprehensive sessions from DevSummit 2024, accessible at ArcGIS API for Python playlist from the Esri DevSummit 2024. For hands-on learning, don’t miss the feature analysis tutorials.
🎤 Your Turn! We love hearing from you. Drop us a comment under the videos or shout out on social media. Your feedback sparks our next big ideas!

Article Discussion: