Everyone must travel. At some point, moving from point A to point B can’t be helped. Today, all that movement can be recorded as data. Everything from the watch on your wrist to the car you drive can track your location at regular intervals and store it locally or in the cloud. Often this data is simple and lightweight, but it can be high volume, making analysis using traditional GIS techniques challenging. When talking about this highly accurate, point-in-time collection of data, we are referring to what is termed as movement data.
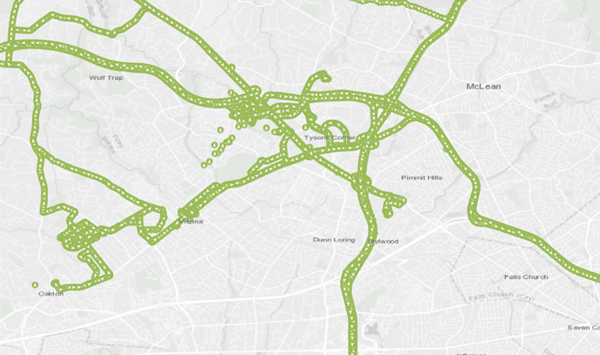
Movement data defined
Movement data is defined as anything that consists of simple point features, with a date-time field and some sort of unique identifier for the point assigning it to a track or device. Often movement data can be organized into point tracks, which are collections of movement data from the same device. When thinking of movement data, think of data that you would see coming from a GPS. This data can come in a variety of source formats, from comma-separated value (CSV) files, GPS Exchange Format (GPX), shapefiles, Keyhole Markup Language (KML) files, or a myriad of Internet of Things data endpoints. Normally, these files can contain anywhere from a few thousand to millions of records per file. This data can come from cell phone apps, mobile location data, smartwatch applications, or devices such as ankle monitors for criminals and parolees.
How can we analyze this rich source of data?
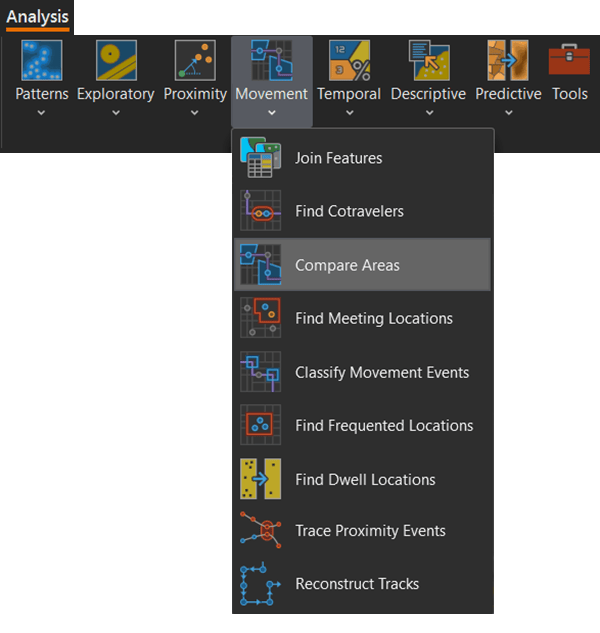
Movement tools can be found in the Tools group on the Analysis ribbon, under the Movement drop-down menu and in the AllSource Tools toolbox. These are a series of tools designed to process and analyze movement data. In Part 2 of this multipart blog, you will learn about movement data and the tools in the movement toolset. This toolset contains the following tools:
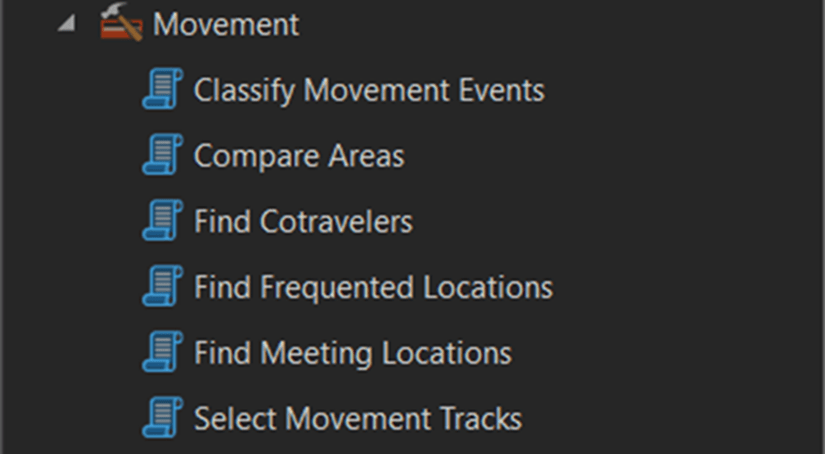
Classify Movement Events—Identifies turn events, acceleration events, and speed from an input point track dataset.
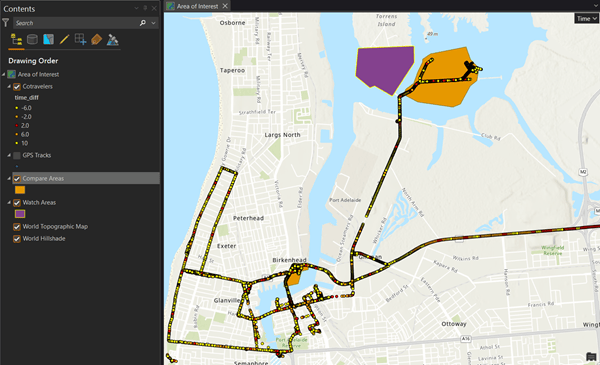
Compare Areas—Compares movement point tracks across multiple known areas of interest.
Find Cotravelers—Extracts unique identifiers that are moving through space and time at specified intervals in a point track dataset.
Find Frequented Locations—Identifies locations where a movement track has dwelled for multiple time periods and aggregates those locations based on a track identifier.
Find Meeting Locations—Identifies locations where multiple unique movement tracks have dwelled for a defined time period.
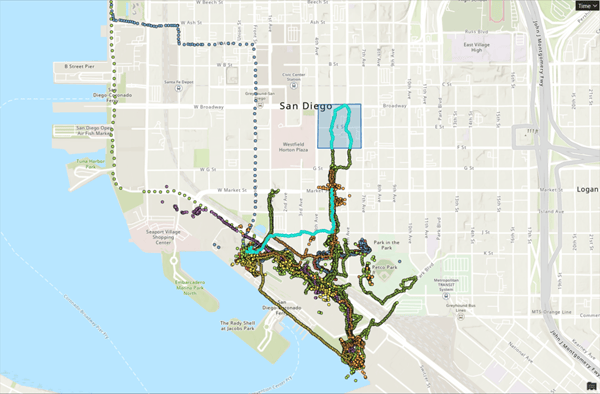
Select Movement Tracks—Selects movement tracks based on an area of interest.
Get started with the Movement toolset
When you are ready to start analyzing your movement data, a few steps need to occur prior to running the tools. First, you need to import the data. If the data is in a shapefile, you can add that to your map and set your time field. Otherwise, if the data is stored in a CSV, KML, GPX, or any other type of file, you will need to convert the file with one of the following tools:
- XY Table to Point (for importing CSV or Excel)
- GPX To Feature (GPX files)
- Cell Site Records To Feature Class
All these tools are accessible on the Data tab in ArcGIS AllSource, along with a host of other data import tools from the Defense Tools toolbox and Crime Analysis And Safety Tools toolbox.
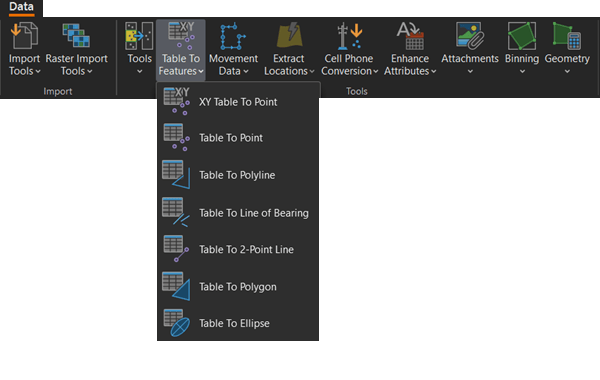
After importing your data, check the file and associated data. Ensure all the fields imported correctly and were not translated to text fields. This can occur when bringing in data from CSVs or Excel sheets when dates sometimes get stored in text fields.
Another thing to consider when validating the input data is what field to use as the unique identifier field. Movement tools operate on tracks, so you will need to identify which field in the data identifies the track. Depending on the source of data, it will be either a globally unique identifier (GUID) or track name. After validating the fields, you must time-enable your data. This was covered in Part 1 of this article. Movement tools require that your input data be time-enabled, or they will not work.
Run the Movement tools
Once your data is time-enabled, you are ready to start using the Movement tools. The quickest way to find them is to go to the Movement drop-down menu in the Tools group on the Analysis tab.
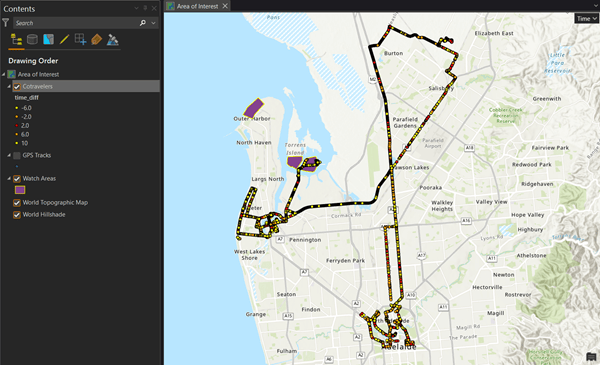
Each of the Movement tools outputs data in unique ways. For instance, the Find Cotravelers tool detects who the traveler and cotraveler are, their difference of distance and time, as well as the location of the traveling feature. The geometry for the feature represents the location of the cotraveler at the time that cotraveling was detected.
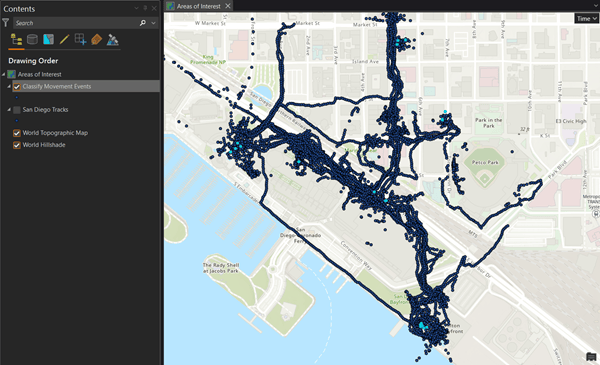
The Classify Movement Events tool creates an output feature class with details on when a point feature turned left or right, when they may have accelerated or decelerated, and when they have stopped. Combining this information with the Select By Attributes tools allows this information to be displayed on the map quickly.
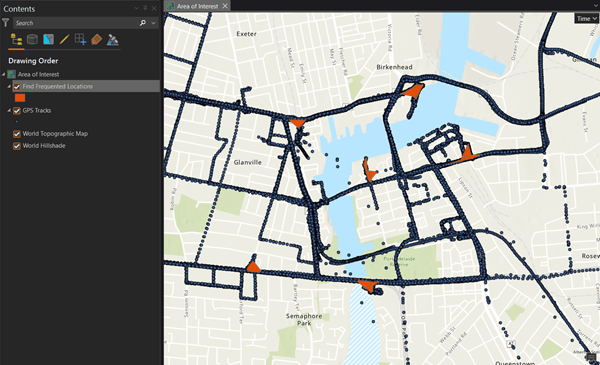
The Find Frequented Locations tool creates an output feature class that identifies where a movement track has consistently dwelled and aids in developing a pattern of life for a specific movement track. This tool differs from the Find Meeting Locations tool in that Find Meeting Locations identifies areas where multiple unique movement tracks are co-located in space and time. The Find Frequented Locations tool identifies locations where a single unique movement track is dwelling in the same location across multiple unique time intervals.
The Find Meeting Locations tool returns two separate feature classes, one representing meeting areas and one representing meeting details. The Meeting Areas feature class will detail the start and end time of the meeting, how many meetings occurred at that location, and how many unique identifiers were detected in that area. The meeting details feature class contains the information of each unique meeting pair that occurred. Included in this feature class are two meeting participants, start time, end time, and meeting duration. If there are more than two unique identifiers meeting in an area, a unique meeting pair will be created for each unique identifier that was present at the meeting.
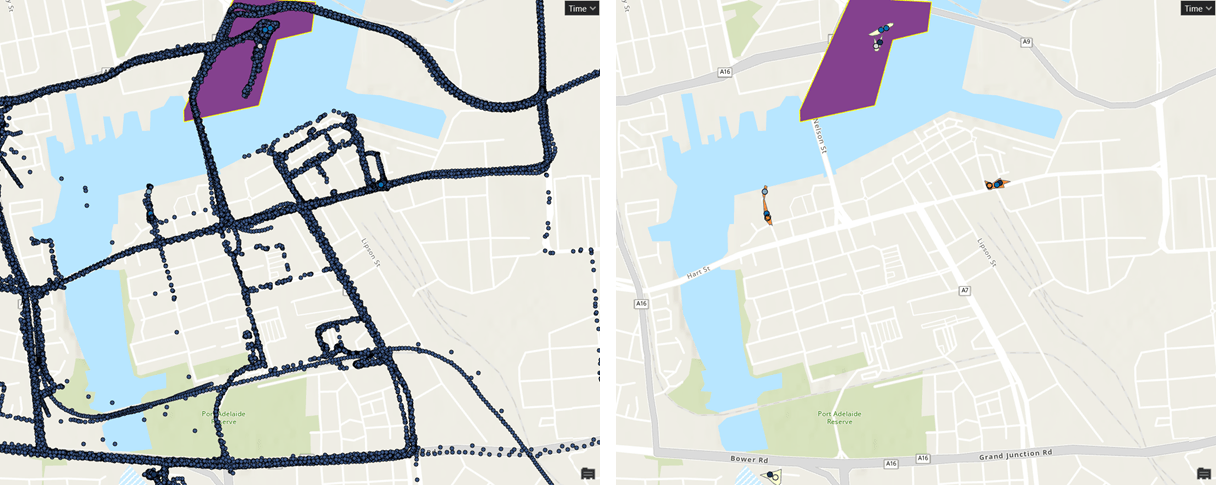
The Compare Areas tool returns a copy of the Input Area feature with a new record created for each unique identifier that was detected in the given feature.
The Select Movement Tracks tool selects tracks using the Track ID Field parameter value from input features that intersect features of the Area of Interest. Available in this tool are the Before, After, and Before and After options, which select tracks within the specified time window.
Pull together the Movement tools
Movement tools can be combined to enable even more insight from your movement data. This allows for patterns to emerge that may not have been obvious from running the tools individually. Two distinct use cases arise that combine outputs from multiple movement tools:
- Find Meeting Locationsand Compare Areas. You can use the output Meeting Details feature layer from the Find Meeting Locations geoprocessing tool to identify meetings that occur in known areas of interest. This can help narrow down meetings that may be of interest from those that are less relevant.
- Find Cotravelers and Find Meeting Locations. You can identify cotraveling features derived from the Find Cotravelers tool to identify travelers who meet.
Conclusion
In this article, we covered the Movement toolset and some of the ways that you can begin to import and explore your point track data in ArcGIS AllSource. This toolset contains tools designed to provide insight on a variety of movement analysis and help establish patterns of life, preferred paths, and help find new locations to investigate.
Related resources
Read Part 1 of this multipart blog
To learn more about movement analysis see our help documentation
Visit the ArcGIS AllSource webpage
Banner photo by WrongTog on Unsplash


Article Discussion: