Deep learning works exceedingly well with satellite and aerial imagery, but did you know that it can let you look underwater as well? At the UC 2020 plenary, Shannon Kalisky showed a demo of detecting shipwrecks from bathymetric data. This blog post shows how this was done using the deep learning tools in ArcGIS.
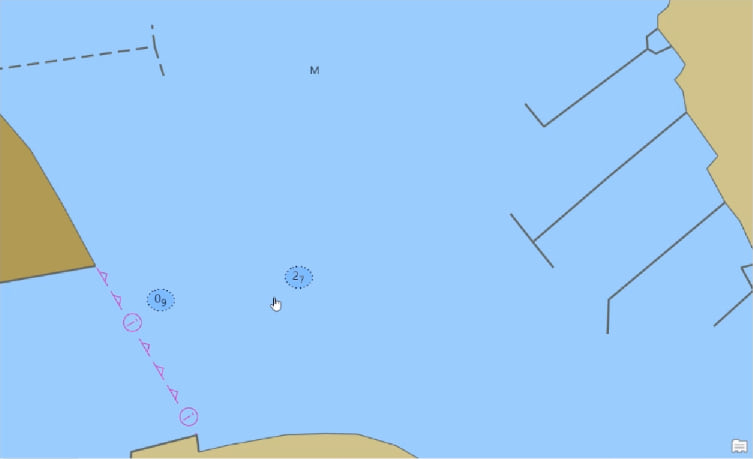
Looking at NOAA’s electronic navigational S-57 charts in the area of Jamaica Bay in NY, we see that there are 2 shipwrecks identified. Wreckage like this can lead to navigational hazards:
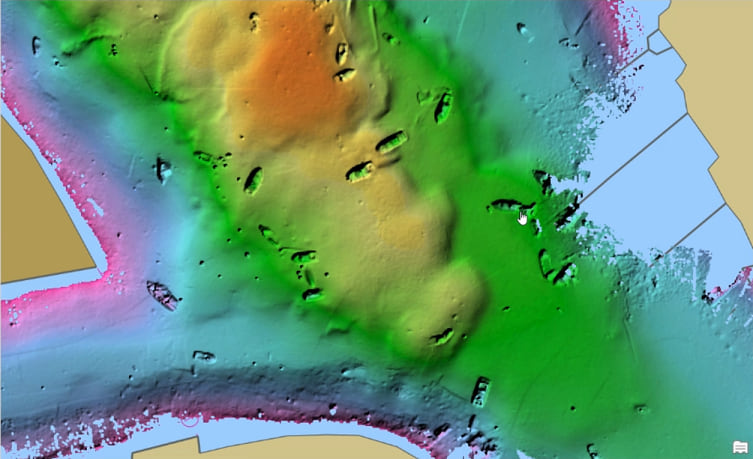
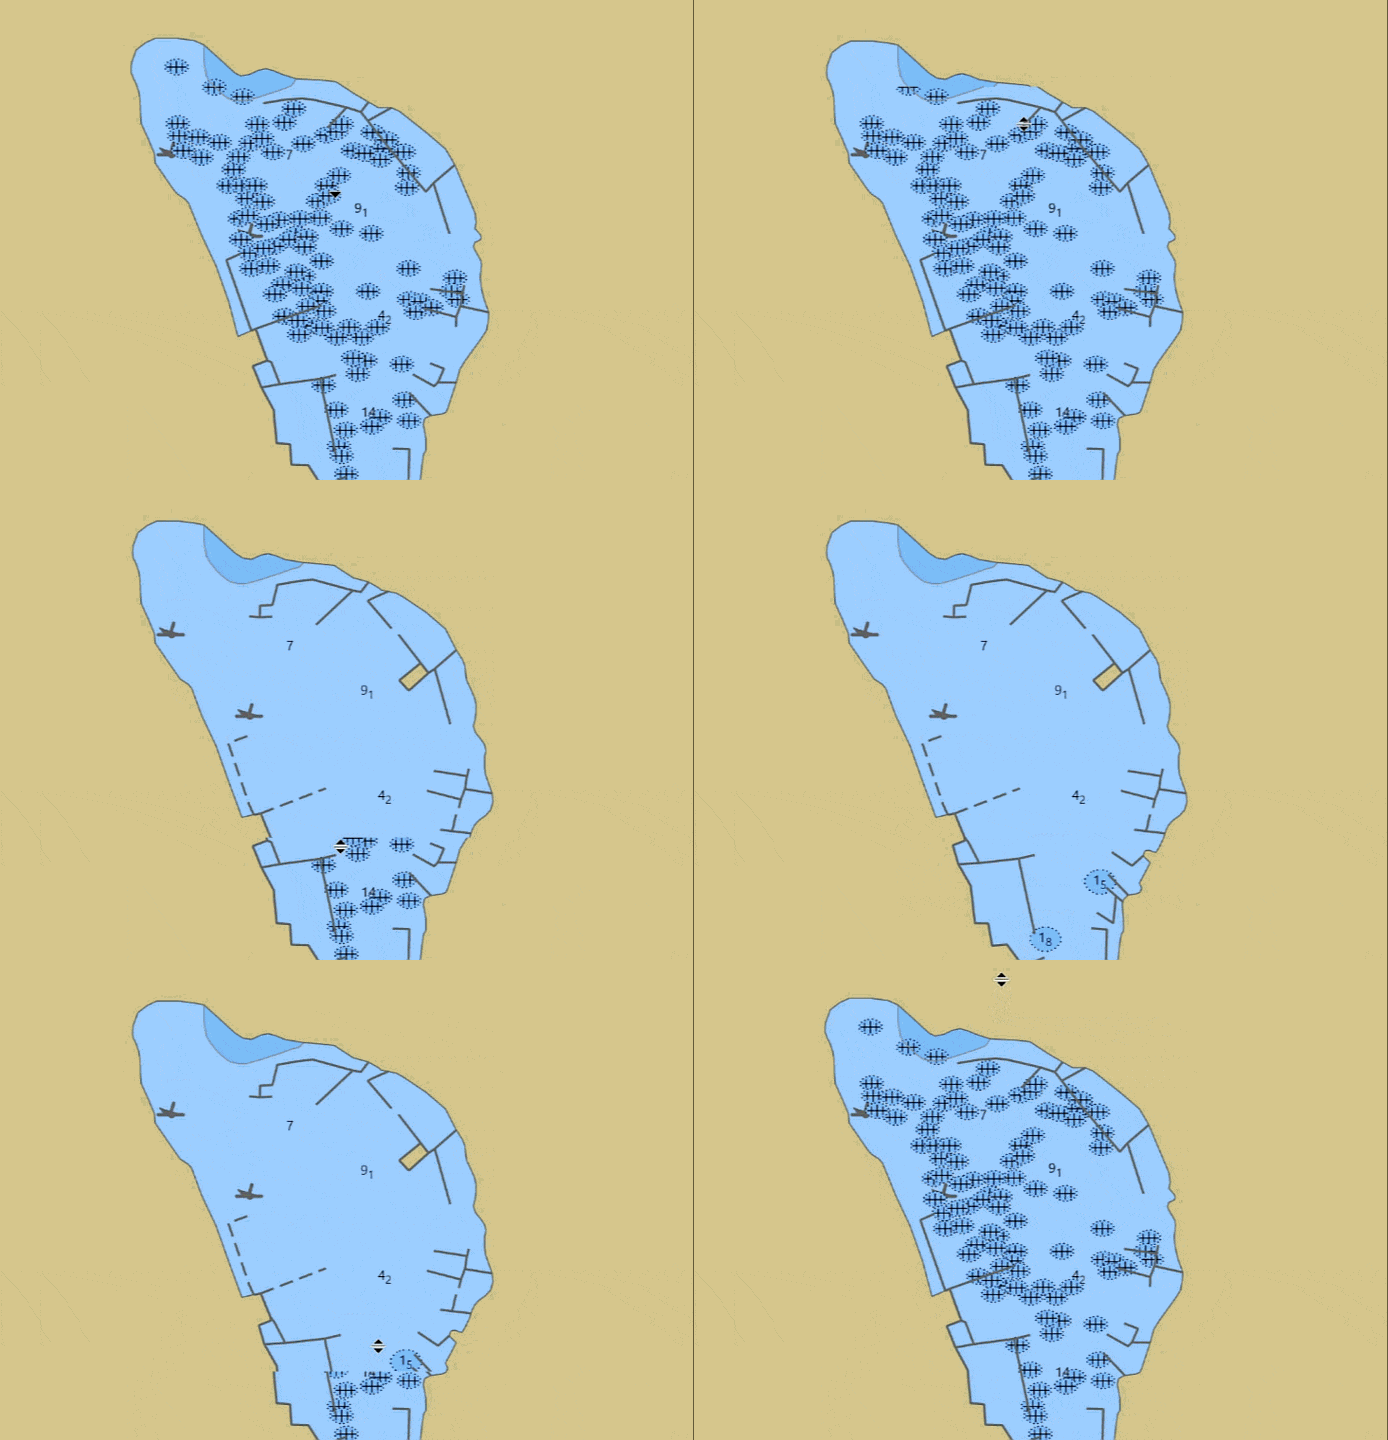
Unfortunately, this area was among the many across the eastern seaboard, that was devastated by Hurricane Sandy in 2012. Survey data post hurricane Sandy from NOAA shows a number of shipwrecks that are not updated in the S-57 chart above:
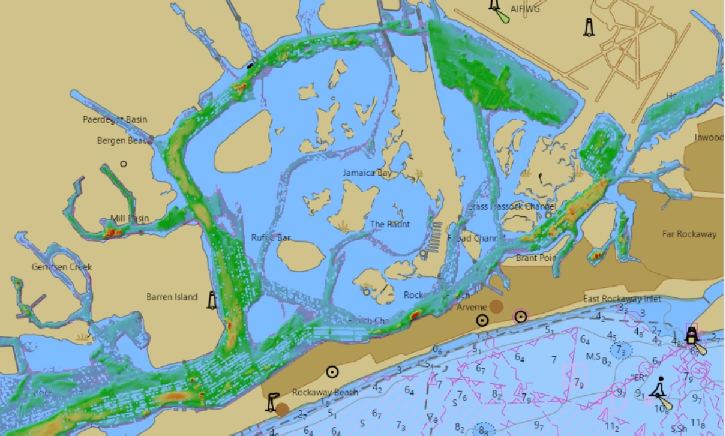
We needed to update the electronic navigational chart for Jamaica Bay, NY – an area spanning over 100 sq. km. Doing this manually would have been a daunting task.
Here’s where deep learning came to our resue. We used deep learning based Object Detection models to automate the task of detecting shipwrecks. Here’s the process that we followed:
1. Preprocess bathymetric data
The input data that we used was in Bathymetric Attributed Grid (BAG) format. BAG data is two-band imagery where one of the bands is elevation and the other is uncertainty in the elevation values. We applied the shaded relief function in ArcGIS, which is also used by NOAA in one of their BAG visualizations here. Shaded Relief is a 3D representation of the terrain which differentiates shipwrecks from the background and reveals them in an easily interpretable manner as compared to the raw bathymetric data.
2. Capture training samples
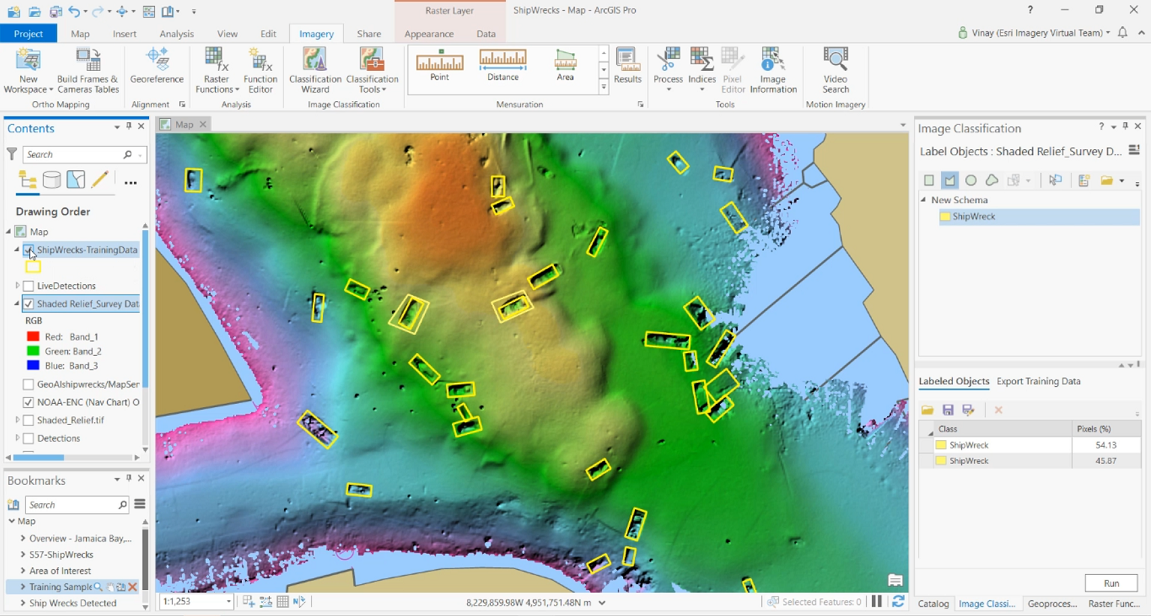
All supervised deep learning tasks depend on labeled datasets, which means humans must apply their intelligence to train the neural network on what it is trying to identify. The labeled objects are used by the neural network to learn what it is expected to detect. While you can use regular editing tools for the task, ArcGIS Pro now includes a labelling tool specifically designed for deep learning workflows.
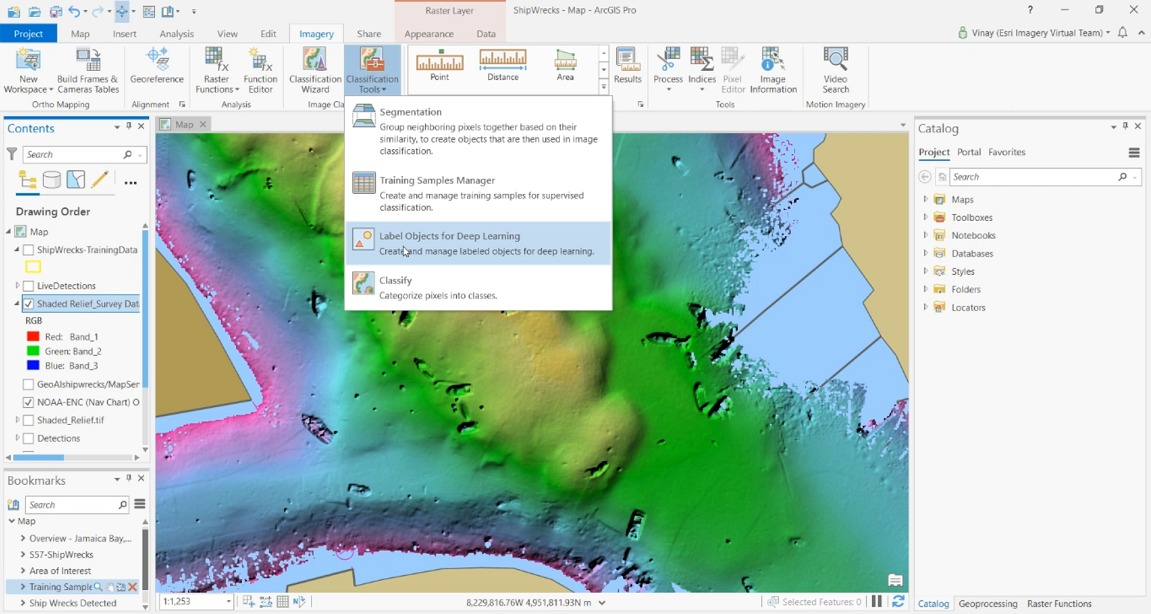
With the Label Objects for Deep Learning tool, we can dive right in and start capturing training samples:
3. Export training samples
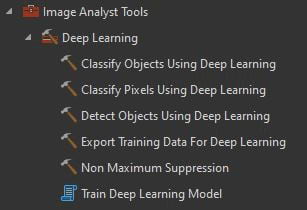
The deep learning toolset within the Image Analyst toolbox in ArcGIS Pro gives you access to all deep learning tools. This toolset contains tools for the complete deep learning workflow – from exporting training data, to training deep learning models and finally for using trained models to detect specific features in an image or to classify pixels in a raster dataset.
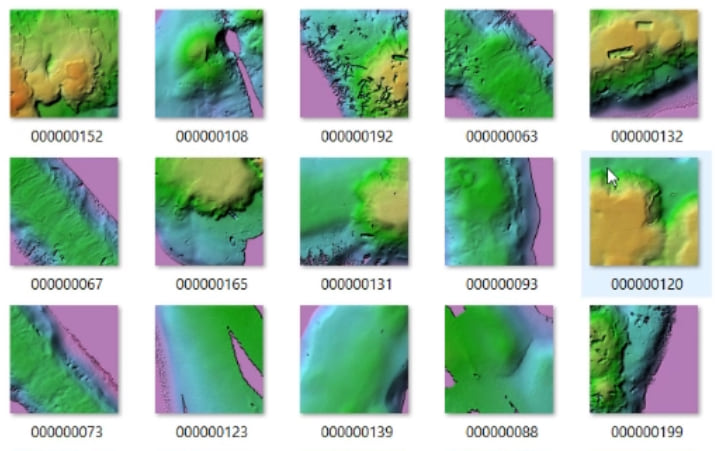
The Export Training Data for Deep Learning tool created the image chips which were used to train the deep learning model.
The output of this tool was a bunch of training chips and metadata:
4. Train the deep learning model
We can train the shipwreck detection model using the Train Deep Learning Model tool in ArcGIS Pro or using the arcgis.learn module in ArcGIS API for Python. A sample notebook which showcases the workflow using arcgis.learn is here.
The Train Deep Learning Model tool greatly simplifies the process for GIS analysts. All you need to do is point at the folder of the training data that was exported in the previous step and give the location where the trained model will be saved.
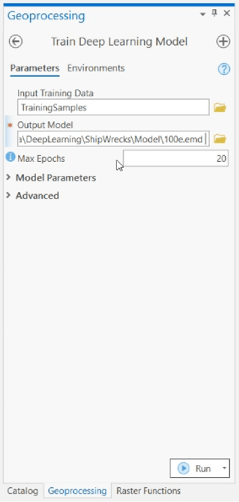
The tool is very easy to use, and has intelligent defaults, while also allowing you the flexibility to customize the training process using advanced settings.
The Max Epochs parameter defines the number of times the dataset will go through the neural network – essentially the number of cycles or training passes over the training samples. This is really dependent on the model you’re training, distribution of features, complexity of the scene and the amount of training samples that you have. If you have a lot of training samples, you can keep this number low. We generally keep training the model over several epochs repeatedly, till the validation loss (or the error rate) keeps reducing. However, there is an option where the model training will stop when the model is no longer improving, regardless of the Max Epochs parameter value specified.
The output is a trained model in the form of a Deep Learning package, containing an Esri Model Definition (EMD file), that can then be used for detecting shipwrecks across the entire area of interest.
5. Use the model
We used the Detect Objects Using Deep Learning tool to detect shipwrecks across our area of interest. We specified the input raster and the location to the trained model (EMD file) and the detected shipwrecks were created in the Output Detected Objects feature class:
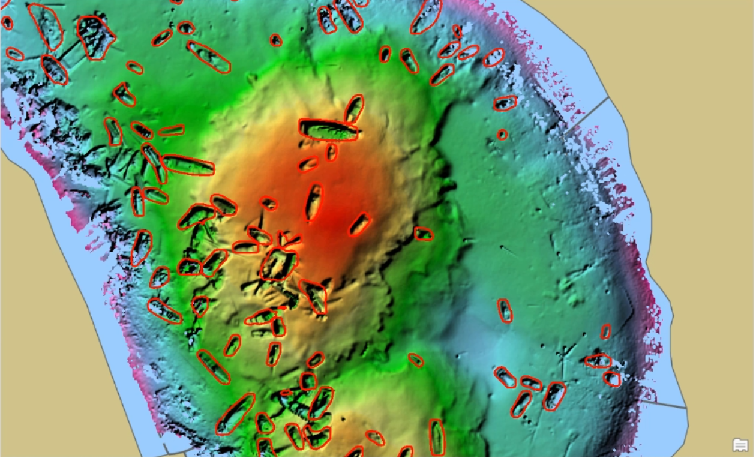
Finally, we used the results to update the S57 navigational chart, where you can also compare the results with the previous chart:
See these resources for information on deep learning using ArcGIS:
- Deep learning in ArcGIS Pro
- Geospatial deep learning with arcgis.learn
- Deep learning models in arcgis.learn
Special thanks to Guneet Mutreja and Sandeep Kumar for their contributions.


Finding a shipwreck in a survey does NOT automatically mean that the wreck has to be charted. Several questions has to be answered first, like is the wreck an hazard for shipping, is the wreck an archeological finding, what stakeholders are involved etc. Charting wrecks is a complicated proces which has several steps involved.
Our intention has always been to locate the shoalest point within each finding and then write that to the VALSOU attribute of the S-57 WRECK object. If the VALSOU is shoaler than a specific value, we can filter it. We will deliver the “2nd half” of this workflow as a python script on ArcGIS Online via our Esri Hydrographic Office site (the first half of the workflow being the simple detection of these objects – which is available on GitHub). Ultimately, it will be a long slow walk to full automation, which will come with several milestones, each one intended… Read more »
The surfaces shown in the examples above appear to be from an Ocean Surveys, Inc. dataset acquired during a 2013, NOAA-contracted, post-Hurricane Sandy charting survey. We at OSI have never seen so many wrecks! In processing the survey over 1,400 wrecks (and non-wreck obstructions) were identified within the study area. All wrecks were identified as such. However, as Janneke has suggested below, not all wrecks warrant charting.
In July 2020 OSI kicked off a NOAA-contracted “complete coverage” multibeam survey in western Long Island Sound/East River, NY. We are looking forward to seeing how many wrecks are revealed. https://www.linkedin.com/company/ocean-surveys-inc-/
We definitely chose this survey on purpose. It provided so many great samples – which is what you need when you’re training a ML algorithm. It is truly an unusual survey in that regard…but was quite helpful to us in this exercise.
Reach out to maritime@esri.com if you have any questions or want to chat about this further.