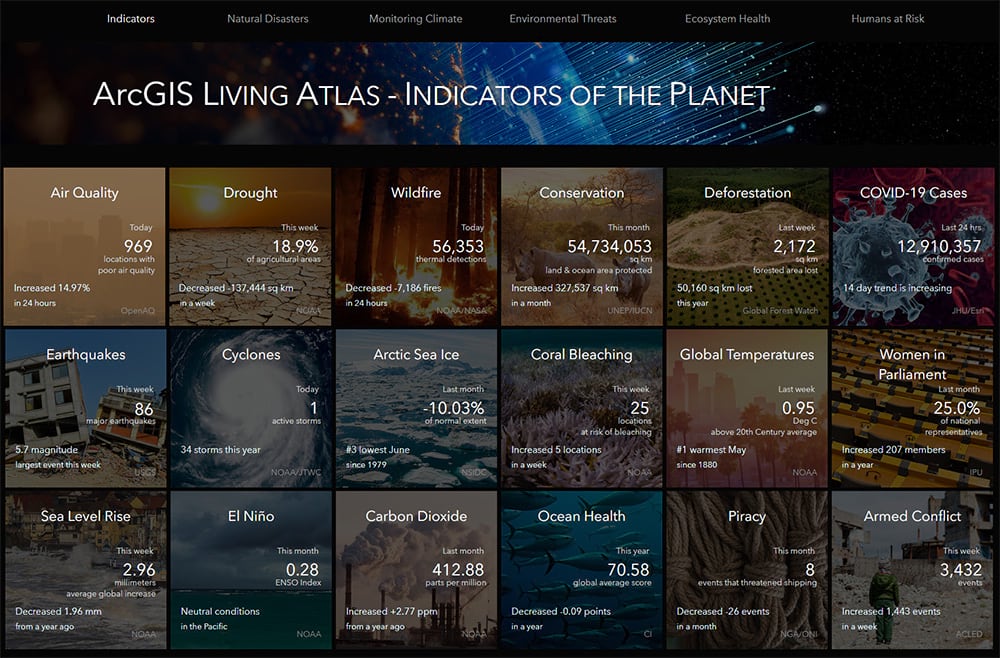
As of May 2023, the Living Atlas Indicators of the Planet (beta) site has been retired. Several of the data feeds were discontinued from their authoritative sources. We thank you for your interest and support. You can find all of the active layers and maps in ArcGIS Living Atlas of the World.
It was just announced that June was the 3rd hottest on record, Johns Hopkins put the number of COVID-19 cases at 13-million, and over 300,000 sq km of protected areas were created last month. These are all indicators of the planet’s vitality, but traditionally you’d need to bookmark three different websites to keep track of these and other metrics.
Not anymore.

In partnership with Microsoft, National Geographic, and the United Nations Sustainable Development Solutions Network, Esri is gathering these and other topics into the ArcGIS Living Atlas Indicators of the Planet (Beta). Leveraging the near real-time information already contributed to Living Atlas by organizations such as NOAA, UN Environment Programme, and US Geological Survey, ArcGIS Living Atlas Indicators of the Planet draws upon authoritative sources for the latest updates on 18 topics, with more being developed. In addition to the summary statistics provided by the GeoCards, there are a series of maps and resources to better understand each issue and learn how to integrate timely data into decision making, along with stories on progress towards building a sustainable planet.
ArcGIS Living Atlas Indicators of the Planet was developed using ArcGIS Experience Builder and is in its Beta release while additional capabilities are being implemented. This Experience Builder template can be customized for your own topics of interest. All of the underlying layers, maps, and apps are available from this Content Group.
Interested in learning more about how to configure an application for your own indicators? Fill out this Survey 123 form to stay in touch.

Article Discussion: