COVID-19 is amplifying health, racial, and economic inequality to create disparities in outcomes in the US. Both illness and death rates are higher in communities of color. Health data shows the impact of the pervasive effects of racism in the United States. Health data is showing that…
- Disproportionately Black U.S. communities carry the burden of more than half of both the country’s COVID-19 cases and deaths.
- African Americans in New York City are dying at twice the rate of whites.
- The death rate for Hispanic and Latino people falls in between, fifty percent higher than that of whites.
- As of May 3rd, approximately 19% of the COVID-19 deaths in Arizona were among the Native American population even though they represent approximately 5.3% of the state’s population
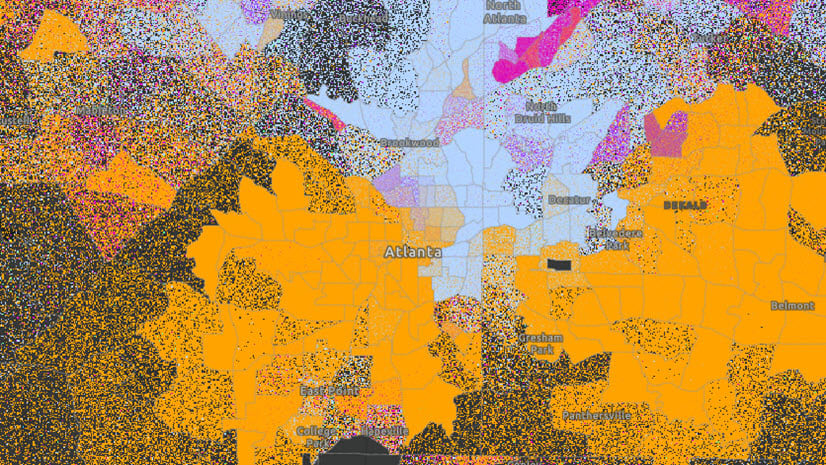
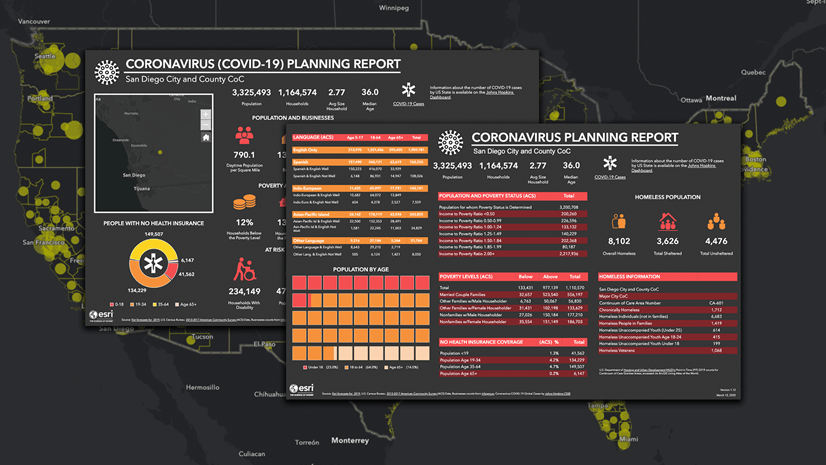
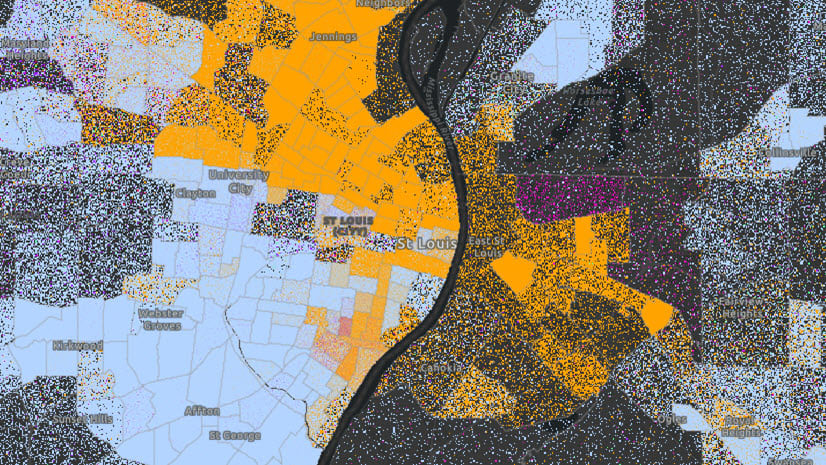
In response, communities and companies are analyzing risks and designing equitable solutions. However, that challenging work begins with data. The new COVID-19 Health, Racial, and Economic Equity data gallery helps you start understanding and addressing inequity in your community. The data is now available on the Esri COVID-19 GIS Hub. This gallery contains a collection of Esri maps, data, and apps that can help guide decisions around health, racial, and economic equity during COVID-19 and beyond. This means that it includes layers related to the social determinants of health. More specifically, these include: economic stability, neighborhood and physical environment, education, food, community and social context, and health care system. These layers can be used to analyze racial inequity during COVID-19 (for guidance, see ArcGIS Blog Analyze Racial Inequity During COVID-19).
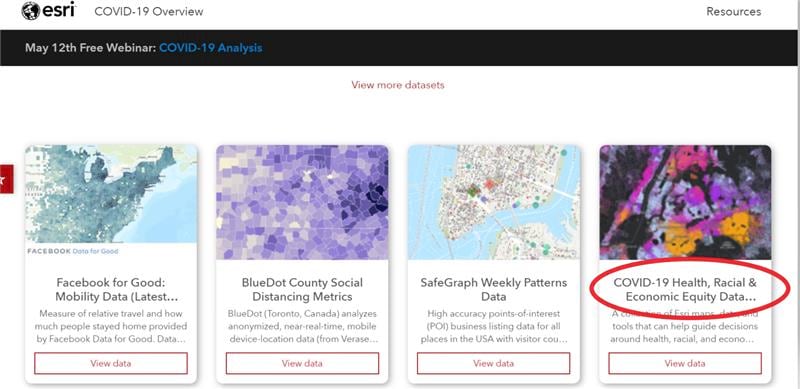
What Data Can I Find in the COVID-19 Health, Racial, and Economic Equity Collection?
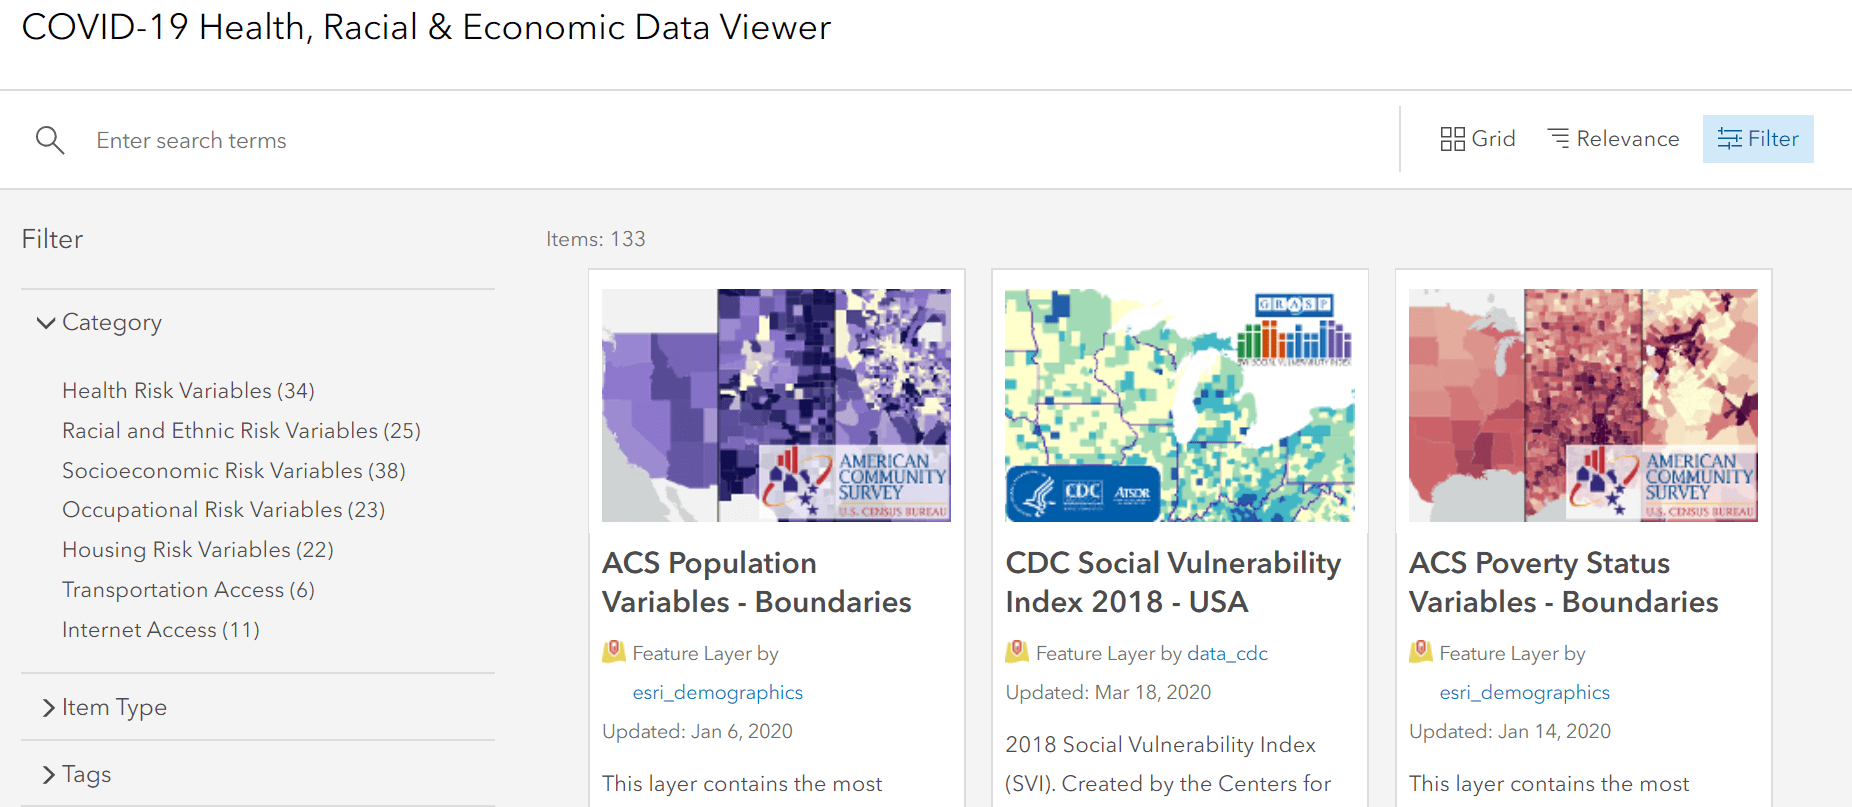
The gallery currently includes geographic data on the following: race, ethnicity, age, gender, immigration, language, child well-being, senior well-being, disability status, health insurance, income, disposable income, home ownership, housing costs, air quality, homelessness, diversity, food access, savings vulnerability, education, internet access, family living arrangements, population, poverty, transportation, unemployment, social vulnerability, occupations, business & economic vulnerability, life expectancy, low birth weight, COVID-19 providers, social distancing, and more. These ready-to-use layers, maps, and apps are available in ArcGIS Living Atlas of the World and can be used across the entire ArcGIS platform.
This collection is constantly growing as new data layers, maps, and other items become available. You can use the filter on the left of the application (shown in the screenshot below) to find data on specific topics.
We Want to Hear From You
How is your organization responding equitably? Please share your success, tips, and challenges by commenting here. You can also share your experience and questions using the GIS for Equity and Social Justice GeoNet Forum.


Article Discussion: