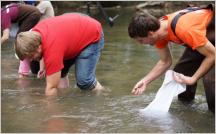
 Scientists can’t sample every cubic meter of water by themselves, so they have to make predictions about the water they don’t touch.
That prediction process, known as “interpolation,” involves taking data samples at two specific locations and and predicting the value for every location between those two points.
You will do just that in Model Water Quality Using Interpolation, a new Learn ArcGIS lesson which will guide you through the process of predicting water quality throughout Chesapeake Bay. This ArcGIS Pro lesson features the Geostatistical Wizard, which will walk you though interpolation.
In this 80-minute lesson, you will use geospatial tools to map the path of “dead zones,” aquatic areas where dying and decomposing algae smother fish and plant life. Finally, you will create a poster allowing you to share your findings with your colleagues.

Article Discussion: