Web AppBuilder for ArcGIS has several minor, but important updates in the ArcGIS Online Sept 2017 release. The usability of several widgets have been greatly enhanced.
Infographic widget: We’ve listened to the feedback and have improved this widget in several ways. First, the colors of features in the map display can now be matched to their associated values in charts! There is a new “use layer’s symbology” option when configuring the chart display settings. This makes associating data between the map features and in the widget much easier.
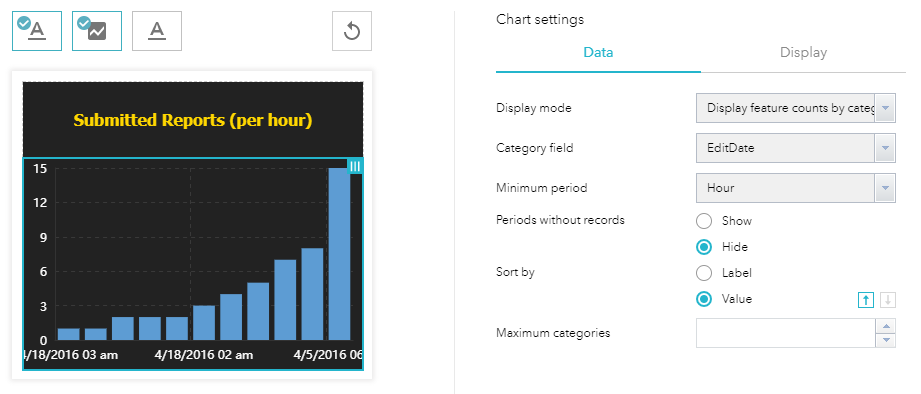
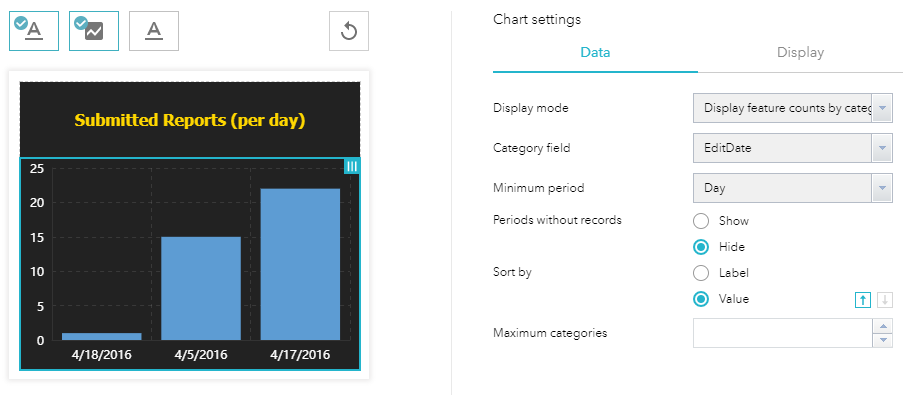
 Second, for date fields, you can now parse the date values and select the desired time unit to display in the chart. Note that by default (e.g., the automatic option), the widget will examine the values in the date field and selects an appropriate time unit to display.
 For example, display date values per day:
Or display date values per hour (if information is available):
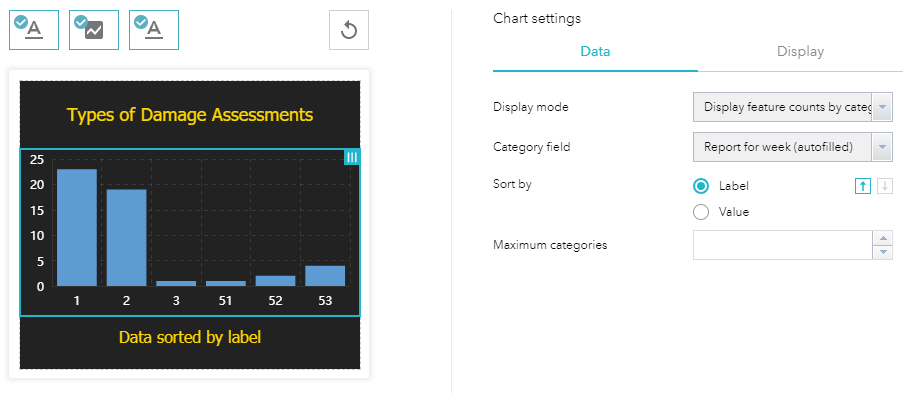
 Lastly, you can also sort chart data along the x-axis based on 2 options: i) by Label and ii) by Value. When sort by Label is selected, the data is displayed based on the order of the data labels. For example, the damage assessments are listed from left to right in ascending order 1 to 53.
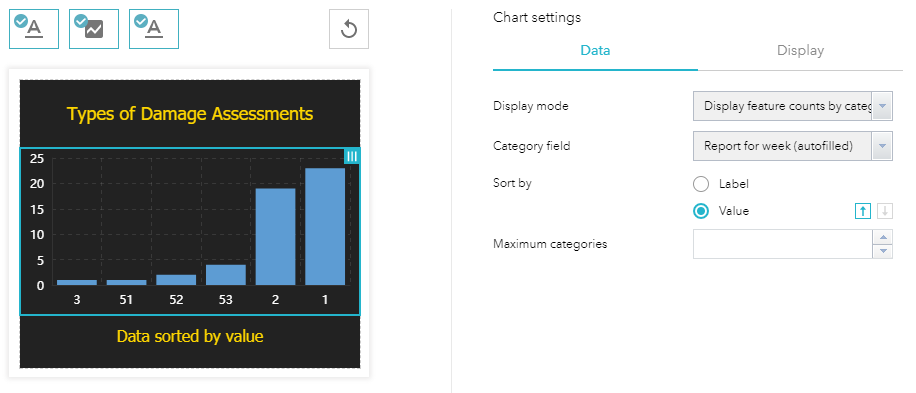
 When sort by Value is selected, the data is displayed in ascending order based on the total values for each category type. For example, type 3 damage assessments have the fewest, while type 1 damage assessments have the most.
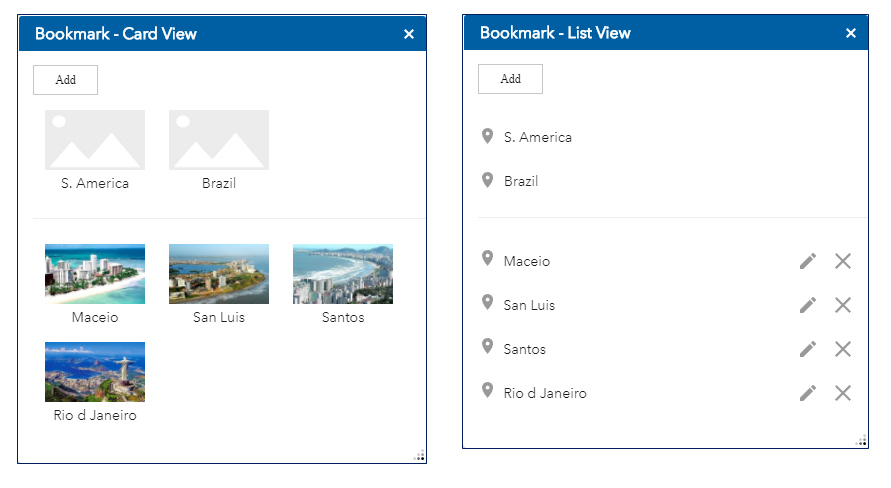
 Bookmark widget: Many new configuration options have been added to this widget. These include: displaying bookmarks as a collection of cards or as a list; displaying bookmarks from the web map; controlling whether end users can create bookmarks with custom thumbnails; and support for custom bookmarks (defined when configuring the widget). It is also possible to reorder the custom bookmarks.
 Note that bookmarks from the web map are located at the top of the Bookmark widget and cannot be modified, while end user created bookmarks appear in the bottom section of the widget (below the line) and can be edited.
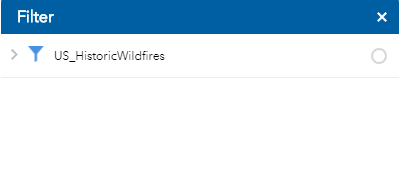
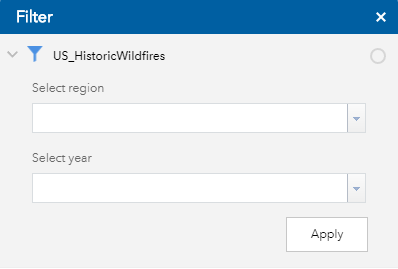
 Filter widget: This widget now includes an option to collapse filters in the display when the widget dialog window initially opens. This can help improve the user experience for the widget, especially if it contains many filters. For example, this filter widget contains 2 expressions. When it first opens, the dialog window appears like this by default:
When the new option: “Collapse the filter expressions (if any) when the widget is opened”, is selected, it will now appear like this:
 Smart Editor widget: 3 new features were added to improve the user experience for working with this widget. First, under the General Settings section of the configuration dialog, there are 2 new options:
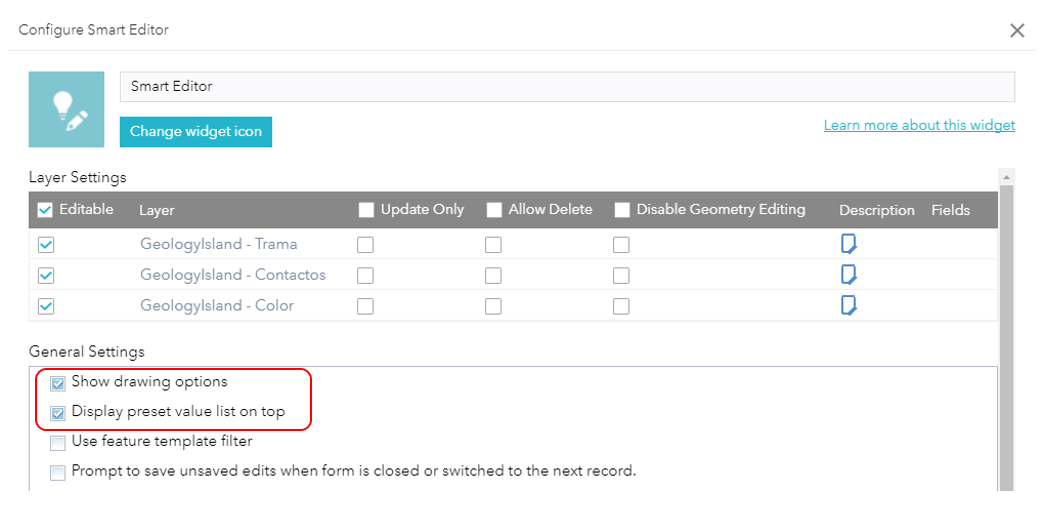 Show drawing options displays additional editing options when a feature type is selected from feature template list. Under the feature template list, a new dropdown list shows the possible drawing options available.
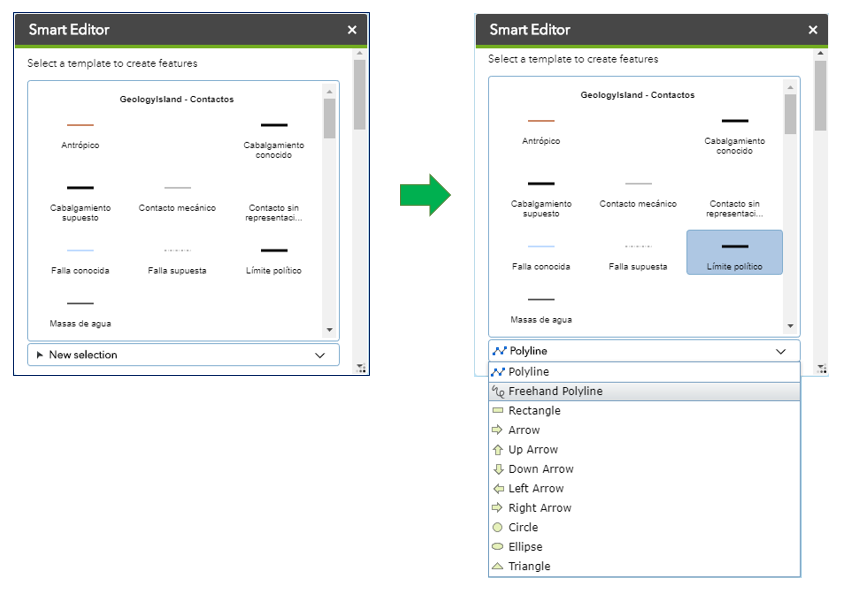 After a new feature is added, the Smart Editor widget dialog then displays a list of its attribute fields and then you can enter their values. With the Display preset value list on top option, you can make the list of attribute fields appear at the top of the Smart Editor widget dialog, even before you select a feature type from the feature template list. So when you initially open the Smart Editor widget dialog it will now appear like this:
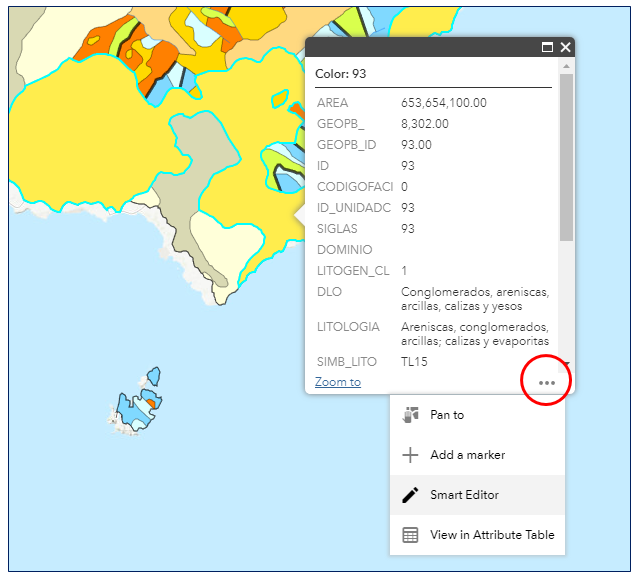
And lastly, to better support feature editing workflows, you can select a feature to view its pop-up, and access the Smart Editor widget directly from the pop-up’s ellipsis button in the lower right corner.
 We hope you enjoy these enhancements.
Sincerely,
The Web AppBuilder for ArcGIS Dev team.

Article Discussion: