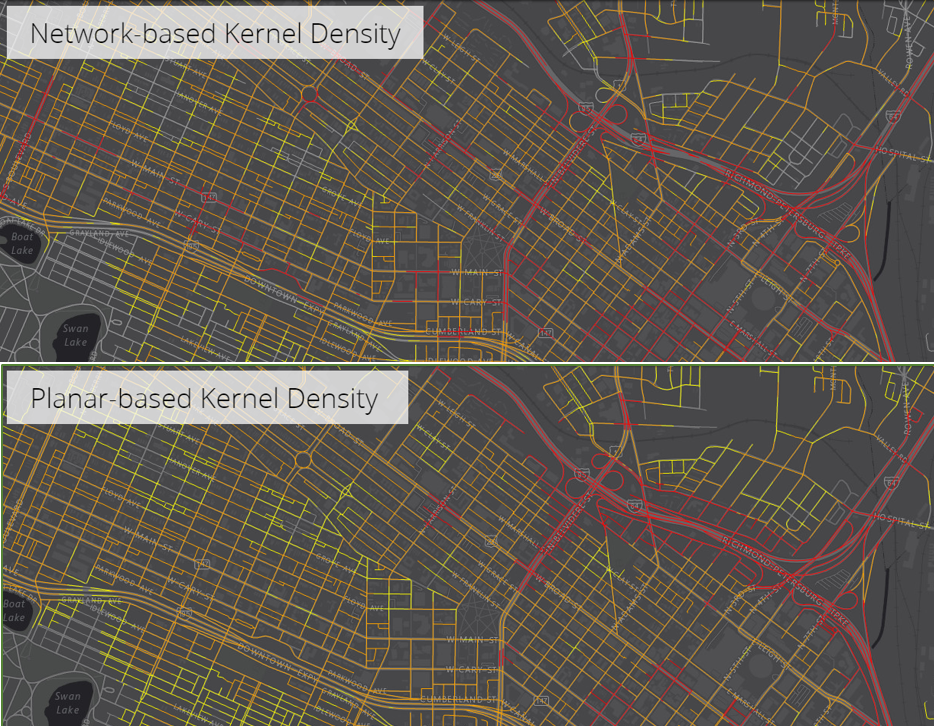
Check out this Story Map on a spatial data exploratory analysis of vehicle crashes in Richmond City, Virginia that identifies hazardous road segments (hotspots) using both Network Kernel Density Estimation (KDE) and Planar KDE methods for eight different bandwidths.
The analysis includes a data description showing the spatial and temporal distributions of two types of crashes analyzed in this study: speed-related crashes and alcohol-related crashes, and compares the performance of both the methods for finding hotspots of vehicle crashes. Finally, the workflow answers the question: how similar are the results from the planar spatial analysis method to those from the network spatial analysis method?
This comparison can help you choose the density method you want to use for your analysis to improve road safety planning measures.
This analysis and Story Map was created by Ehsanali Keshteh Gar during his summer internship with the Spatial Analyst Team in summer 2017. Ehsanali is currently pursuing his PhD in Geospatial Engineering and MS in Transportation Engineering at Virginia Tech. His research interest is using Network Spatial Analysis to solve transportation problems. For additional questions, you can comment here or contact him at ekeshte@vt.edu.

Hi Mark. Will this awesome new feature be made available in scenes or usable in scenes as well in the future?
Hi Max – The folks working on Scenes have been thinking about this, it is in their backlog, but not a priority at the moment. Maybe submit to ArcGIS Ideas with your usecase in mind – that can help shape priorities.
Hi Max,
This is Jasmine and I am the Product Manager of Scene Viewer. Could you help share your use case to jdu@esri.com? It would be great to learn a little bit more of your workflows to help us prioritize. Thanks!
Best,
Jasmine
Hi! When we work in ArcGis Urban we sometimes want to add illustrative maps and draw sketches after. Right now we have to go through arcgis pro but we dont need the accuracy. This method seems much simpler and faster.
/Tommy
Will this be available in widget form for Experience Builder?
Christopher, we are working on ways to bring this to other apps, stay tuned!
Yes love this idea!
Hi Mark! Every time I try to add a media layer, I receive this error: “This file type is not supported.” This occurs with both JPG and PNG images in MapViewer. I’ve tried both Firefox and Chrome. Any suggestions?
That’s no good! If your files are less than 10MB they should be loading. Feel free to email me the files at mharrower@esri.com and I’ll see what I can do
Does this create a separate hosted layer or is the information only available in the map that you add it to?
Hi Henry – The image is saved with the web map, not as a stand alone file. We are exploring export options for the future so you can save the media as their own file.
Will Map Viewer support GIF image and image from URL to create a media layer?
Hi Puekthiwat – We are working on both of these, but not sure of the release date. Stay tuned!
Hi Mark, I cannot manually enter the coordinates of the corner points on my image. Has that feature been removed or am I missing something?