By Tim Ormsby, Learn ArcGIS Team, and Greg Tieman, Solutions Professional Services
 In medical, police, and fire departments, each department uses its own method to track real-time emergencies throughout the city. The current method is not as efficient as it can be, and it makes resource allocation difficult to implement. With the use of GIS, you can coordinate the response efforts more effectively to better respond to emergencies or natural disasters such as earthquakes.
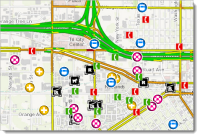
In the new Monitor Real-Time Emergencies lesson on the Learn ArcGIS website, you’ll create a real-time operation view using Operations Dashboard for ArcGIS. You’ll start off by exploring an existing operation view to get a better understanding of how a view works. Then, you’ll make your own view with the goal of monitoring the locations of police, fire, and medical vehicles throughout the city. You also want the dashboard to display the locations of nearby emergency facilities. Lastly, you’ll share the view online.
- Platform: Operations Dashboard
- Time: 1 hour 20 minutes
- Level: Beginner
Build skills in these areas:
- Creating web maps
- Creating operation views
- Adding and customizing operation view widgets
Commenting is not enabled for this article.