This is part of an ongoing blog series that highlights ways to execute Business Analyst Desktop workflows inside of Business Analyst for ArcGIS Pro. Go Pro!
Did you know that you can access your custom reports created in ArcGIS Business Analyst Desktop (ArcMap) in ArcGIS Pro? Also – if you’ve created compelling infographics for your organization, you can also view those in ArcGIS Pro. Here’s how…
Reports
Let’s say you’re a long time user of Business Analyst Desktop and part of your role is to create and share your organization’s custom reports. You’ve invested time and energy – and the last thing you want to do is rebuild them in ArcGIS Pro. Good thing is, you don’t have to. Let’s walk through the process…
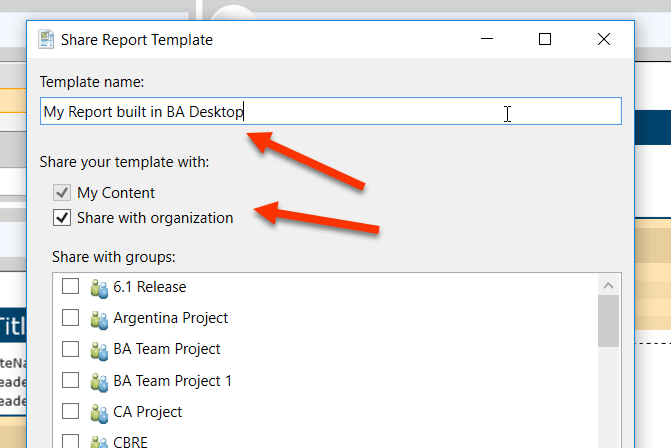
Starting in Desktop – the Business Analyst report editor has an “online mode” that allows you to save and share reports to your Portal. Here I am sharing my custom report to ArcGIS organization.
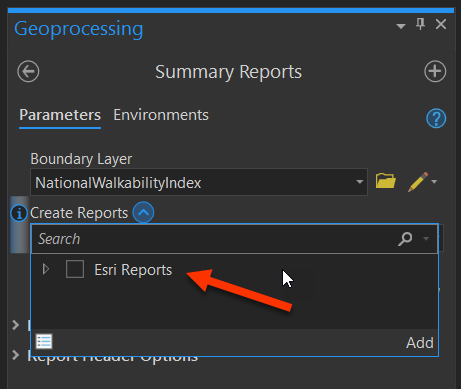
Shifting over to ArcGIS Pro – in the Business Analyst Toolbox – I open Summary Reports and I only see an Esri Reports section. This is OK! It’s because Data Source is pointing to my local machine.
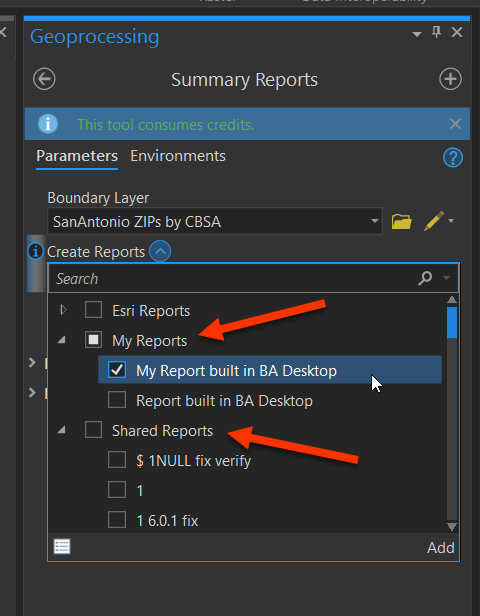
When I switch my Data Source to ArcGIS Online or my organization’s Portal – I see new options: My Reports and Shared Reports. And there’s the report I built in Desktop!
Here’s how to change your Data Source in Pro to view shared reports in your organization.
First – Sign in…
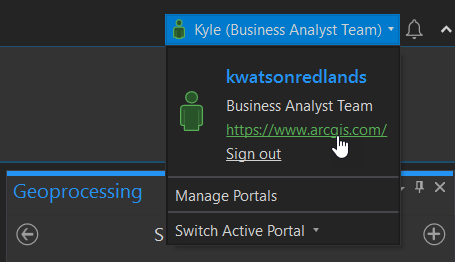
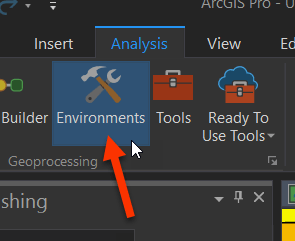
Then open Analysis > Environments…
Scroll down and switch your Business Analyst Data Source to ArcGIS Online or whatever your Portal is set to…
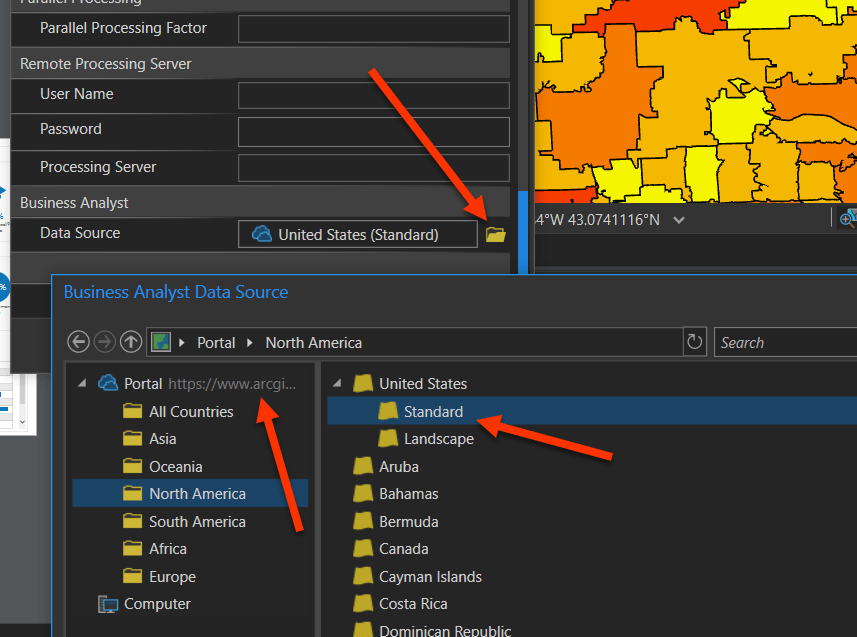
Then you’re all set. Your shared reports will appear in the Summary Reports tool.
Infographics
You can also view your custom, shared infographics in Pro. These aren’t built in Desktop – you’ll want to use the Business Analyst Web App to create and share them.
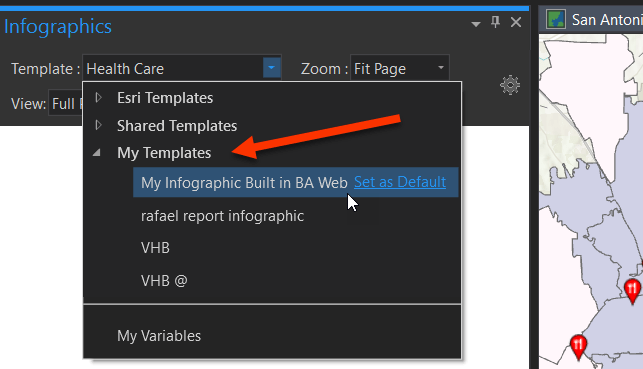
Again – make sure you are signed. Then in the Infographics pane – open the Template list. Your custom infographics will be under My Templates and Share Templates.
In future releases we may re-envision the authoring environment for reports and infographics in ArcGIS Business Analyst Pro. Currently we have a rich experience in the Business Analyst Web App. The best path forward is create them there and share them – you can then view your work in ArcGIS Pro following the steps above.
Update: this blog article talks about functionality now available in ArcGIS Business Analyst Pro that allows importing infographic templates authored in Business Analyst Web App.
Happy Sharing!
Kyle + The Business Analyst Team
Commenting is not enabled for this article.