Smart Map Search is one of the most powerful and flexible ways to use Business Analyst to zero in on areas of opportunity, suitability, demand and need. Users can quickly and easily identify and rank the best locations. For example, retailers can find the best site for their next store, city governments can efficiently identify vulnerable populations, and marketing professionals can determine where to target campaigns.
Smart Map Search identifies the areas which meet your criteria and highlights the variables which fall outside those conditions. It streamlines the decision-making process by allowing you to analyze, compare and understand the influence of different criteria as part of your search for an ideal site. a Smart Map Search dynamically highlights the areas which match your criteria, even as they change, so you can continually refine and fine tune your search for the perfect place.
Find the Best Places and Demand
The most common use of Smart Map Search is to identify a target demographic. This might be a real estate developer looking to build multifamily homes, a local government focusing on wellness, a retailer looking to open a new store or a manufacturer seeking to expand its product penetration in a market.
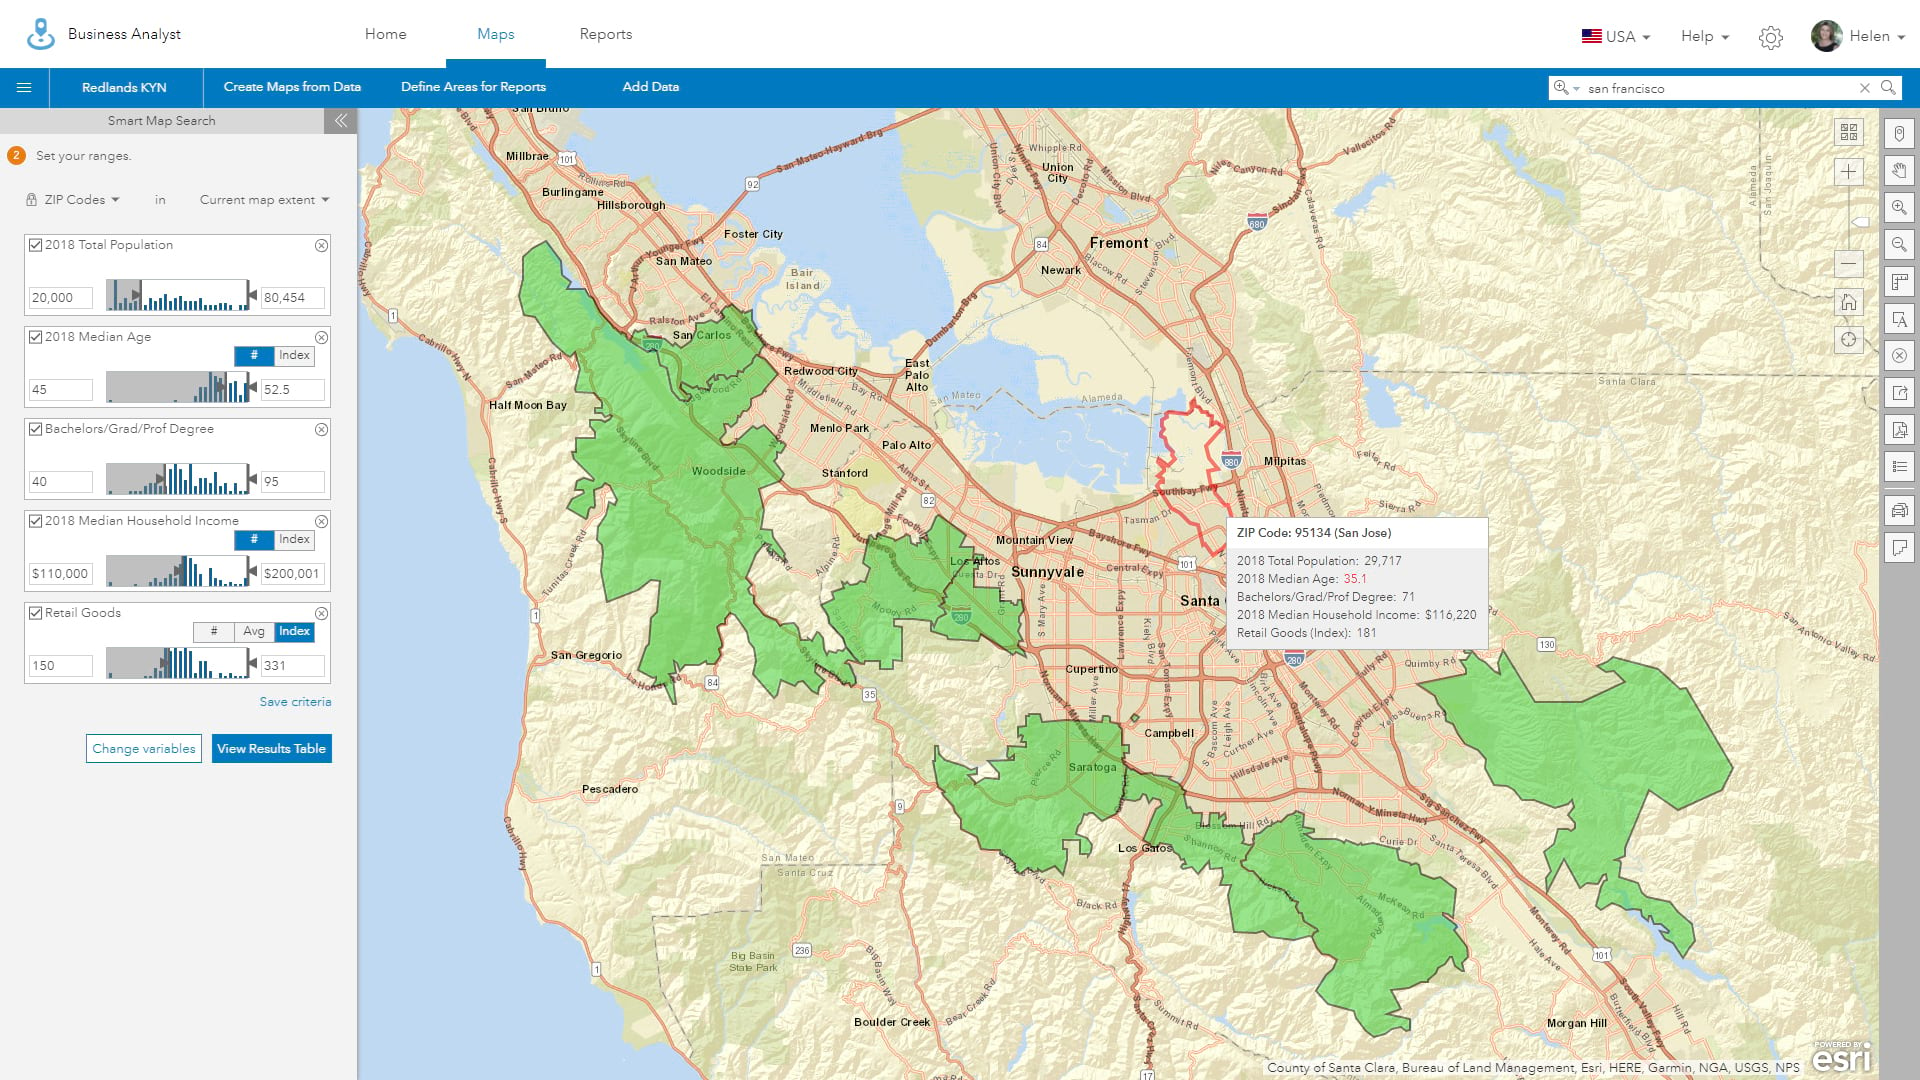
Each of these scenarios is based on the conceptualization of the characteristics of an ideal customer which are then used to include or exclude areas based on how well they match the criteria. As an example, I am going to use a retail example, buying smart home devices such as Google Home, Alexa etc. These are often targeted at a middle class, middle aged, educated demographic. To target this group the company might use the following criteria:
- Population over 20,000 people
- Median age of 45–60 years
- 40 percent of the population have a bachelor’s degree or higher
- Median household income of over $110,000
- Retail expenditure at least 50 percent above average (index over 150)
The map below shows how these criteria identify suburban areas in Silicon Valley (shown in green) rather than the metro hubs of San Jose, Mountain View and Palo Alto. Hovering over areas highlights the areas and variables which fail to meet the selection criteria. These are shown as red outlines and text. For ZIP Code 95134 in San Jose, a median age of 35 is almost 10 years below the target range of 45-60 and therefore the area fails our benchmark test.
Matching Target Demographics
Using Smart Map Search you can combine up to five variables at the same time. Rather than performing a series of individual analysis and mapping operation, it allows you to combine your own custom map variables with Esri’s demographic data to create an optimized way to search and target specific areas. This dramatically reduces the time taken to identify sites. Once you have those areas, be it a ZIP Code or a finer geography such as a block group in the US, you can export that list will all the target attributes to Microsoft Excel.
These lists might be passed on to another department or process such as marketing, who can use these demographics to improve their activities as well. For our Silicon Valley initiative, we may also want to enrich the target ZIP Codes with other Esri information such as the Electronic Market Potential Index (MPI) which predicts a high likelihood for owning a smartwatch, wearable or other smart tech.
Better still, Smart Map Search works with your own custom geographies or any of the standard administrative boundaries. This allows you to use smaller areas than a typical ZIP Code, which are often very large in the US. Because Smart Map Search can be used worldwide you have great flexibility in how you use postal units, administrative boundaries and census divisions.
Examining Interrelationships Between Variables
Finding the places that match your criteria should be the start of the analysis and investigation journey not the end of it. It’s critical that you understand how variables relate to each other as well as their importance and influence in finding optimal locations.
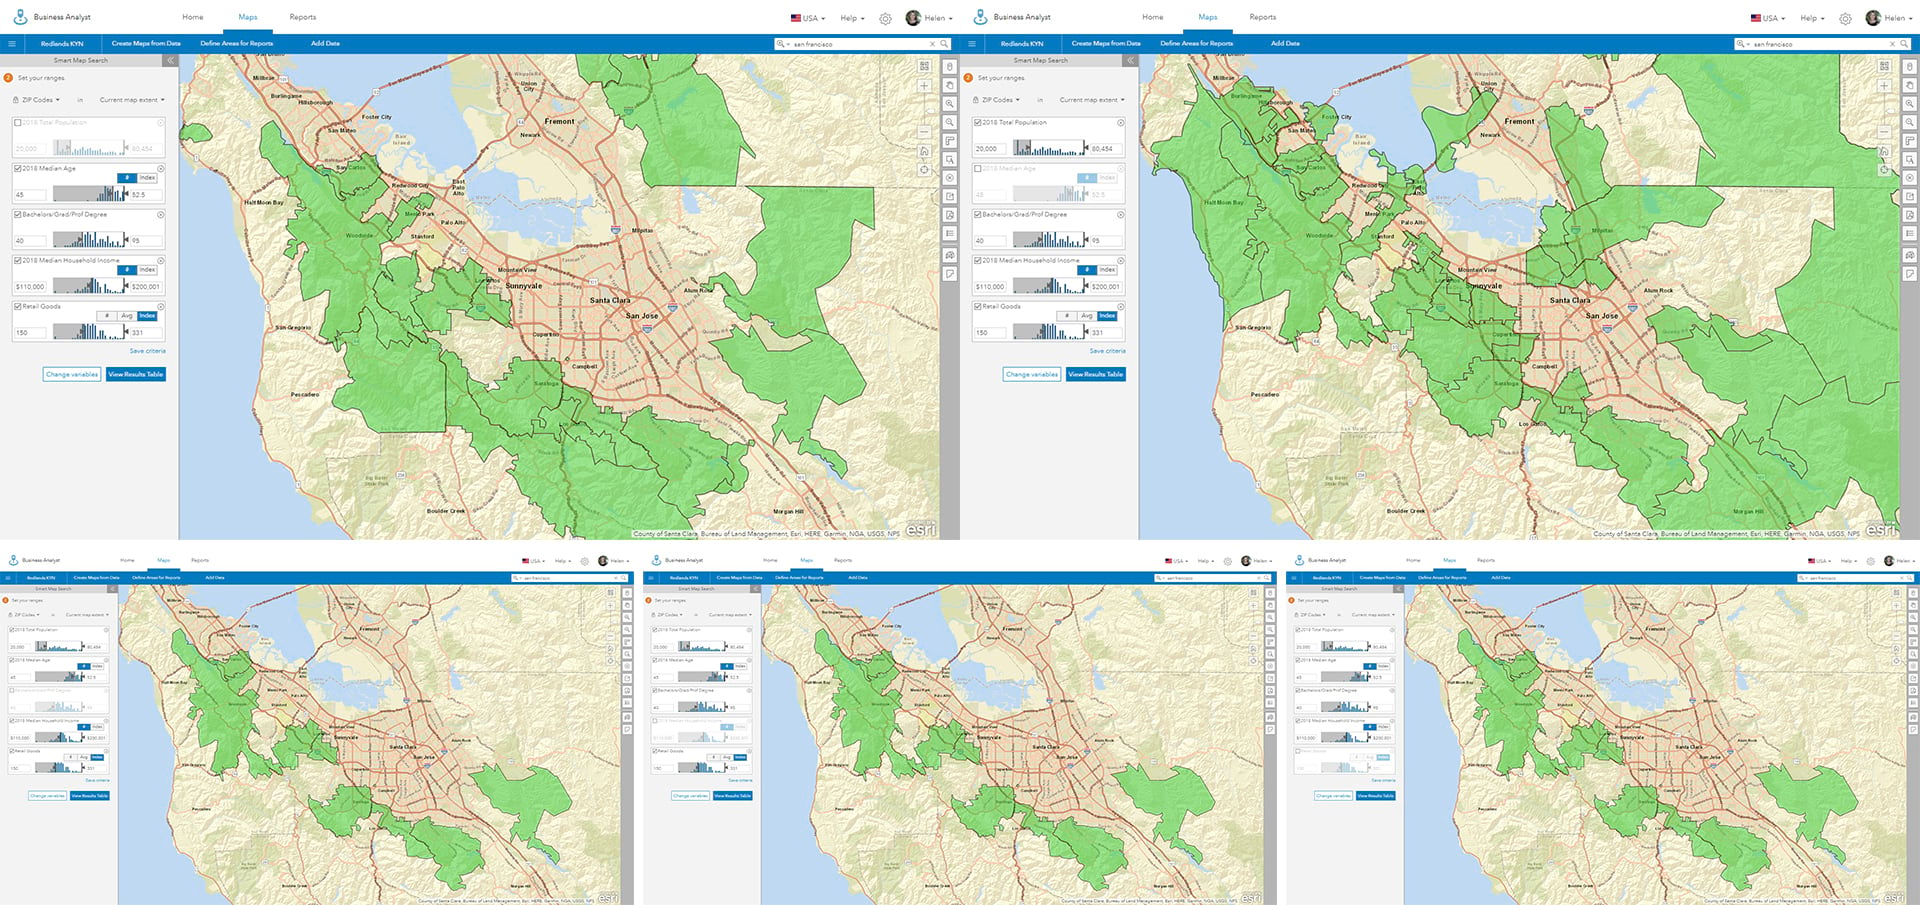
Smart Map Search allows you to toggle individual or multiple variables on or off to see how this affects the selected areas. In our Smart Home example, population and age have the biggest influence on what areas are found. When either variable is excluded there are significant changes to the matched areas as shown in the upper two images below. In contrast, removing income, educational attainment or retail expenditure has little or no effect on which areas are matched (bottom three images). This suggests a strong correlation between these variables given the current selection criteria.
Digging Deeper into Distributions
Part of the philosophy behind the design of Smart Map Search is the need to help users discover the signal in the noise. It helps users understand how variables change across the current study area and interact. Like the Smart Mapping tools in ArcGIS Online, Business Analyst’s Smart Map Search capabilities help you discover what’s important and how two or more variables relate.
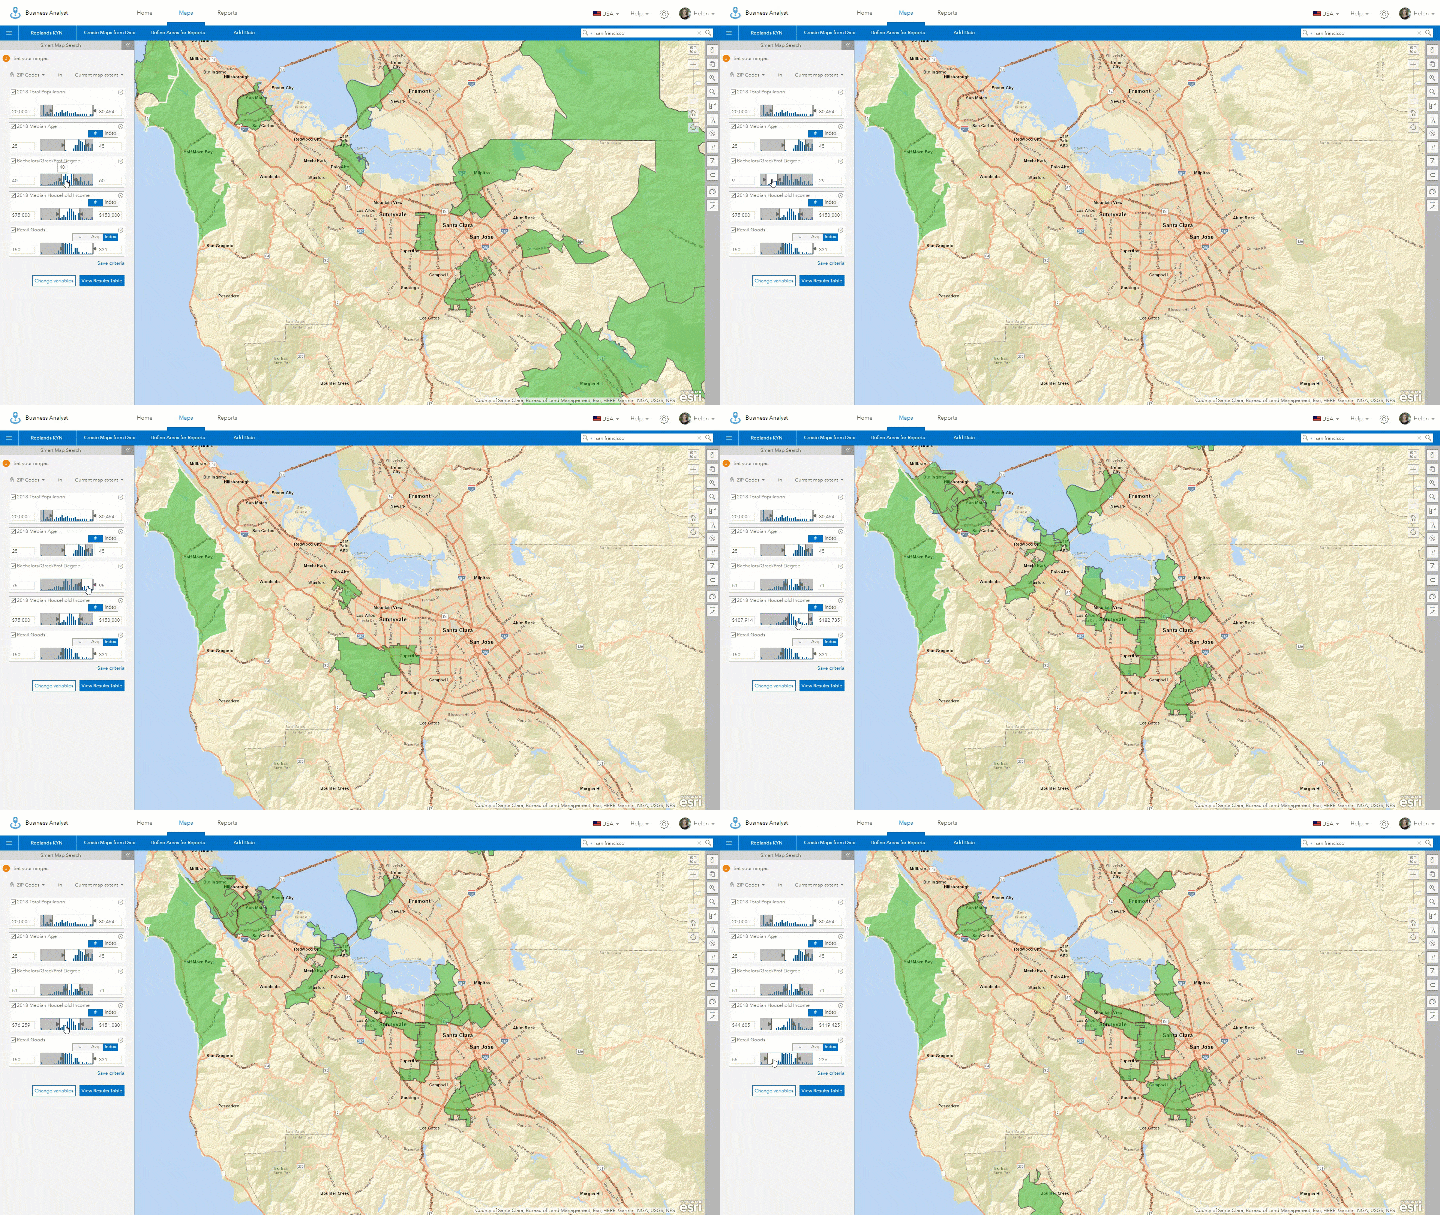
In the Silicon Valley example above, disposable income and retail expenditure appear to be correlated. Focusing on just these two variables will highlight areas where there is low income and retail expenditure, high income and expenditure or low-high/high-low neighborhoods. ZIP Codes with low income but high retail expenditure might suggest areas with large retirement communities possibly due to people who are no longer working but are able to spend accumulated wealth. Similarly, neighborhoods with high income and low retail expenditure might suggest that the residents are saving or have high fixed overheads like home payments. Many different consumer behaviors, lifestyle and other factors can influence how these variables interact across the region.
Creating a custom variable which calculates the ratio of retail spending as a proportion of household income will provide a much clearer illustration of the relationship between these two variables. Like other Esri demographic variables it is an index organized around a mean which amplifies relationships that materially matter. Alternatively, the retailer might consider using net worth as an alternative to household income as it implies wealth accumulation and a measure of relative “richness”.
The video below showcases how easy it is to discover patterns and trends within Smart Map Search, zero in on opportunity and refine your understanding of your target market using data sliders.
Creating Custom Segments and Target Cohorts
One of my favorite things about Smart Map Search is when I find population pockets that display distinct behavior which I didn’t expect. For example, in the Silicon Valley example shown below, I identified a set of ZIP Codes with highly educated residents who are likely to have children, have middle to low income for the area and spend over 50% more than average. This demographic is also highly likely to buy Smart Home products and while they were not part of our original target group we can engage them with different marketing messages and expand the reach of the campaign. I can save these criteria as a custom list that I can easily use again to repeat my exploration and investigation again later.
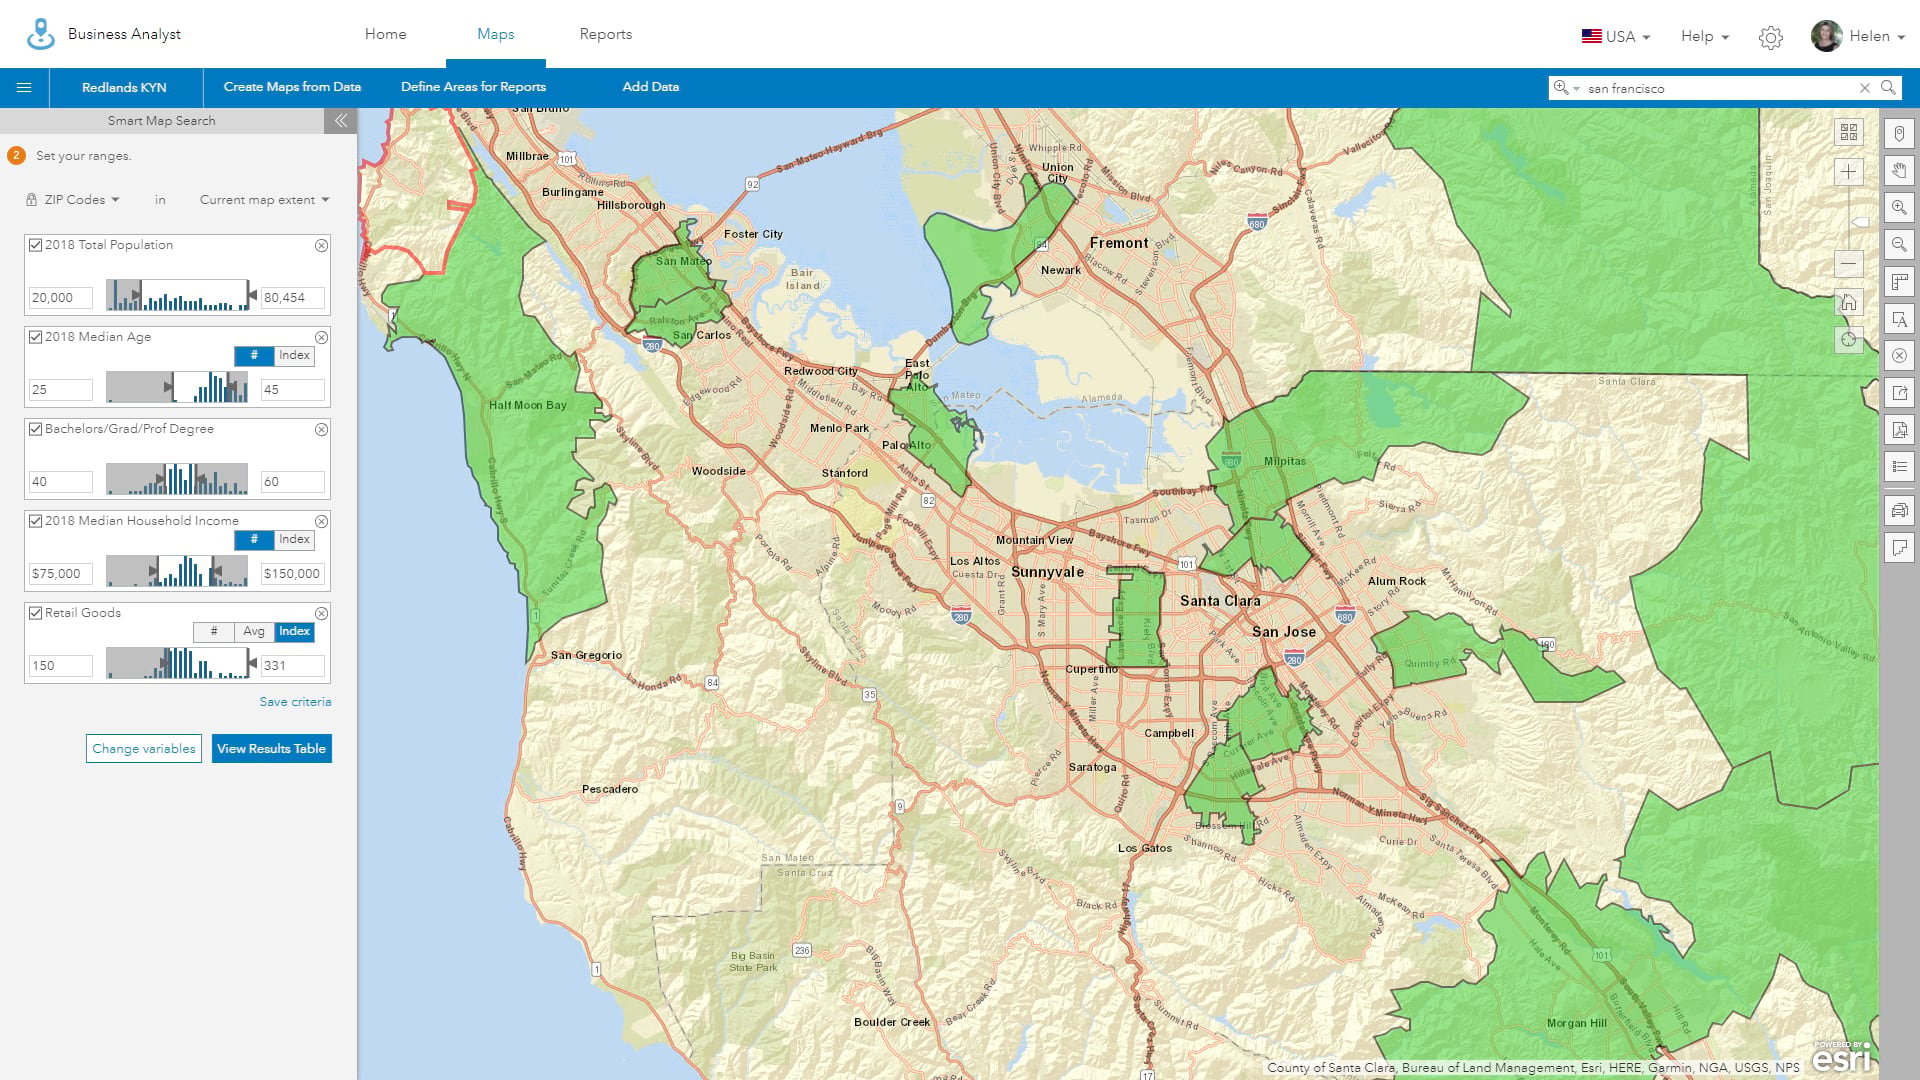
Using a saved variable list, I can explore where my target cohort lives anywhere in the country. I can test whether the cities like Los Angeles and San Francisco have similar segments, where they might live or start to explore the subtler differences in markets and demographics that Smart Map Search exposes.
Creating Your Own Demographic Fabric
I must admit that Smart Map Search is my favorite Business Analyst tool! Not only do I get to understand more about markets but I can build my own segments that supplement Tapestry’s LifeMode and Urbanization groups. I can create a detailed profile of Smart Home buyers in California or the Pacific Northwest. I can do this anywhere based on my need and motivation. Smart Map Search enables me to refine my target groups with nuanced ranges and different key variables to better reflect the local character and characteristics of a market rather than relying on a one size fits all approach. Ultimately, I’m able to define and build my own demographic fabric of any market by better understanding the people that live there.
Smart Map Search is a must for anyone looking to better understand their markets, improve marketing, target government or commercial resources or discover areas of need. I’m surprise it’s so often overlooked by people who can benefit the most from using it.
I hope this blog inspires you to explore its capabilities more and turn your suitability searches into pinpoint realization of opportunity. To see a video tutorial of Smart Map Search visit: https://www.youtube.com/watch?v=GJfsmtRiZSA

Commenting is not enabled for this article.