The November 2024 update of Map Viewer brings many rich features and enhancements, such as the ability to have multiple tabs open. This new functionality allows you to hop between different tables, analysis history, raster function editor, and more – all without losing your previous tabs.
Additionally, learn how to elevate your website’s content by using Map Viewer’s new Embed experience. This simplified configuration allows you easily customize your public maps and share in a matter of seconds. Or take the new ModelBuilder (Beta) in Map Viewer for a spin. See how this no-code builder can help streamline or even automate complex analysis workflows.
Use the quick links below to learn more about all these updates and more. As always, we hope you enjoy these new features and we’d love to hear how you are using these enhancements in your work. Happy Mapping!

Quick links
- Multiple tabs
- Table
- Embed maps
- Editing
- Sketch
- Data and field management
- Smart mapping and styling
- Pop-ups
- Labeling
- Analysis
- Charts
- Imagery
- Other updates
- More resources

Multiple tabs
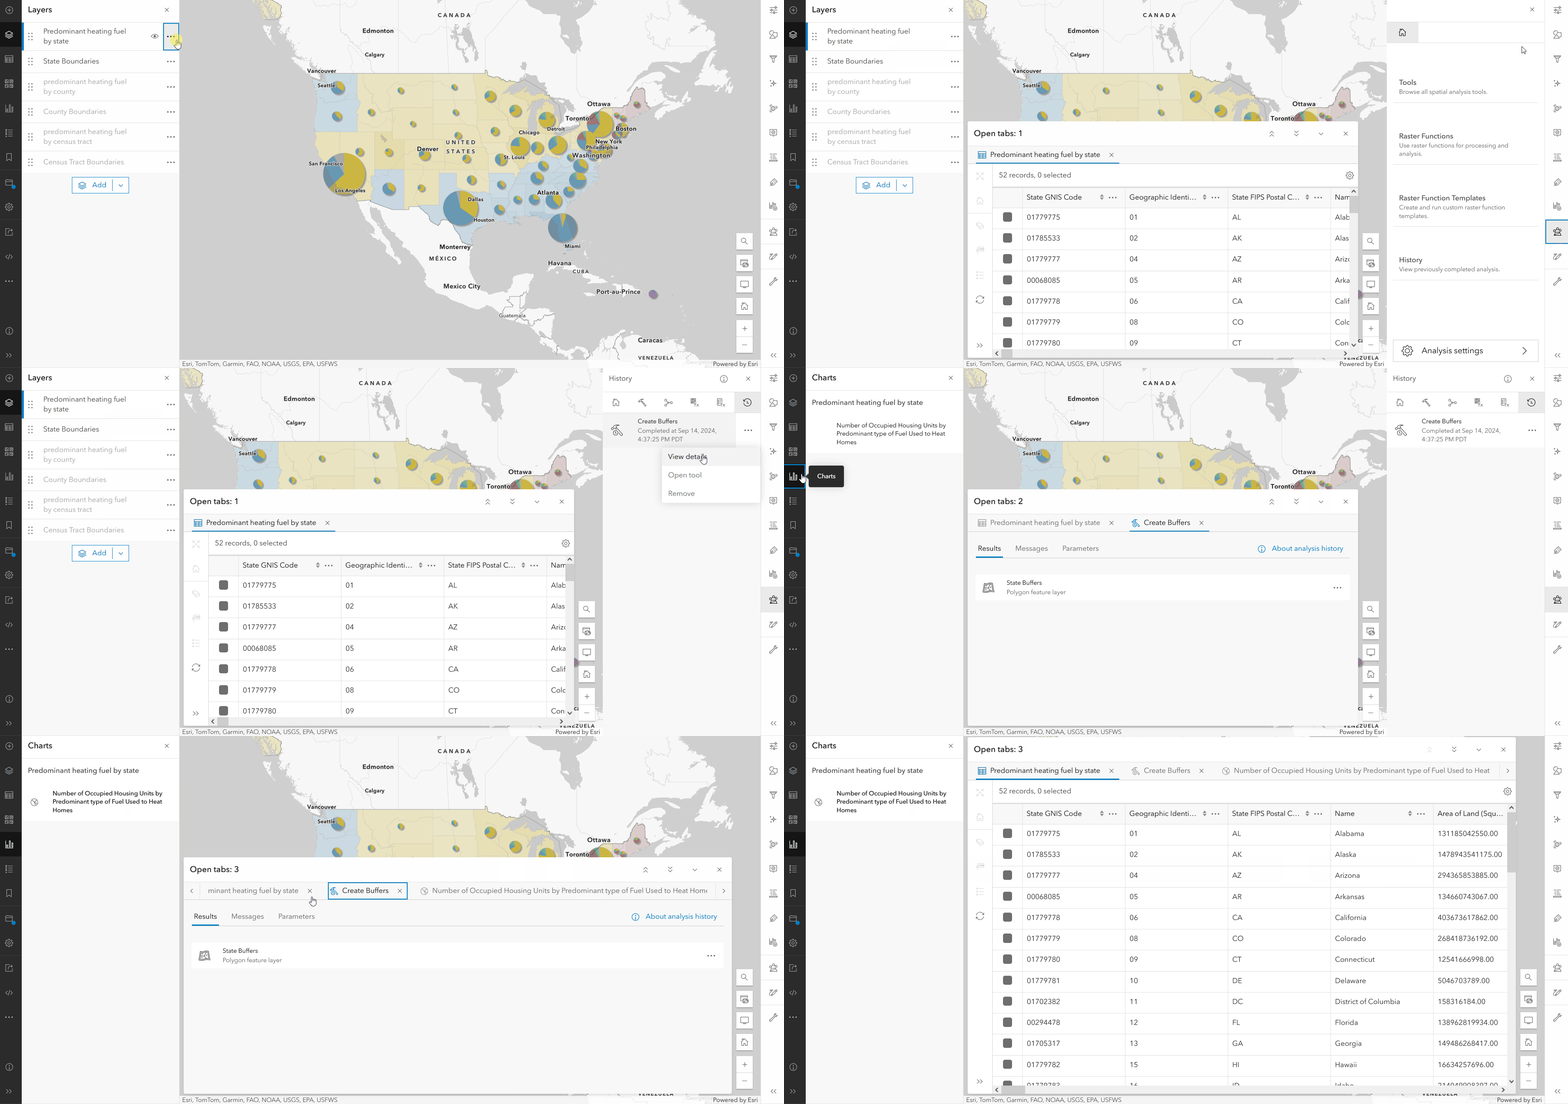
The November 2024 update introduces the ability to have multiple tabs open in Map Viewer. This means that tables, Analysis History, Raster Function Editor, Charts, and ModelBuilder (Beta) can all be opened into separate tabs without closing other items. The time and multi-dimensional imagery sliders now sit on top of of open tabs as well, maximizing your access to settings without sacrificing the current view.
Expanded height options are now available as well, including small, medium, large, and minimized.

Table
This update offers improvements to the table in Map Viewer. Read on to learn more.
Attachments
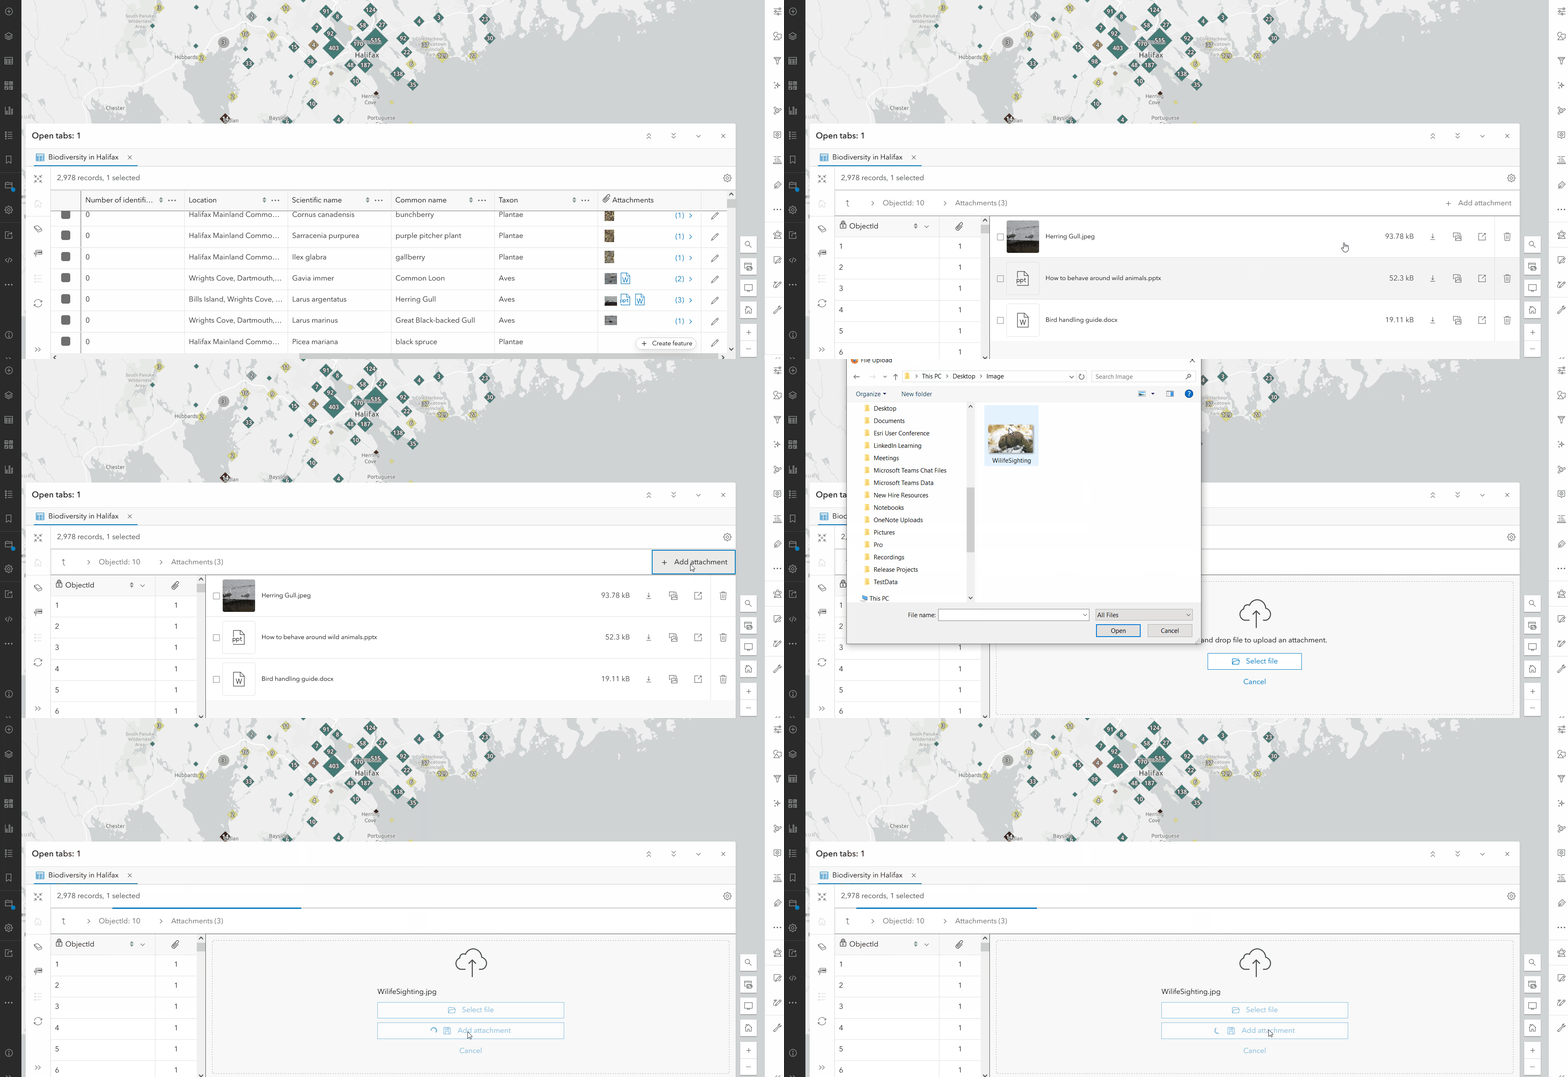
Attachments are now supported in the table! Browsing through attachments has been thoughtfully designed to have the same look and feel as related records in the table. Simply find the Attachments field in the dataset, then click to drill into a specific feature or record’s attachments. From here you can view, download, delete, update, or add new attachments.
Field settings persistence
Take control of your table settings with the November 2024 update of Map Viewer. The table will now save any changes made to the visibility, sort, and order of fields with the web map.
To learn more about the updates to the table, see Explore and control more with attachment management and table configuration.

Embed maps
Embed public web maps into your own website in a matter of seconds using Map Viewer’s new Embed map experience. This simplified configuration allows you easily customize elements such as the available actions, light or dark theme, and settings. Once you are happy with the result, simply copy the automatically generated HTML code and paste into your own website. Voila!
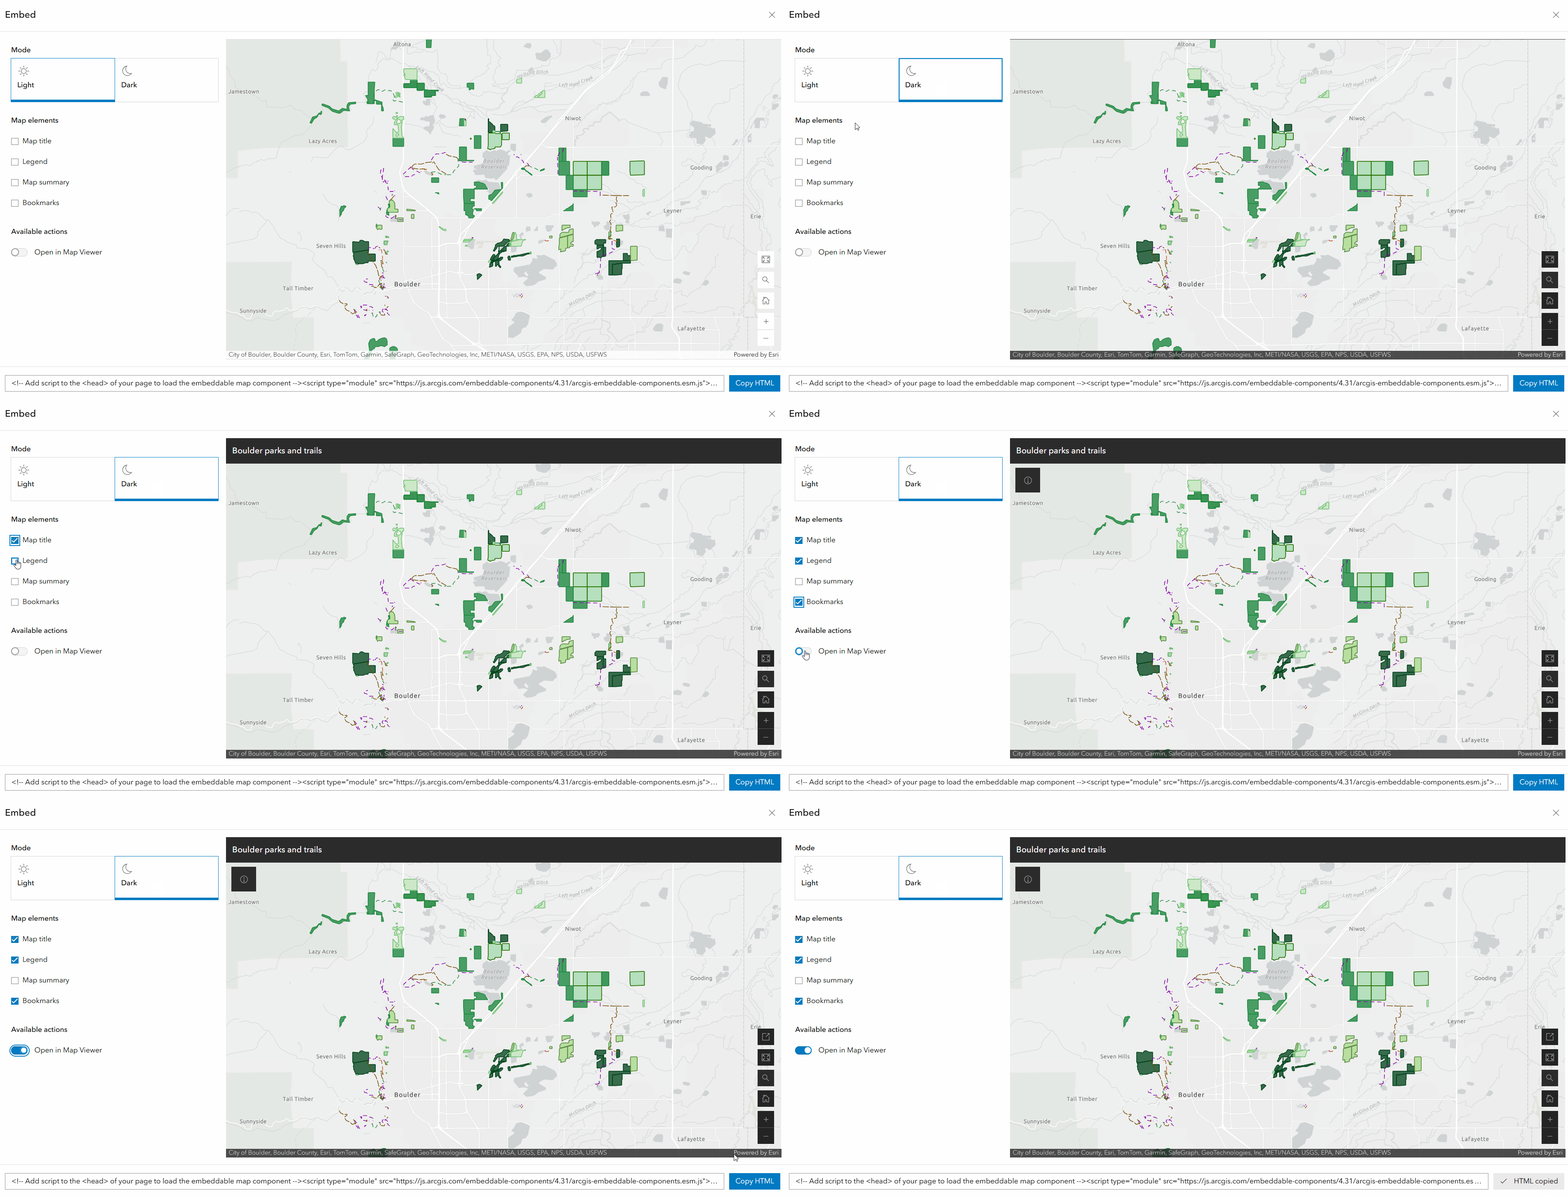
To learn more, see Embed your maps from Map Viewer with ease.

Editing
You can now use a two-dimensional grid as a snapping guide while creating or editing features. Enable the grid under settings in the Editor panel, then interactively move, rotate, and scale it to your desired placement. The grid is particularly useful for consistent spacing and straight lines.
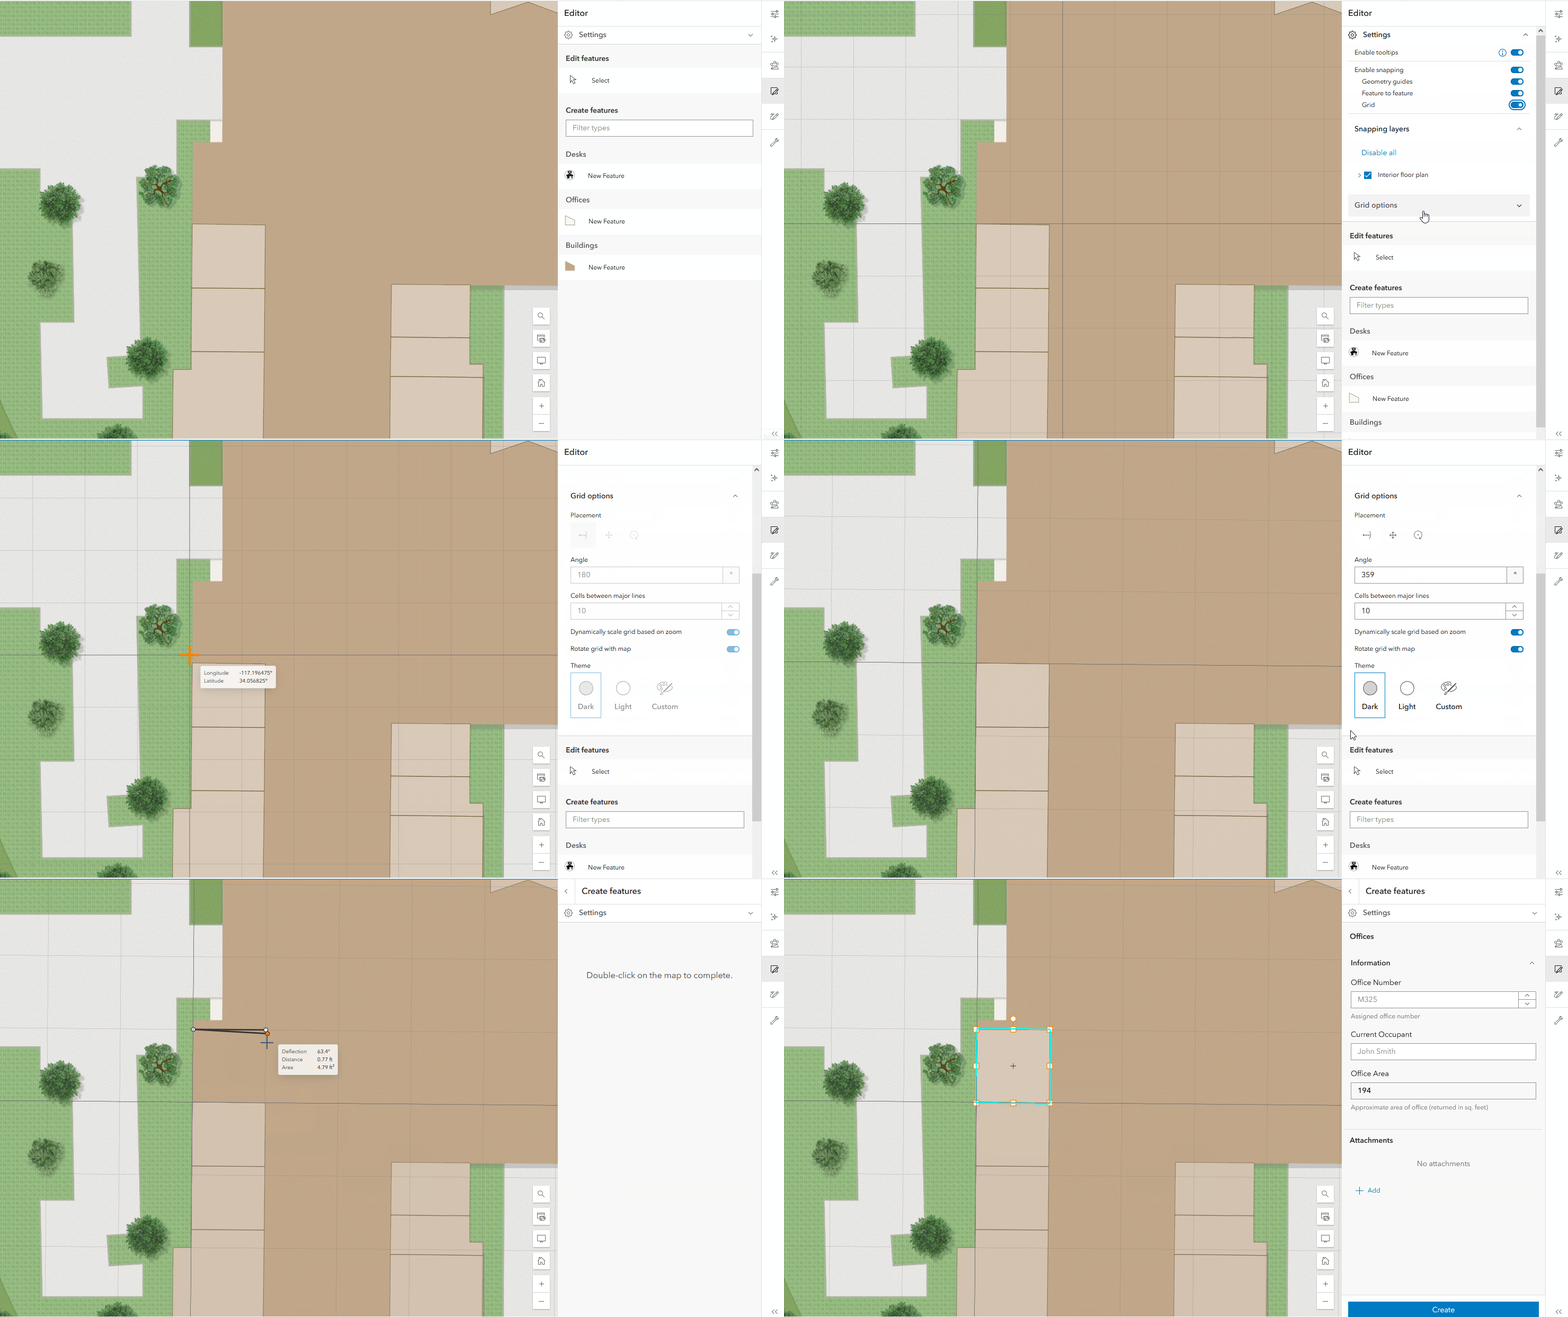
To learn more, see The grid: A snappy new editing tool in ArcGIS Online.

Sketch
Do you like the idea of a snappable grid for editing, but also want access to it for your sketches? All of the same benefits and snapping functionality for the grid carry over into sketch as well. Use the grid to create even spaced features and easily sketch features.
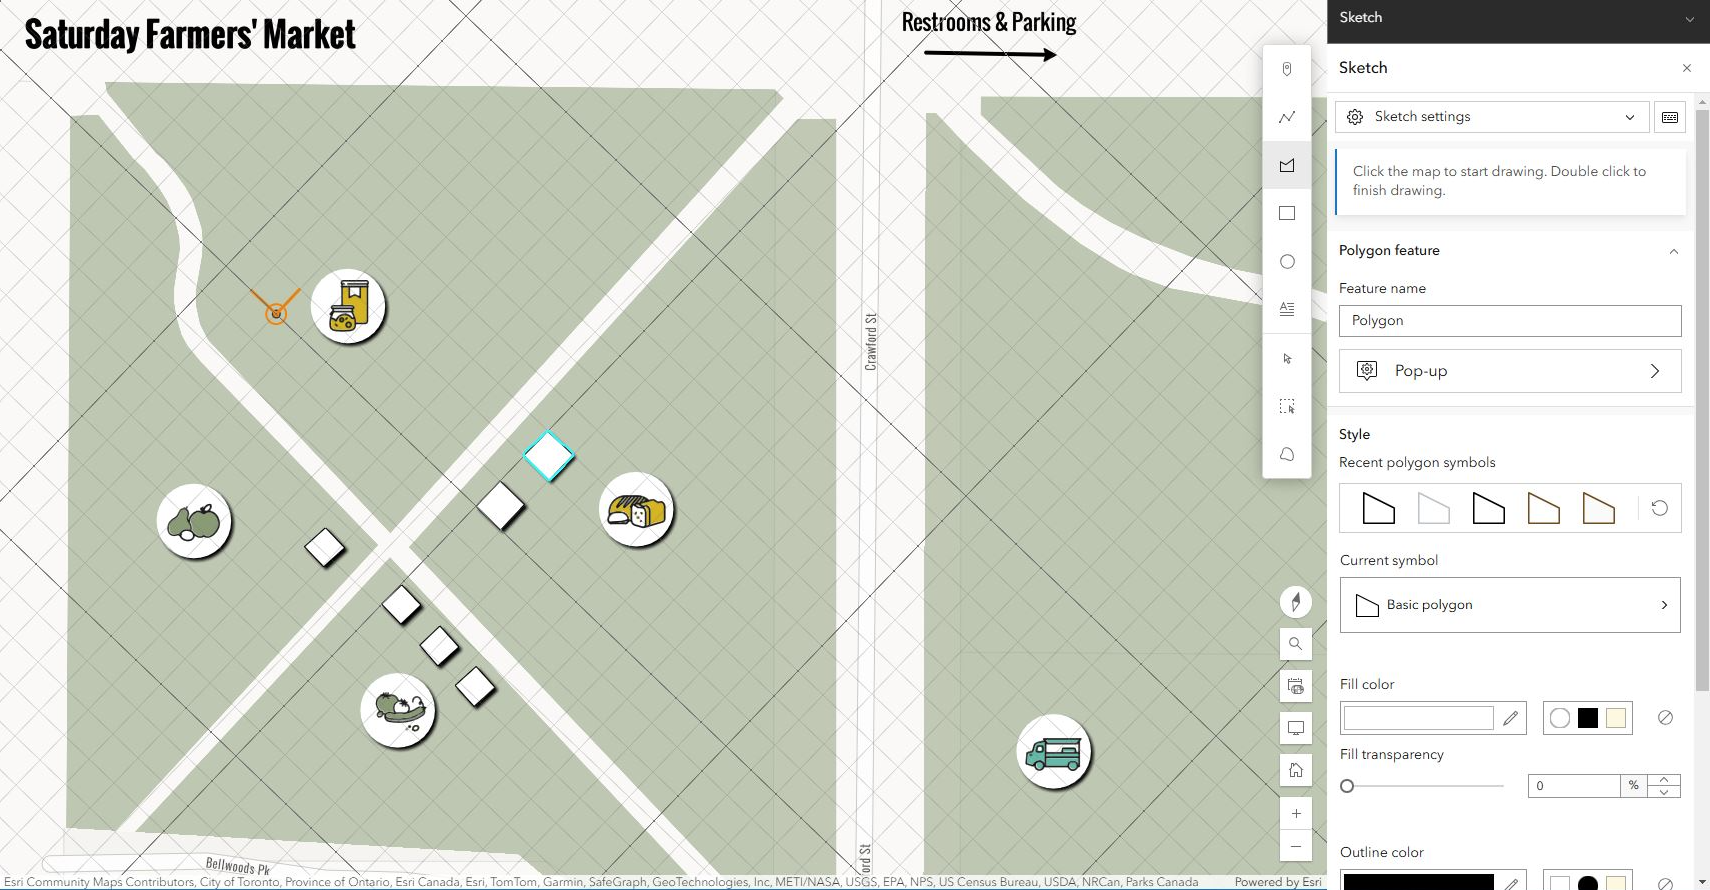
Web styles are collections of symbols stored in an item and are used to symbolize features. You can now customize your sketch symbol gallery by specifying a 2D sketch web style group in the Organization settings.

To learn more, see What’s new in Sketch (November 2024).

Data and field management
Field Calculation
The November 2024 update of Map Viewer has some particularly exciting enhancements for the SQL savvy user. For starters, Field Calculation now supports authoring and executing SQL expressions. Additionally, a new SQL expression editor was created for authoring SQL expressions. This editor has all of the rich functionality available when authoring Arcade expressions like auto-completion, validation, dynamic syntax highlighting, and more!
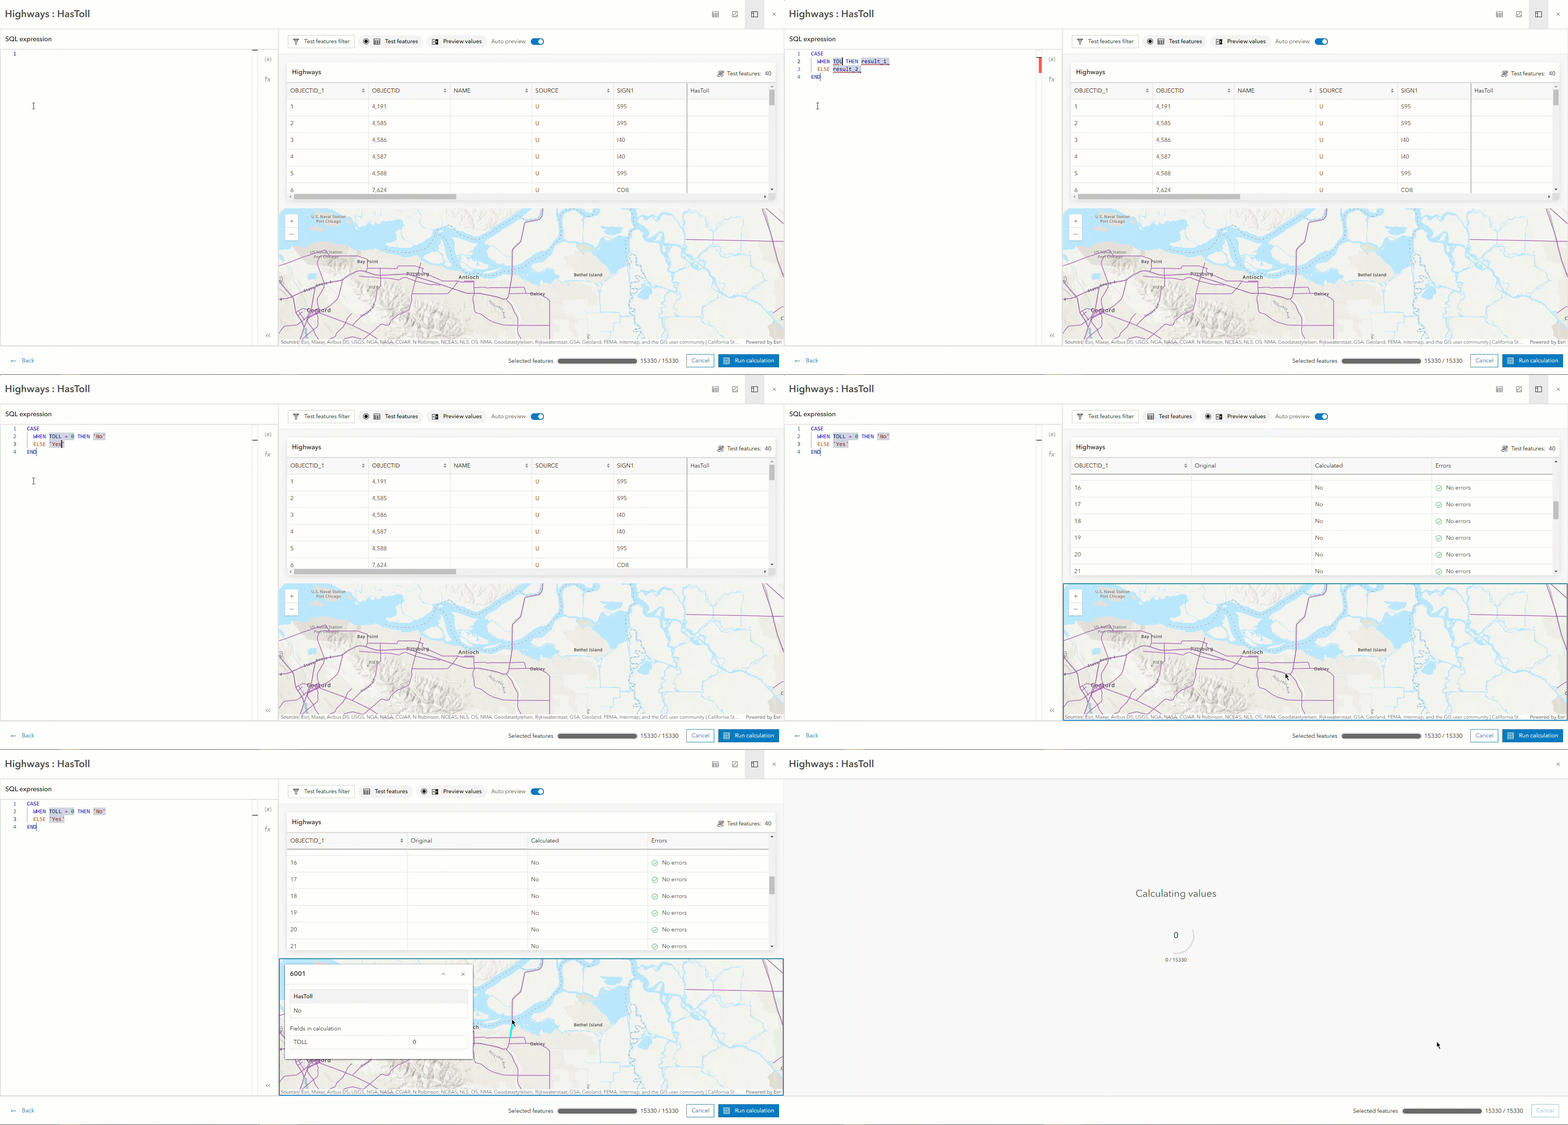
To learn more, see The New SQL Field Calculate Experience.
Add / delete field
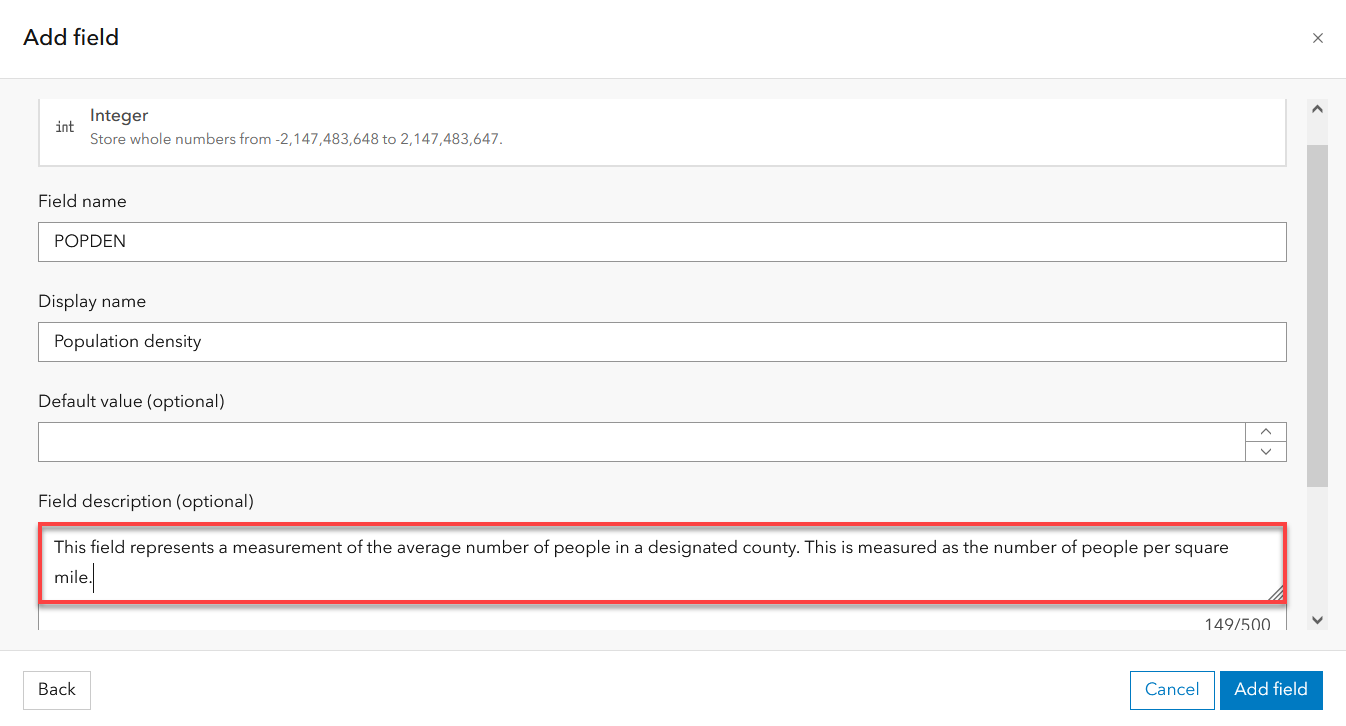
Adding and deleting fields within Map Viewer was introduced in the June 2024 update of Map Viewer. Now, you can add a field description when creating new fields for your hosted feature layer.
Fields pane
Change the sort order of fields in the Fields panel by using new options such as type, display name, or field name. These expanded sort options save you time and allow you to quickly organize your view while managing the fields, then will reset to the default view after the panel is closed.

Smart mapping and styling
Smart mapping and styling had some great quality of life improvements added with the November 2024 update. Read on to learn more.
Aggregation
Calling all geometry types! Binning is no longer limited to just points – you can now configure and style bins for lines and polygons. This is particularly impactful for features that may not be visible at smaller scales (zoomed out). Adjust the Scale threshold to turn off aggregation and display the original features to your liking.

Styling
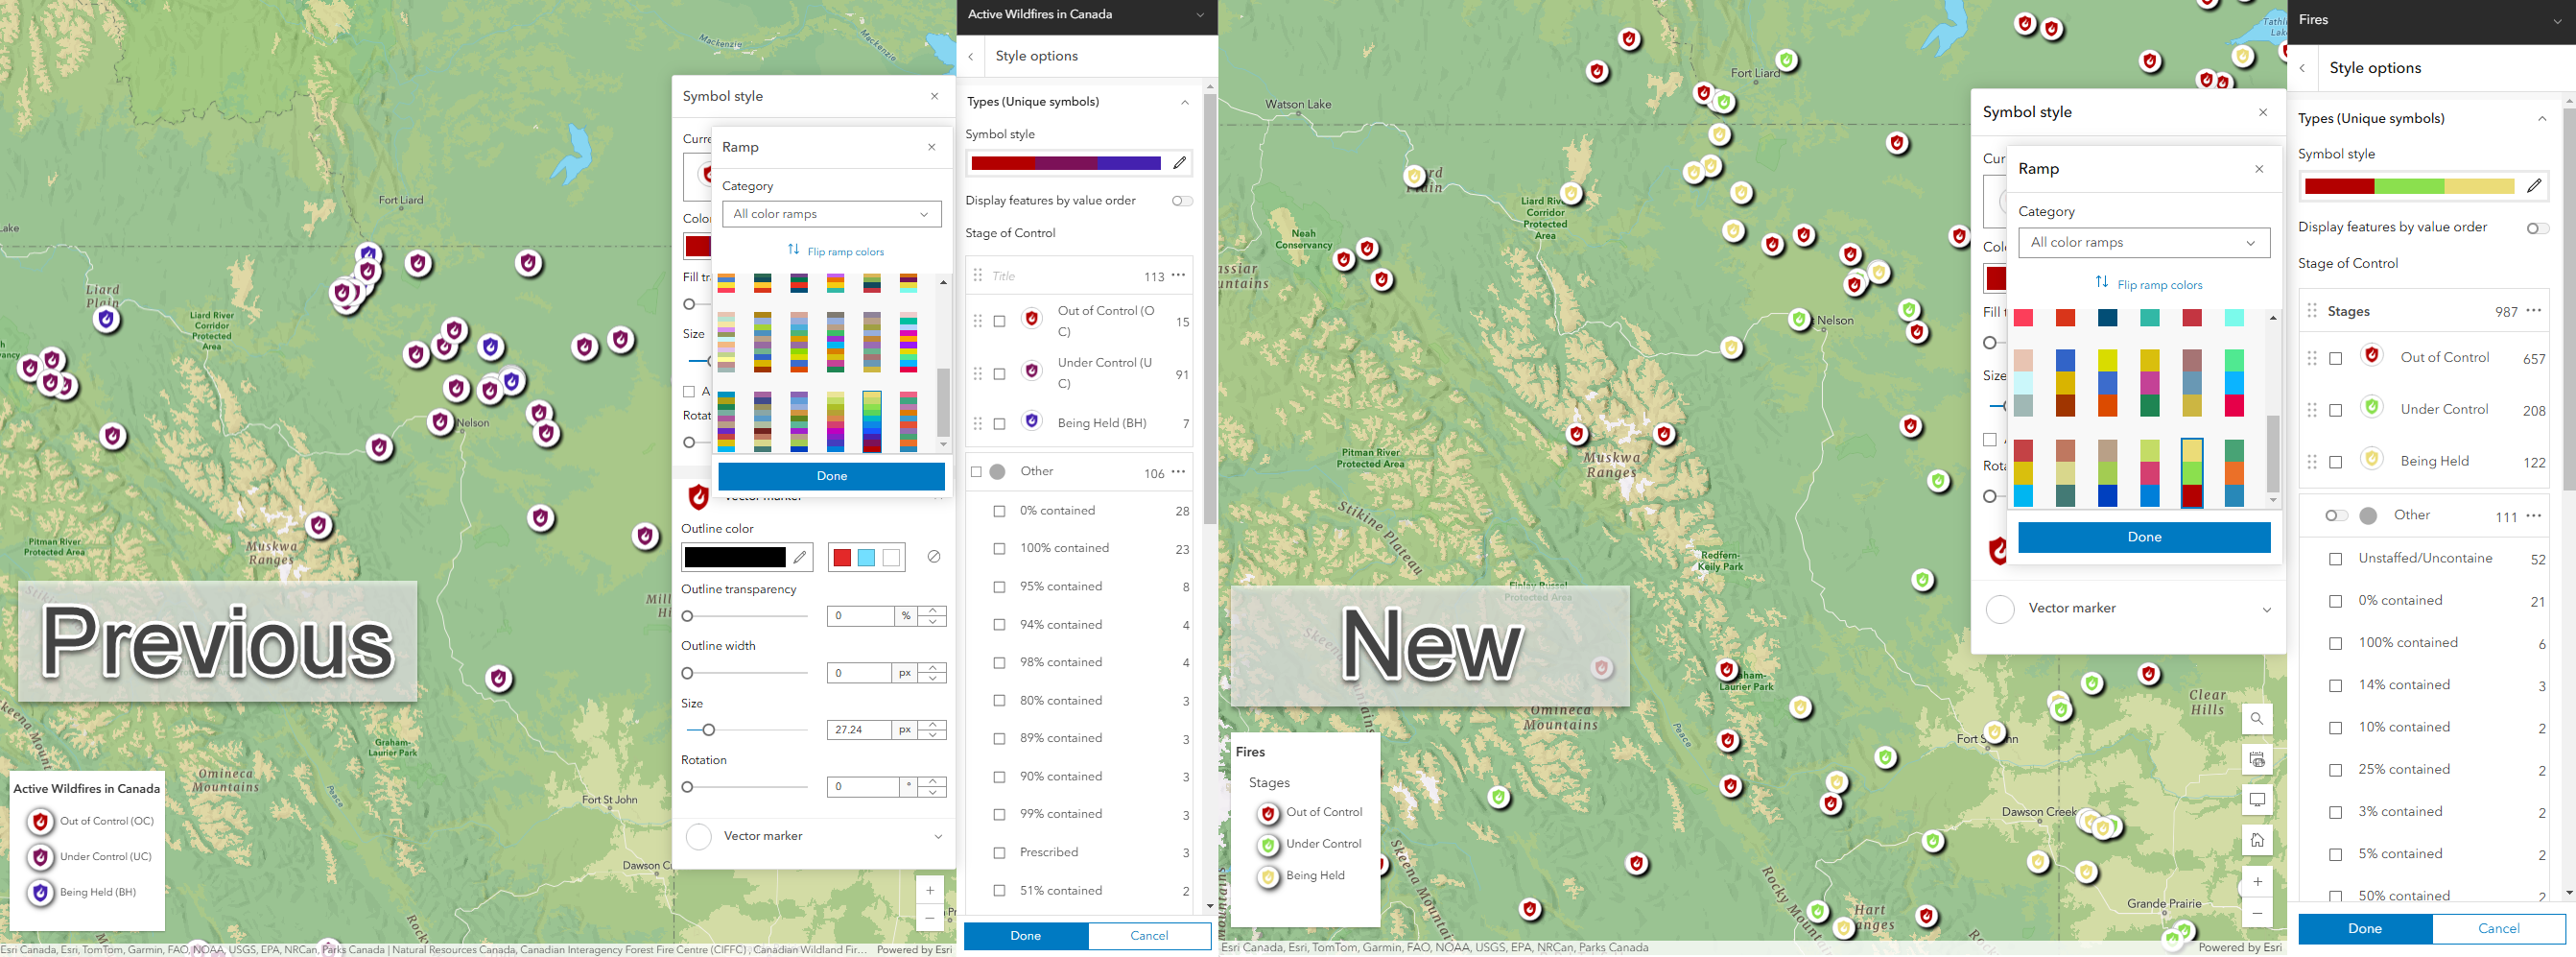
A small but impactful update to styling is that ramp color styling will distribute distinct colors when working with a smaller amount of values. Previously, similar color values would have been automatically applied despite only having a few types. Now, distinct colors are applied to help with map readability.
Legend
The legend will now honor layer definition filters present on fields symbolizing a feature layer. Previously in Map Viewer, the legend was automatically generated regardless of layer definitions.


Pop-ups
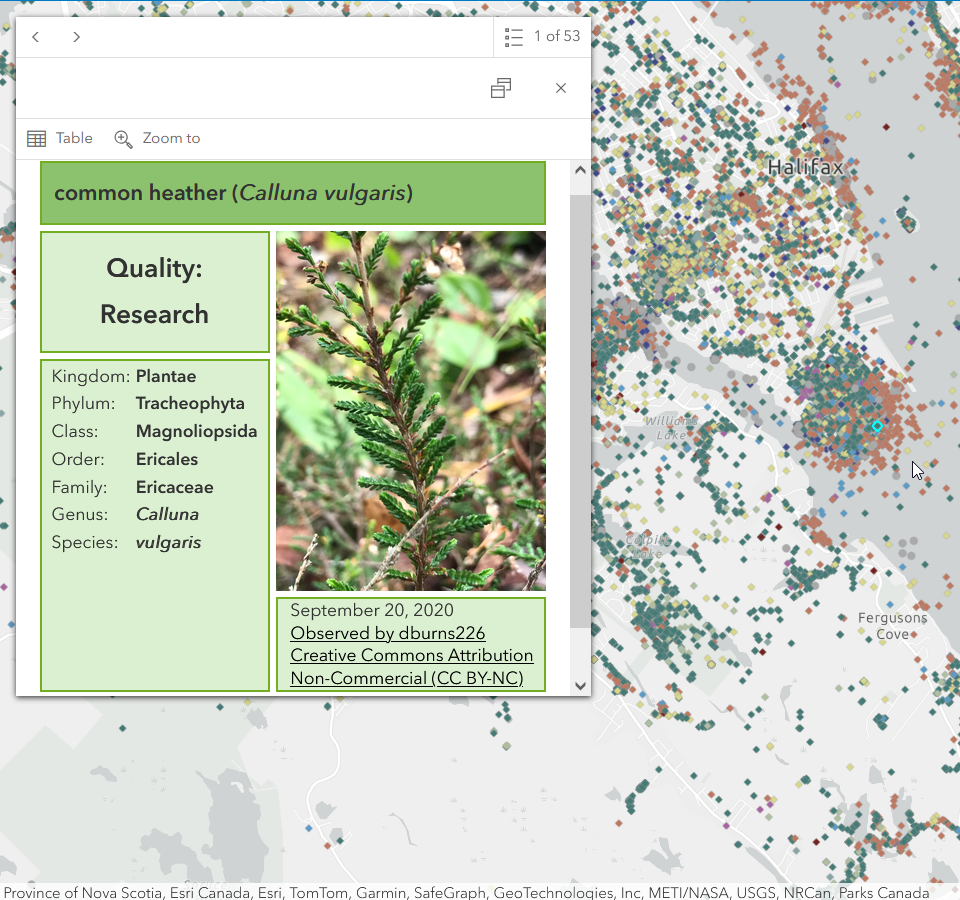
Pop-ups have added HTML attributes to make text content more accessible, such as aria-label and aria-hidden. You can now elevate your pop-ups even more with with newly supported CSS grids and flexbox layouts. These layouts provide structured columns and rows to organize pop-up content, such as attributes or Arcade variables.

Labeling
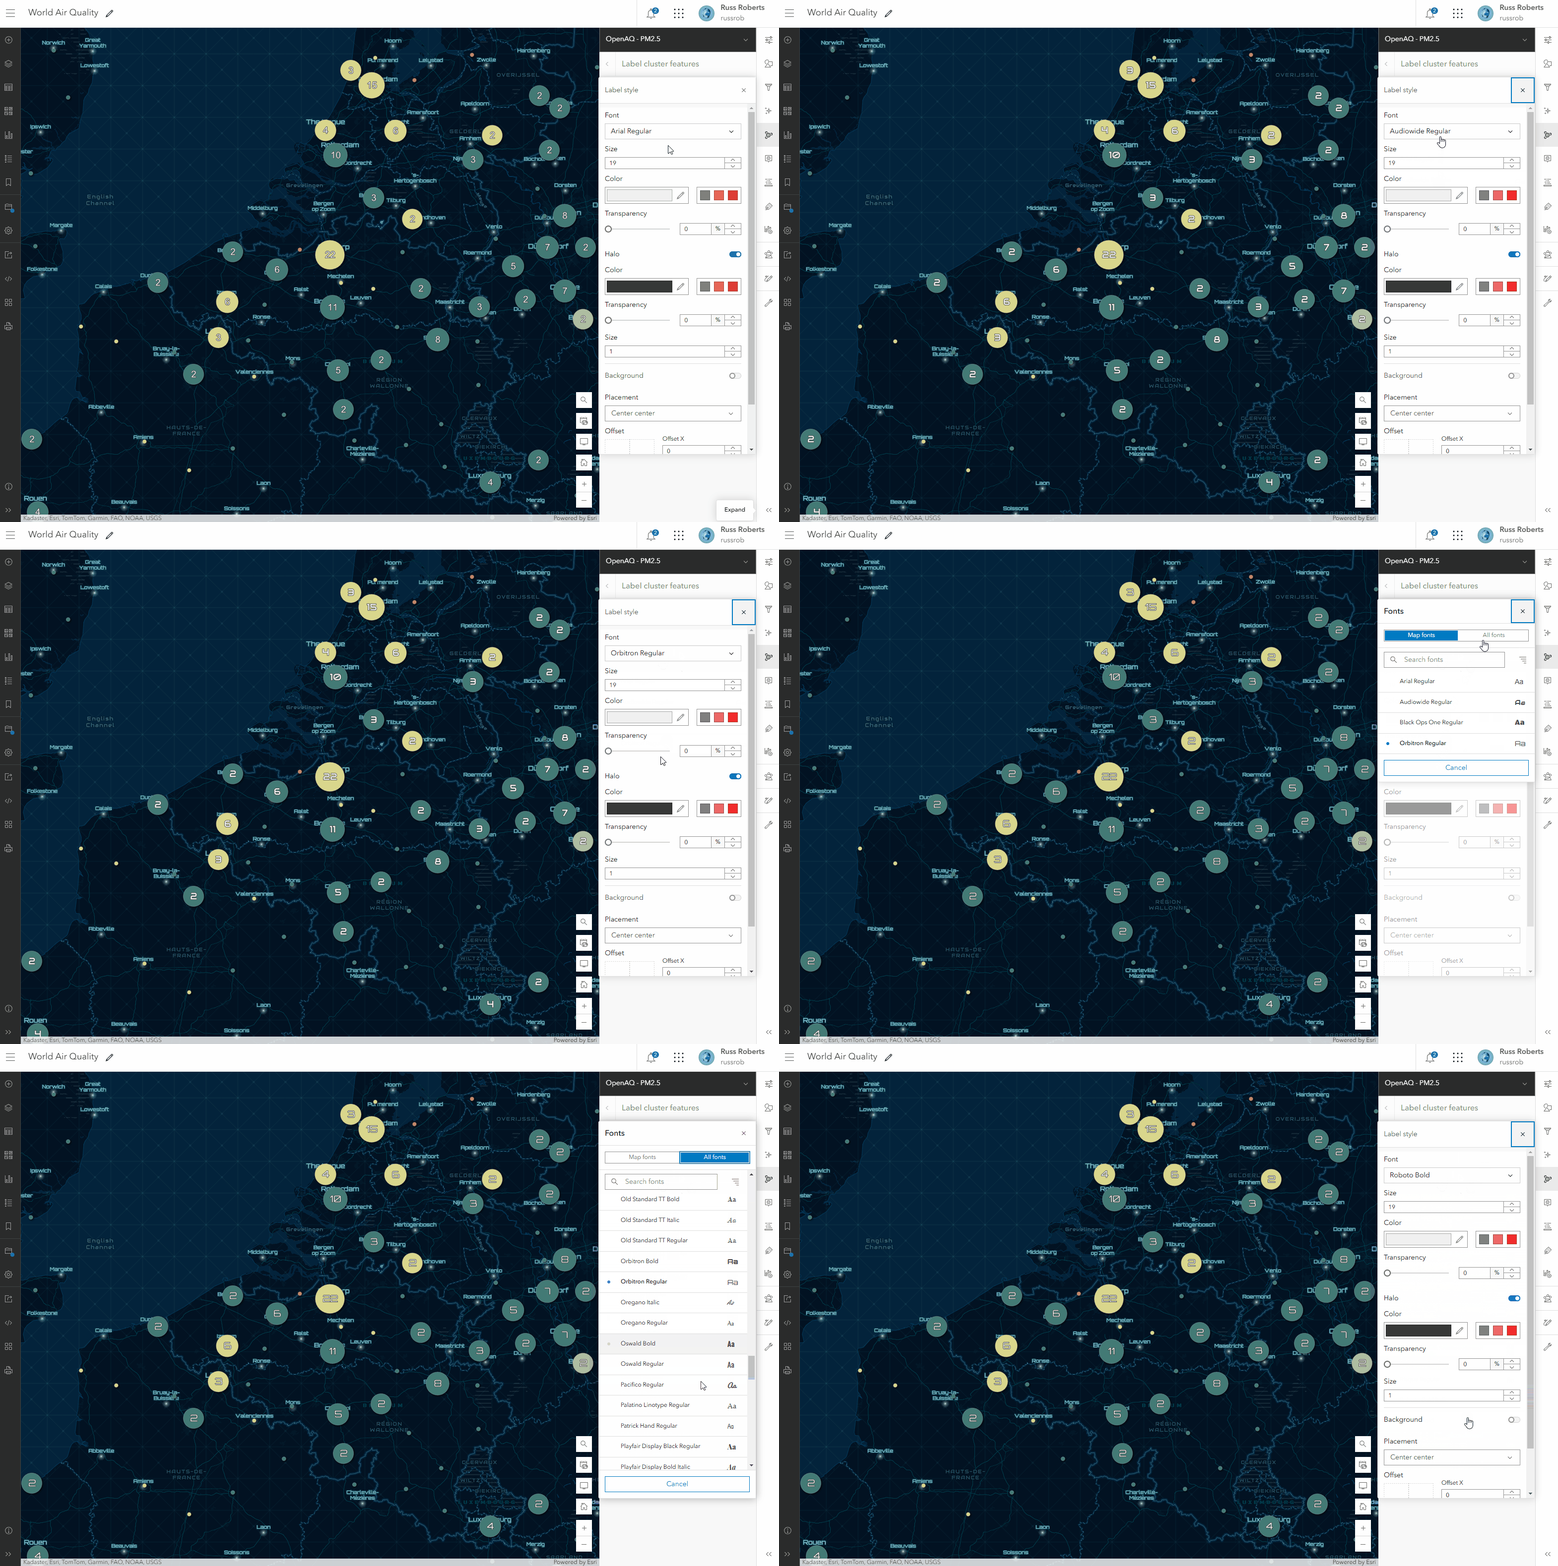
“Which font did I use again?” If you are using a basemap or feature layer with ArcGIS Online provided fonts, Map Viewer will now automatically detect and recommend these fonts for other layers in your map. This not only saves you time but helps create cleaner and more consistent styling throughout your maps.

Analysis
If you have used ArcGIS Pro for any of your geoprocessing needs, you might be familiar with ModelBuilder. This no-code workflow constructor allows you to chain analysis tools and data together, where the output of one tool becomes the input for another. Now, you can build your very own models with ease in Map Viewer using ModelBuilder (Beta)! Whether you are attempting to streamline a simple routine task or tackle a complicated spatial analysis workflow, try taking the new ModelBuilder (Beta) for a spin.
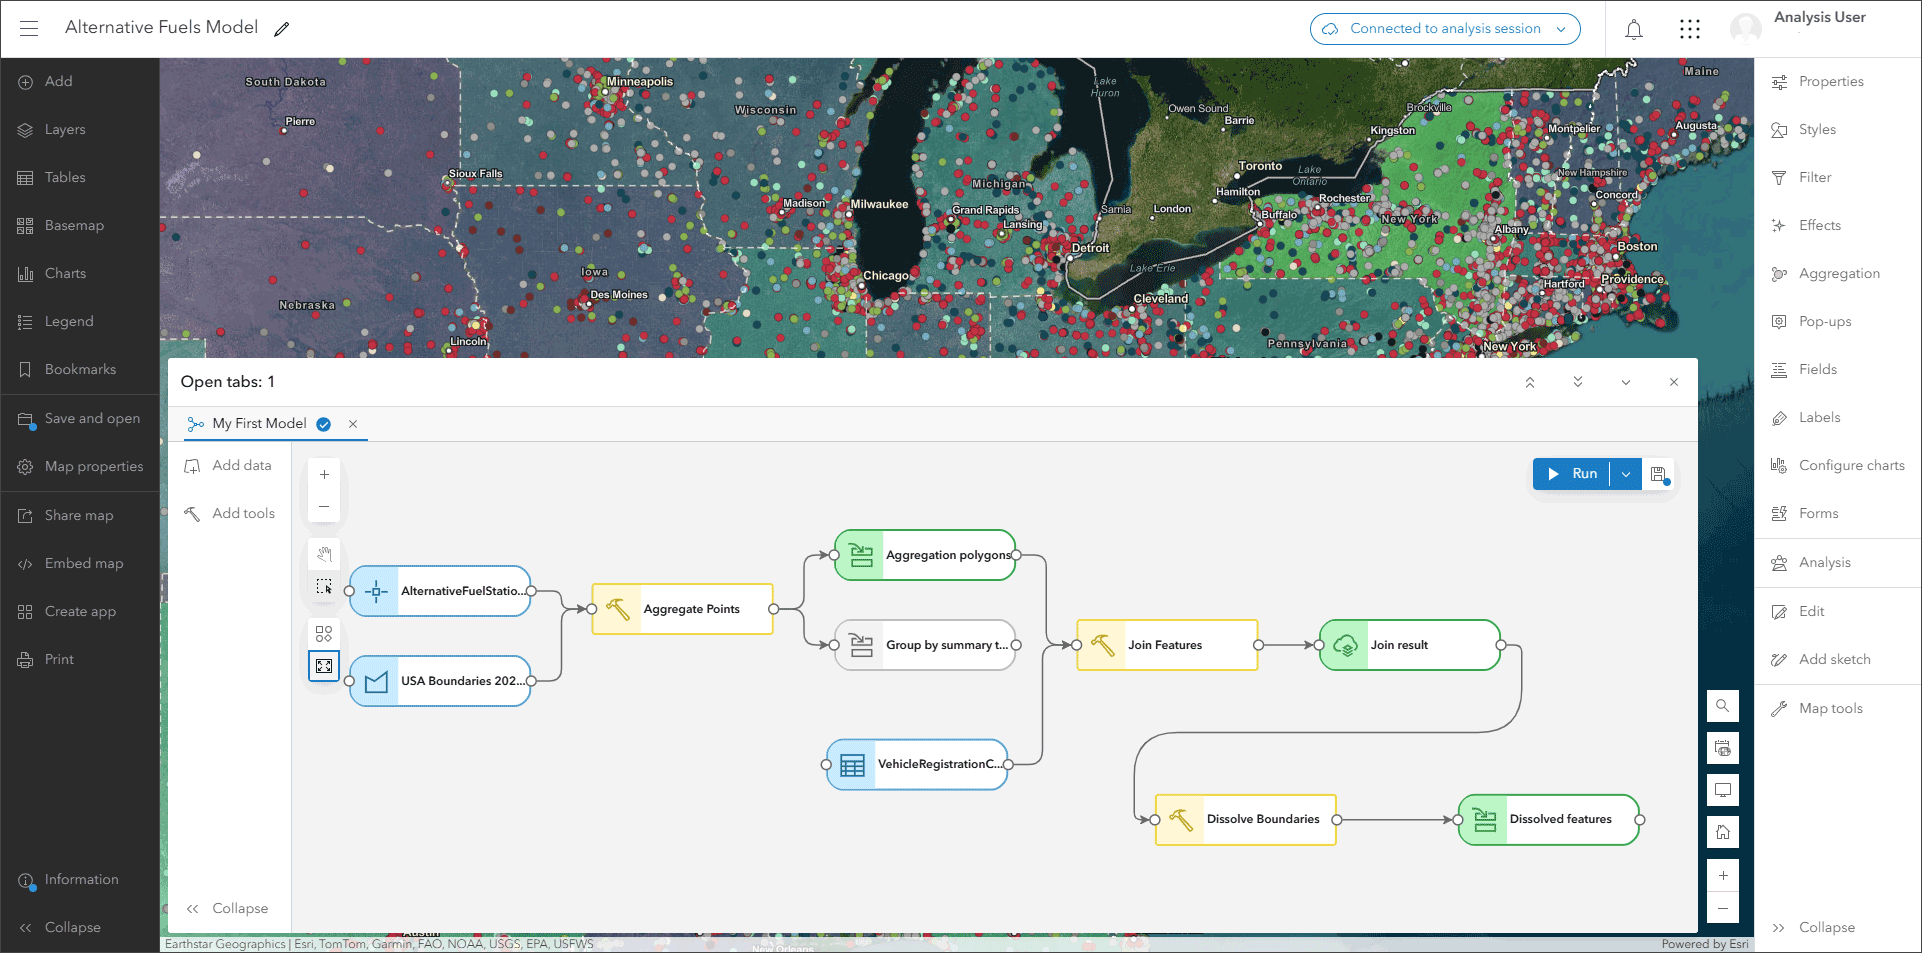
To learn more, see Introducing ModelBuilder (Beta).

Charts
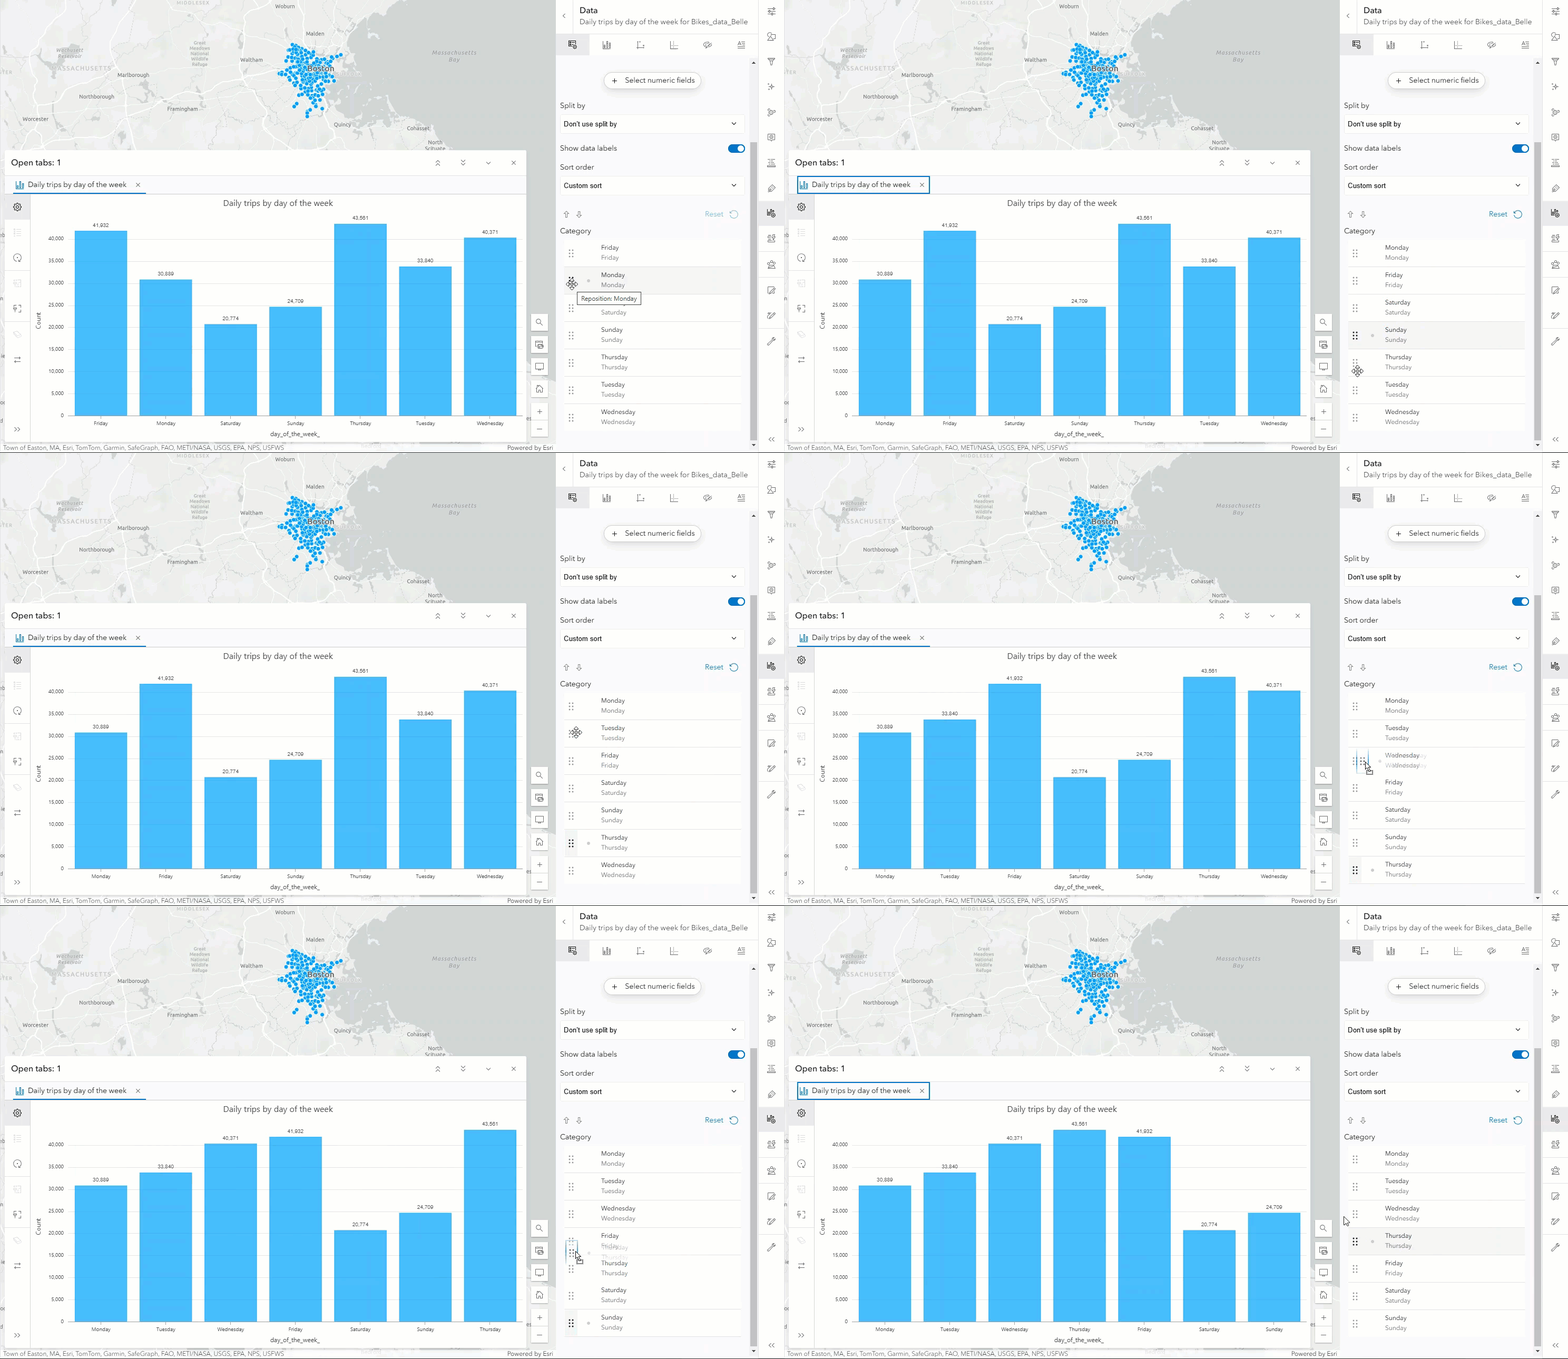
Custom sort is now supported in charts. In addition to sorting alphabetically or by value, you can manually reorder the categories in your bar charts and box plots using the Custom sort option in the Sorting dropdown.
Temporal guides are also available for bar charts and line charts with a numeric x-axis allowing you to call attention to a specific date or range of dates.
To learn more, see What’s new in Charts.

Imagery
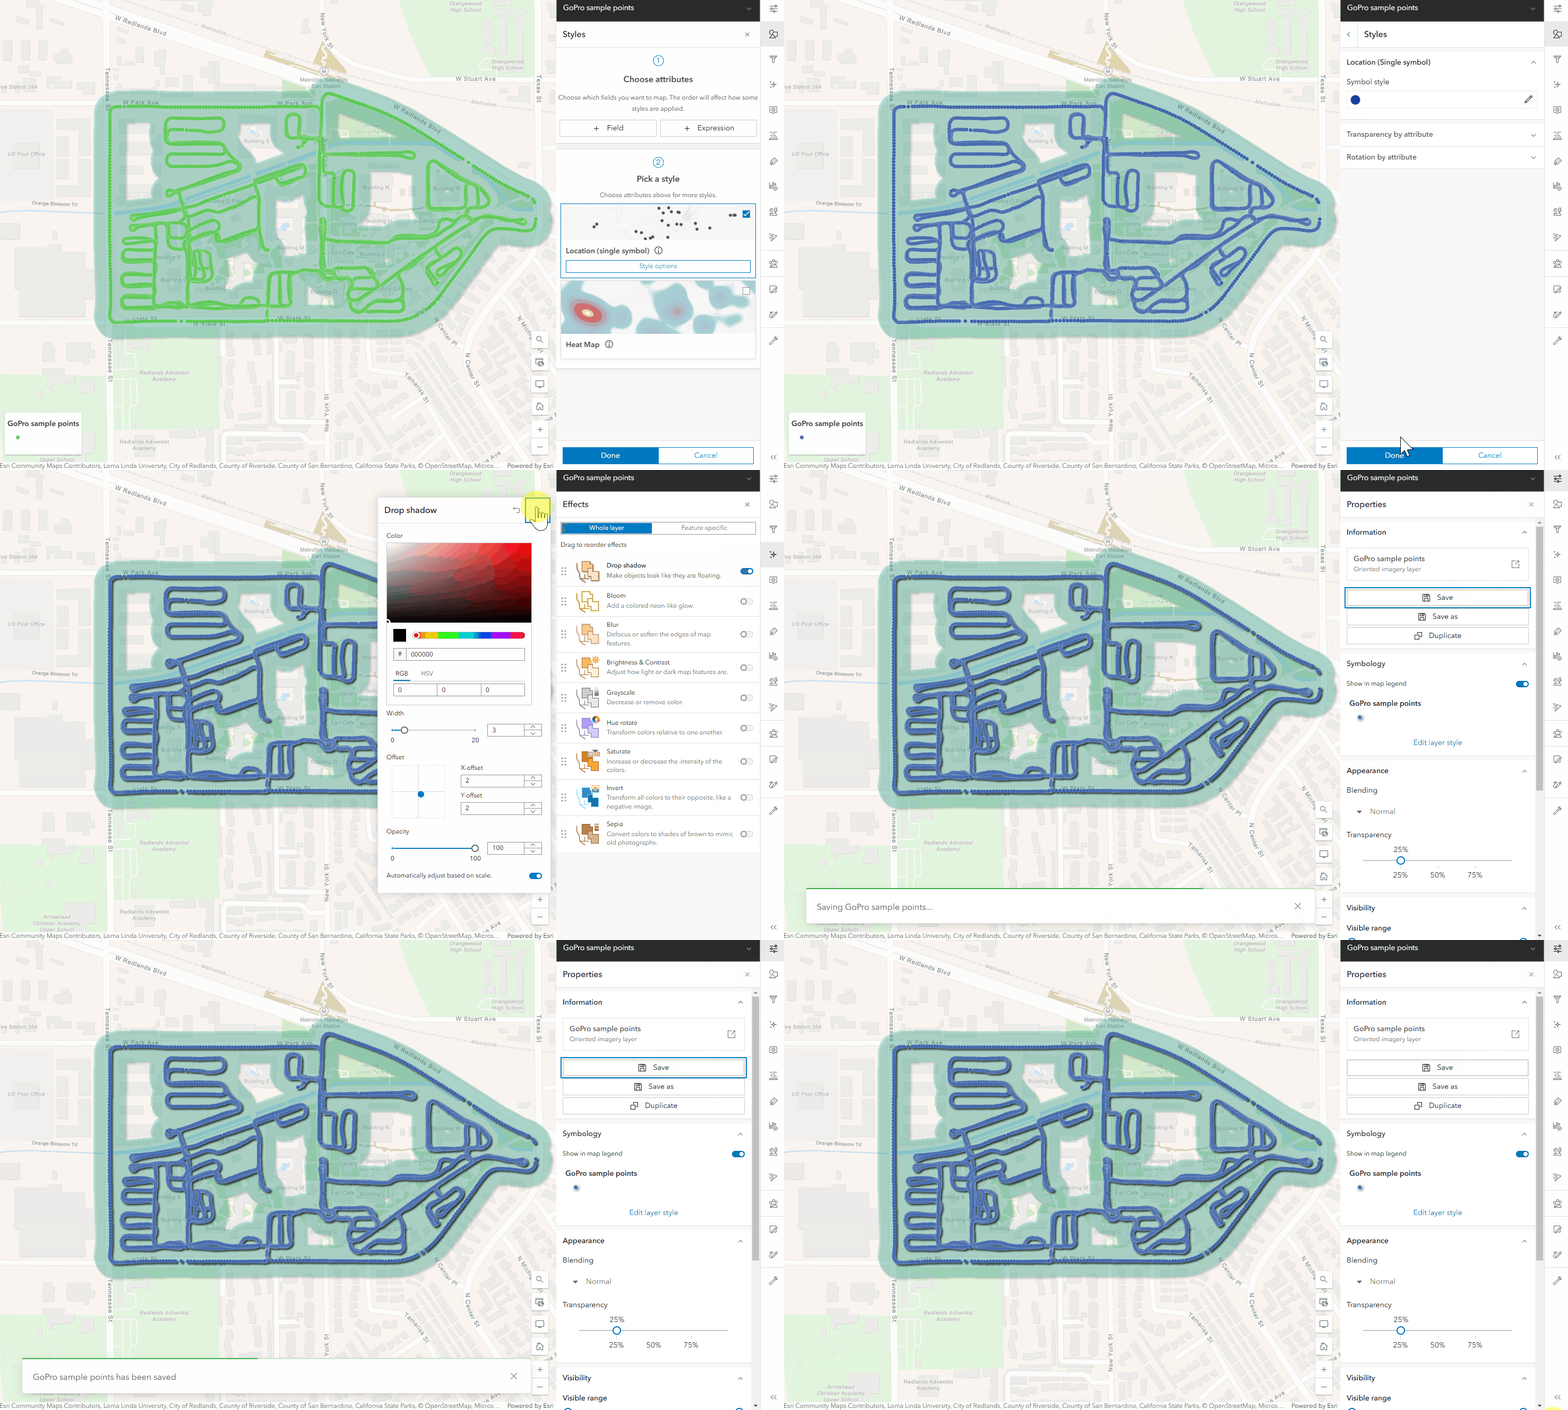
Oriented imagery items can now save all layer configurations back to the original item or to a new item in Map Viewer and on the Visualization tab. Duplication of Oriented imagery layers is another new enhancement that allows you to create copies of the original item in the map and modify the layer properties without changing the original item.
The oriented imagery viewer now supports projecting feature layers into your images, which can help with both the readability of your images and vector data.

Other updates
Take a look at some of the additional November 2024 updates in Map Viewer below.
As of November 2024, you can now save print exports as items in ArcGIS Online. This is particularly helpful to share with other users. You can additionally specify a different spatial reference output when printing the map.
Introducing the ability to browse for custom layout template items without configuring an organizational print setting. Users with Professional and Professional Plus licenses can now browse for layout templates (beta).
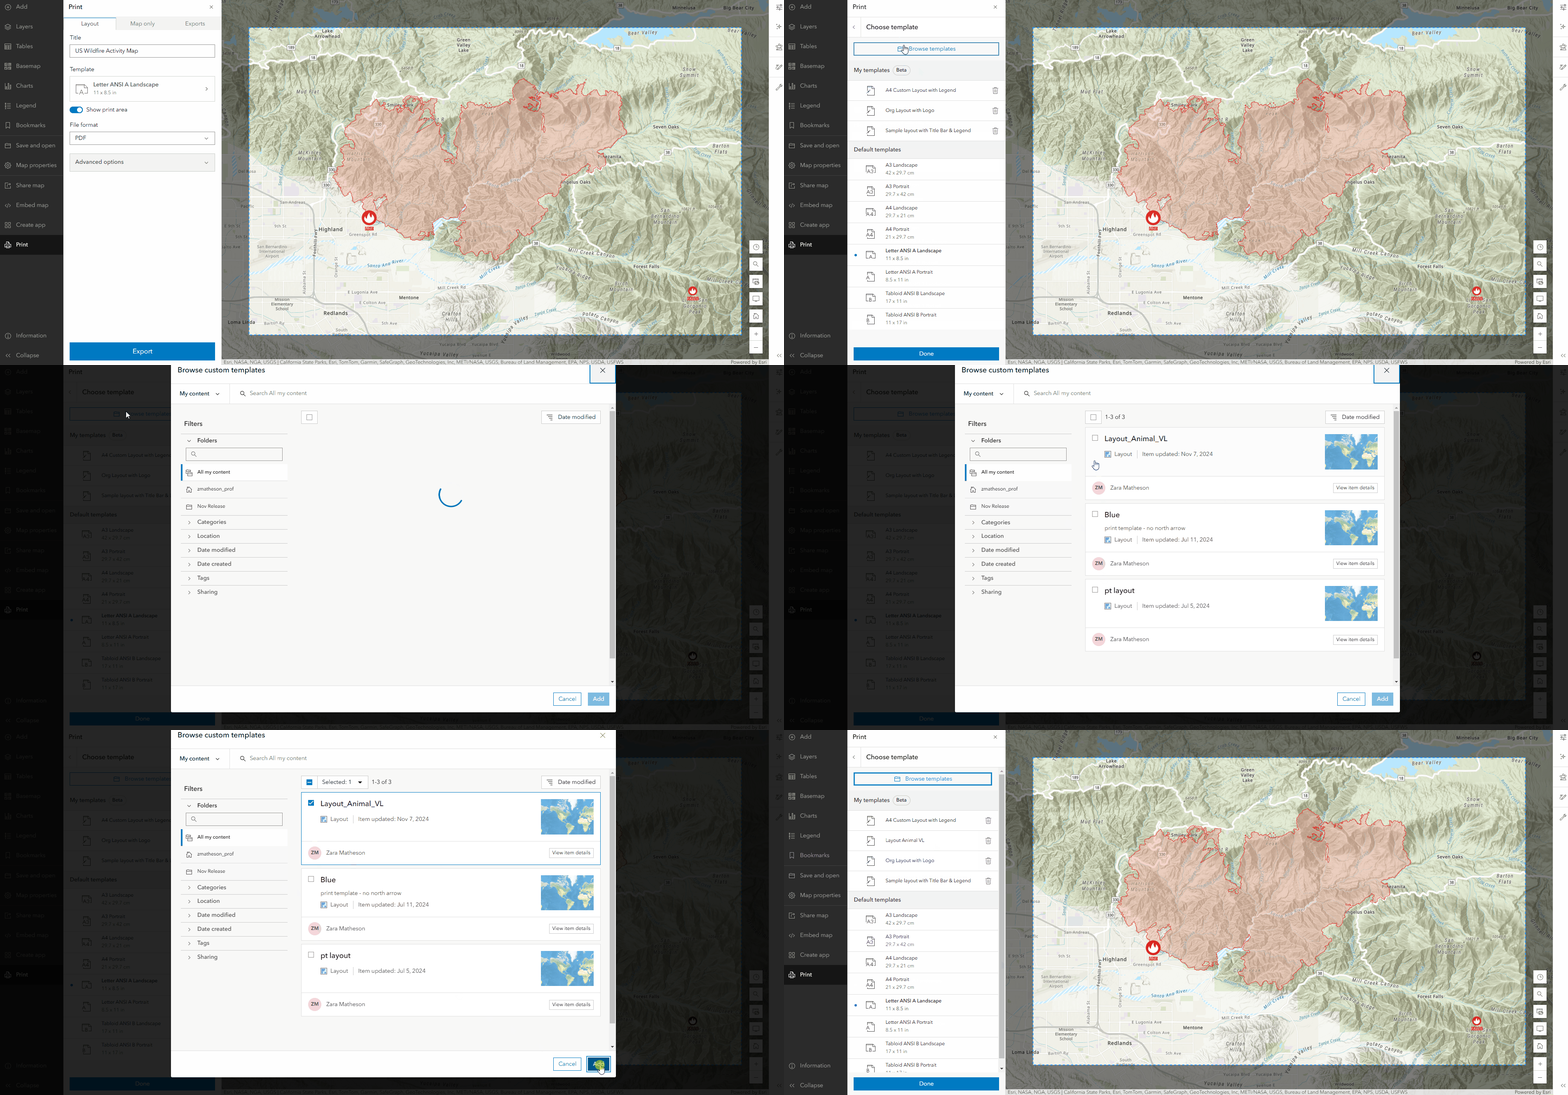
To learn more, see What’s new in Printing from Map Viewer.
Time
Tired of having your time settings disappear when other content is expanded or open? Now stacked neatly on top of any open tabs, time settings are accessible until dismissed. If you do want to temporarily hide the settings, simply click the Time button in the bottom right navigation tools.
Indoors Positioning Support
Prior to the November 2024 update of Map Viewer, creating a map with Indoors Positions Service (IPS) capabilities would have required you to configure and publish the web map from ArcGIS Pro. Now, users with IPS licensing can easily pull in IPS layers into Map Viewer and configure the settings under Map properties.
Arcade
Arcade is now available for labeling CSV, WFS, and GeoJSON layers in Map Viewer. You can additionally access the $layer and $map profile variables when authoring pop-ups for these layers.
Subtype group layer
As of the November 2024 update, related records in Map Viewer support Subtype group layer sublayers. You can additionally now open the table for Subtype group layer sublayers.

More resources
To learn more, stay up to date on the latest enhancements, or ask a question, review the resources below:


Commenting is not enabled for this article.