This year at the 2024 User Conference, many individuals expressed an interest in being able to do more with Arcade and non-feature layer items. Well, you asked, and we listened! With the latest update of ArcGIS Online, we are excited to announce that we have improved Arcade support for CSV, GeoJSON, and WFS layers. In addition to the Visualization profile (where there was already support for these layers), these layer types are now fully supported within the context of the Arcade Popup and Labeling profiles. Let’s dive into what this support entails before providing some examples of how you can take advantage of this new functionality during the map authoring experience.
Adding and working with CSV, GeoJSON, and WFS layers
There are multiple ways to create and work with CSV, GeoJSON, and WFS layers in Map Viewer. All three of these layer types can be added directly to your web map using a URL, or via file upload (GeoJSON and CSV only). Additionally, a WFS layer can be created from a pre-existing feature layer you own using the Publish option on the layer’s item details page.
If a GeoJSON layer already exists in your organization, you can also add it directly to the map using the browse layers workflow. After opening the browse experience in Map Viewer, click the Refine content option and apply a filter where the item type is ‘GeoJSON’.
Once you’ve added your layer(s) to the map, it’s time to start writing some Arcade.
Labeling profile support
Arcade’s labeling profile is used to dynamically label features within your map. Now, when you open the Label pane in Map Viewer with a CSV, GeoJSON, or WFS layer as your active layer, you will see the option to label the feature with an Arcade expression. When authoring your expression, you’ll only have access to attributes for that feature. Like the Visualization profile, FeatureSets and their functions are not supported in the Labeling profile for performance reasons.
An example
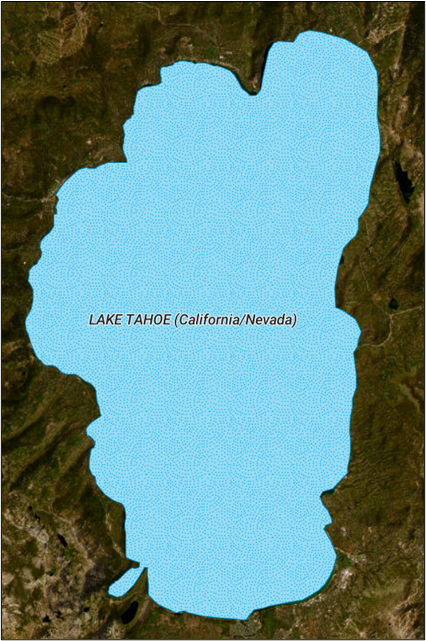
Let’s say you’ve just found a WFS layer that indicates lakes in and around California that would be perfect for your map. In the map, you want to label each lake to show the name and the relevant state(s) where it is located. Fortunately, there are fields that contain this information. Unfortunately, the attribute values aren’t formatted as you’d like to display them in the label. That’s where Arcade comes in.
In the expression below, the name of the lake has been capitalized with the Upper() function to ensure it’s prominence in the label. Then, the Decode() function is used to map the various attribute state codes to more easily understood strings.
// Get the name and state fields from the layer
var name = Upper($feature.NAME);
var state = $feature.STATE;

// Get the relevant text string according to attribute value
state = Decode(
  state,
  "CA", "California",
  "CA-OR", "California/Oregon",
  "AZ-CA", "California/Arizona",
  "CA-NV", "California/Nevada",
  "AZ-CA-NV", "California/Arizona/Nevada",
  "AZ", "Arizona",
  "State unknown"
);

// Return formatted fields in the feature's label
return `${name}(${state})`
After saving the expression, the feature labels will look like this.

This is just one example of the myriad ways Arcade can be used to label features. Other possibilities include returning multi-line labels with a template literal, or performing on the fly conversions (e.g., °F ↔ °C) and mathematical calculations.
Popup profile support
Authoring both attribute expressions and Arcade content elements is now fully supported for CSV, GeoJSON, and WFS layer pop-ups in Map Viewer. Prior to this update, Arcade expressions could only be authored on CSV and GeoJSON layers, and available profile variables were limited to $feature. Now that we’ve added support for additional profile variables ($layer, $map, $userInput) and FeatureSet functions, you can go even further with your layer pop-ups.
Attribute expressions
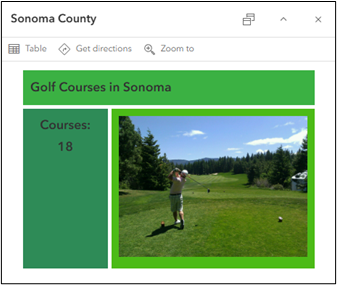
The ability to use other $map and FeatureSet functions in your pop-ups makes it incredibly easy to determine spatial relationships between different map layers. In the example below, we have a map with two distinct WFS layers that contain counties and golf courses in the state of California. With just one Arcade expression (and some HTML for formatting) we can create a dynamic rich text element in the county layer pop-up that displays the number of golf courses in each county.
// Get featureset of all golf courses in the state
var golf = FeatureSetById($map, "193033f7032-layer-7", ["NAME"]);

// find golf courses that intersect the county and determine count
var int_golf = Intersects(golf, $feature);
var cnt_golf = Count(int_golf);

// return value in pop-up
return cnt_golf

Content element
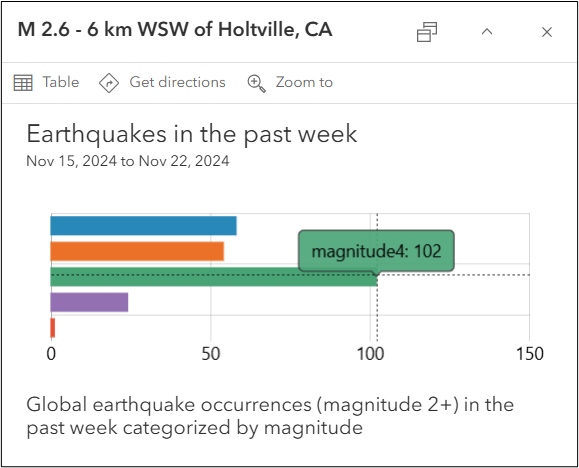
An Arcade content element is another way to dynamic create charts, rich text, or fields lists in your pop-up. In this example, we have a map that contains a GeoJSON layer added via URL. This layer updates daily to show global earthquakes occurrences in the past week that have a recorded magnitude of 2 or more. Within the content element, the $layer profile variable is used alongside the GroupBy() function to group the number of earthquakes by their magnitude. After the count of earthquakes within each magnitude range are determined, these values are passed into the attributes dictionary for the chart element. Finally, text and a dynamic date range is added to the chart description to provide additional context for consumers of the pop-up.
// get all quakes in the layer
var quakes = $layer;

// group the earthquakes by magnitude and determine count
var stats = GroupBy(
  quakes,
  [{ name: "mag", expression: "FLOOR(mag)" }],
  { name: "num_quakes", expression: "1", statistic: "count" }
);

var attributes = {};
var fields = [];

// populate dictionary and array with the magnitude level and earthquake count to use as chart attributes
for (var group in stats) {
  var fieldName = `magnitude${group.mag}`;
  attributes[fieldName] = group.num_quakes;
  Push(fields, fieldName);
}

// get date range of earthquake observations to return in chart
var start_date = Text(DateOnly(Min(quakes, "time")), "MMM D, Y");
var end_date = Text(DateOnly(Max(quakes, "time")), "MMM D, Y");

// return chart element in pop-up
return {
  type: "media",
  title: "Earthquakes in the past week",
  description: `${start_date} to ${end_date}`,
  attributes,
  mediaInfos: [
    {
      type: "barchart",
      title:
        "Global earthquake occurrences (magnitude 2+) in the past week categorized by magnitude",
      altText:
        "A bar chart indicating the number of earthquakes with a magnitude of 2 or greater that have occurred globally in the past week categorized by magnitude.",
      value: { fields }
    }
  ]
};
Once the expression is saved, the pop-up for the GeoJSON layer will look like this (see below). Because the expression returns an entire element in your pop-up, rather than a single value, using a content element can reduce the need to write multiple attribute expressions for your layer. If we were to build out this same chart using the chart pop-up element instead, several attribute expressions would need to be authored to achieve a similar result.

What’s next?
We hope you are excited about the enhanced Arcade functionality in labels and pop-ups we’ve introduced for CSV, GeoJSON, and WFS layers in ArcGIS Online. Keep an eye out for more Arcade support on other layer types in future updates.
Do you have any suggestions on how we can continue to improve Arcade? Let us know on Esri Community!

Article Discussion: