The recently enhanced Drought Aware App in ArcGIS Living Atlas has been released. This upgraded version now integrates information from additional data layers such as population, housing, river flow, reservoirs, crops, and agricultural labor, providing comprehensive insights about the impact of droughts in the United States.
App Categories
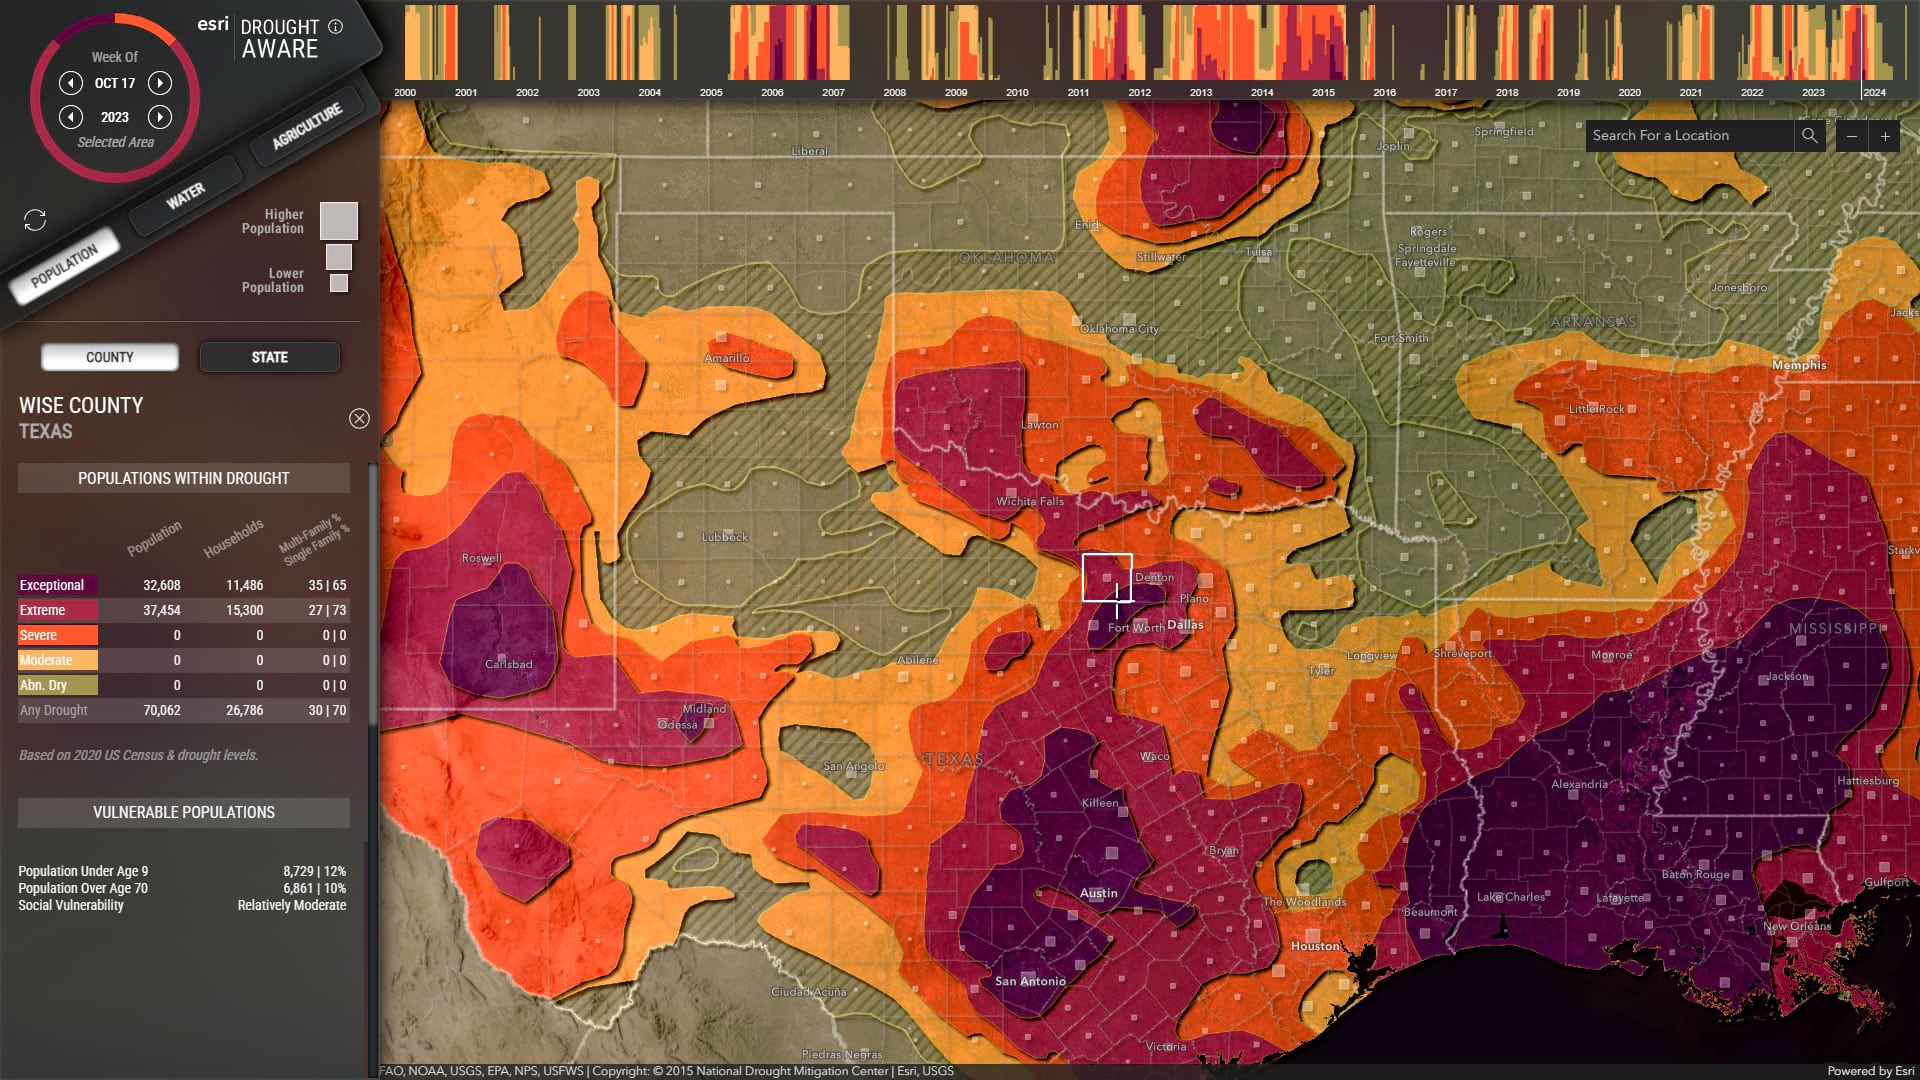
The Drought Aware app summarizes information in three main categories:
- Population: displays the estimated people and households affected by drought at each intensity level, describes some of the vulnerable populations, and lists the related drought risk indexes. The data is available at County and State levels.
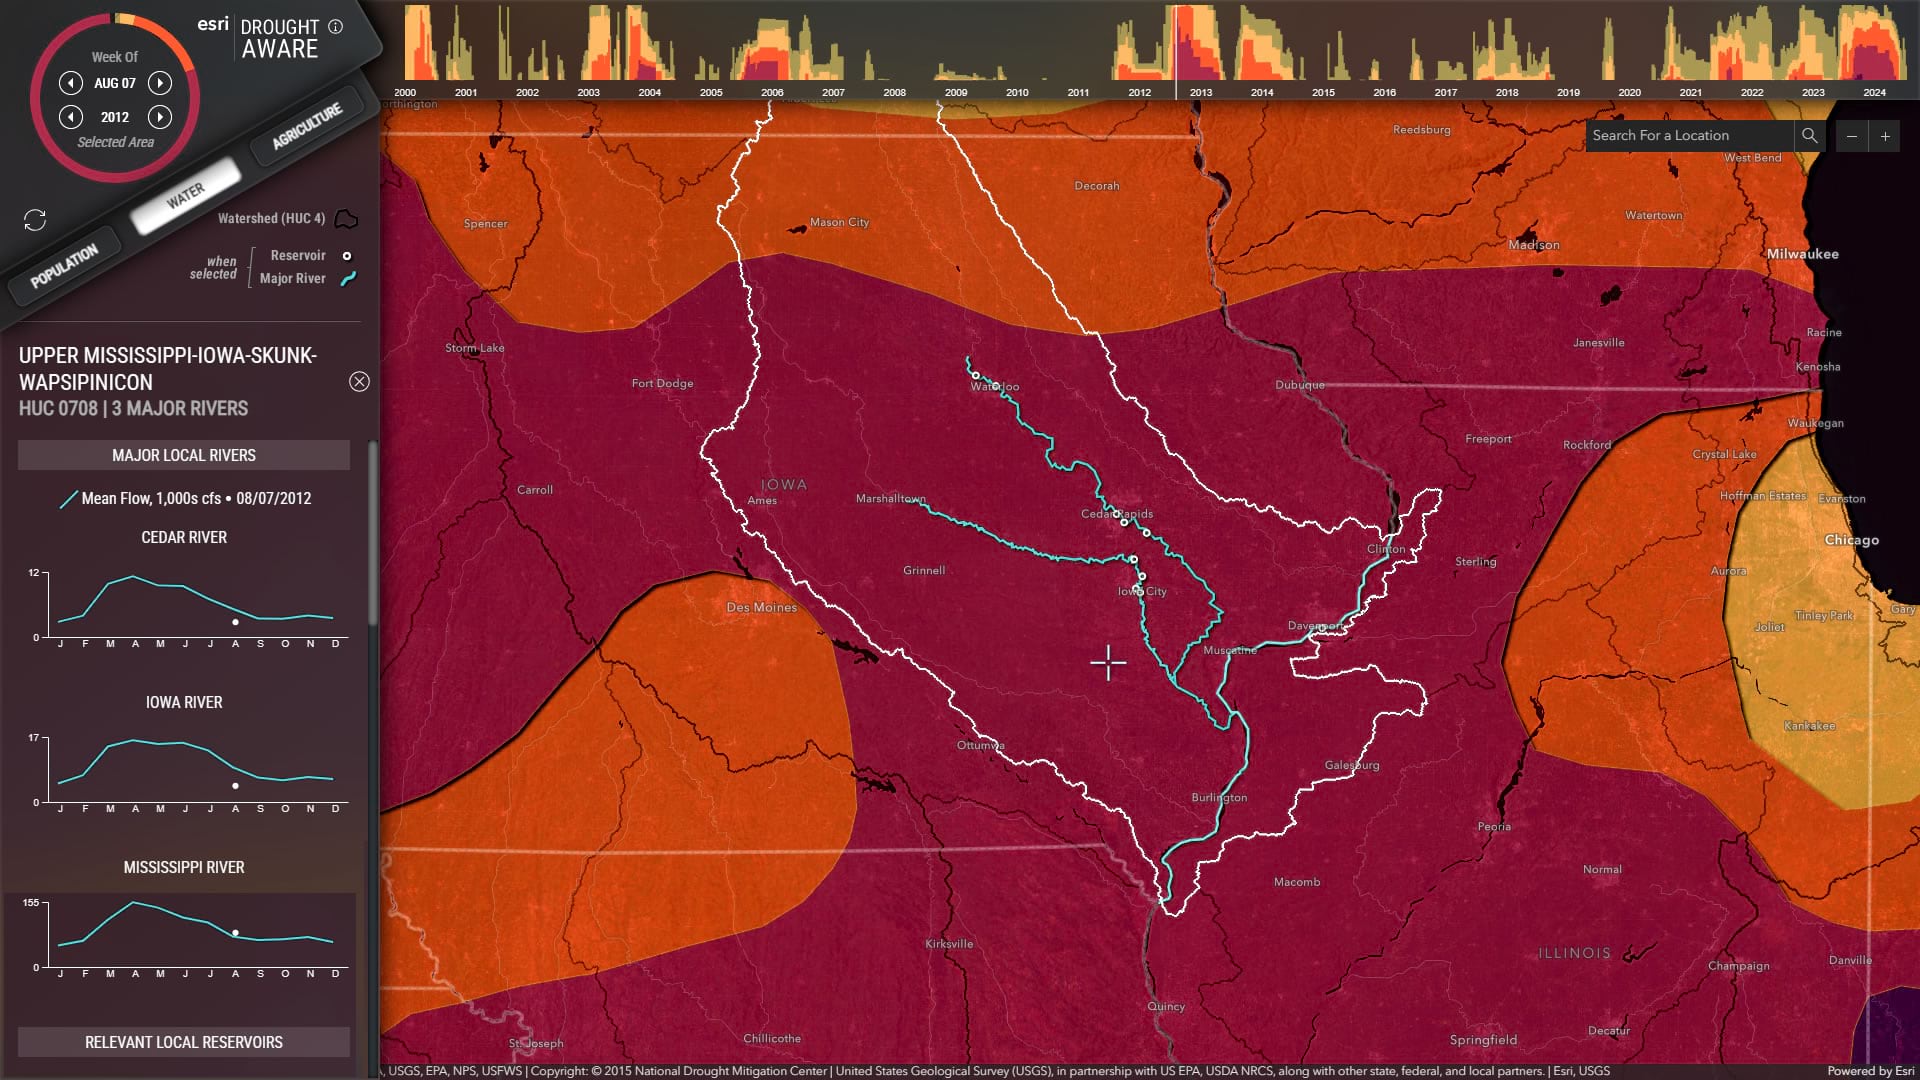
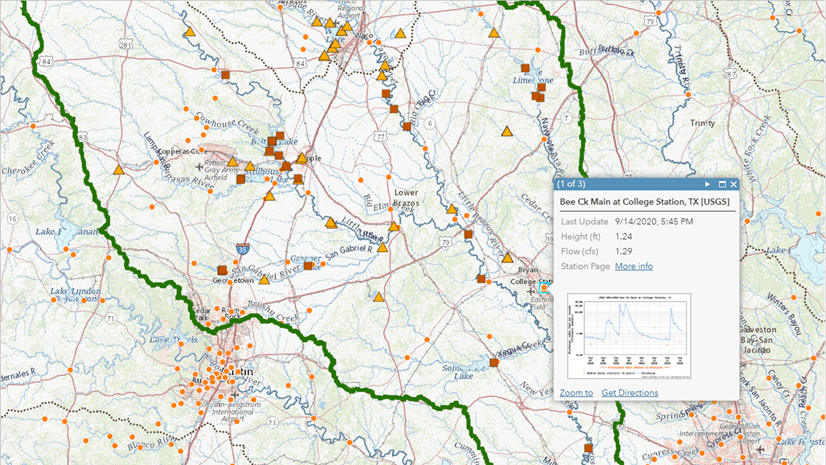
- Water: depicts the major local rivers, the average inter-annual river flow, and the relevant local reservoirs. The data is available at the Subregion Hydrologic Units (HUC4).
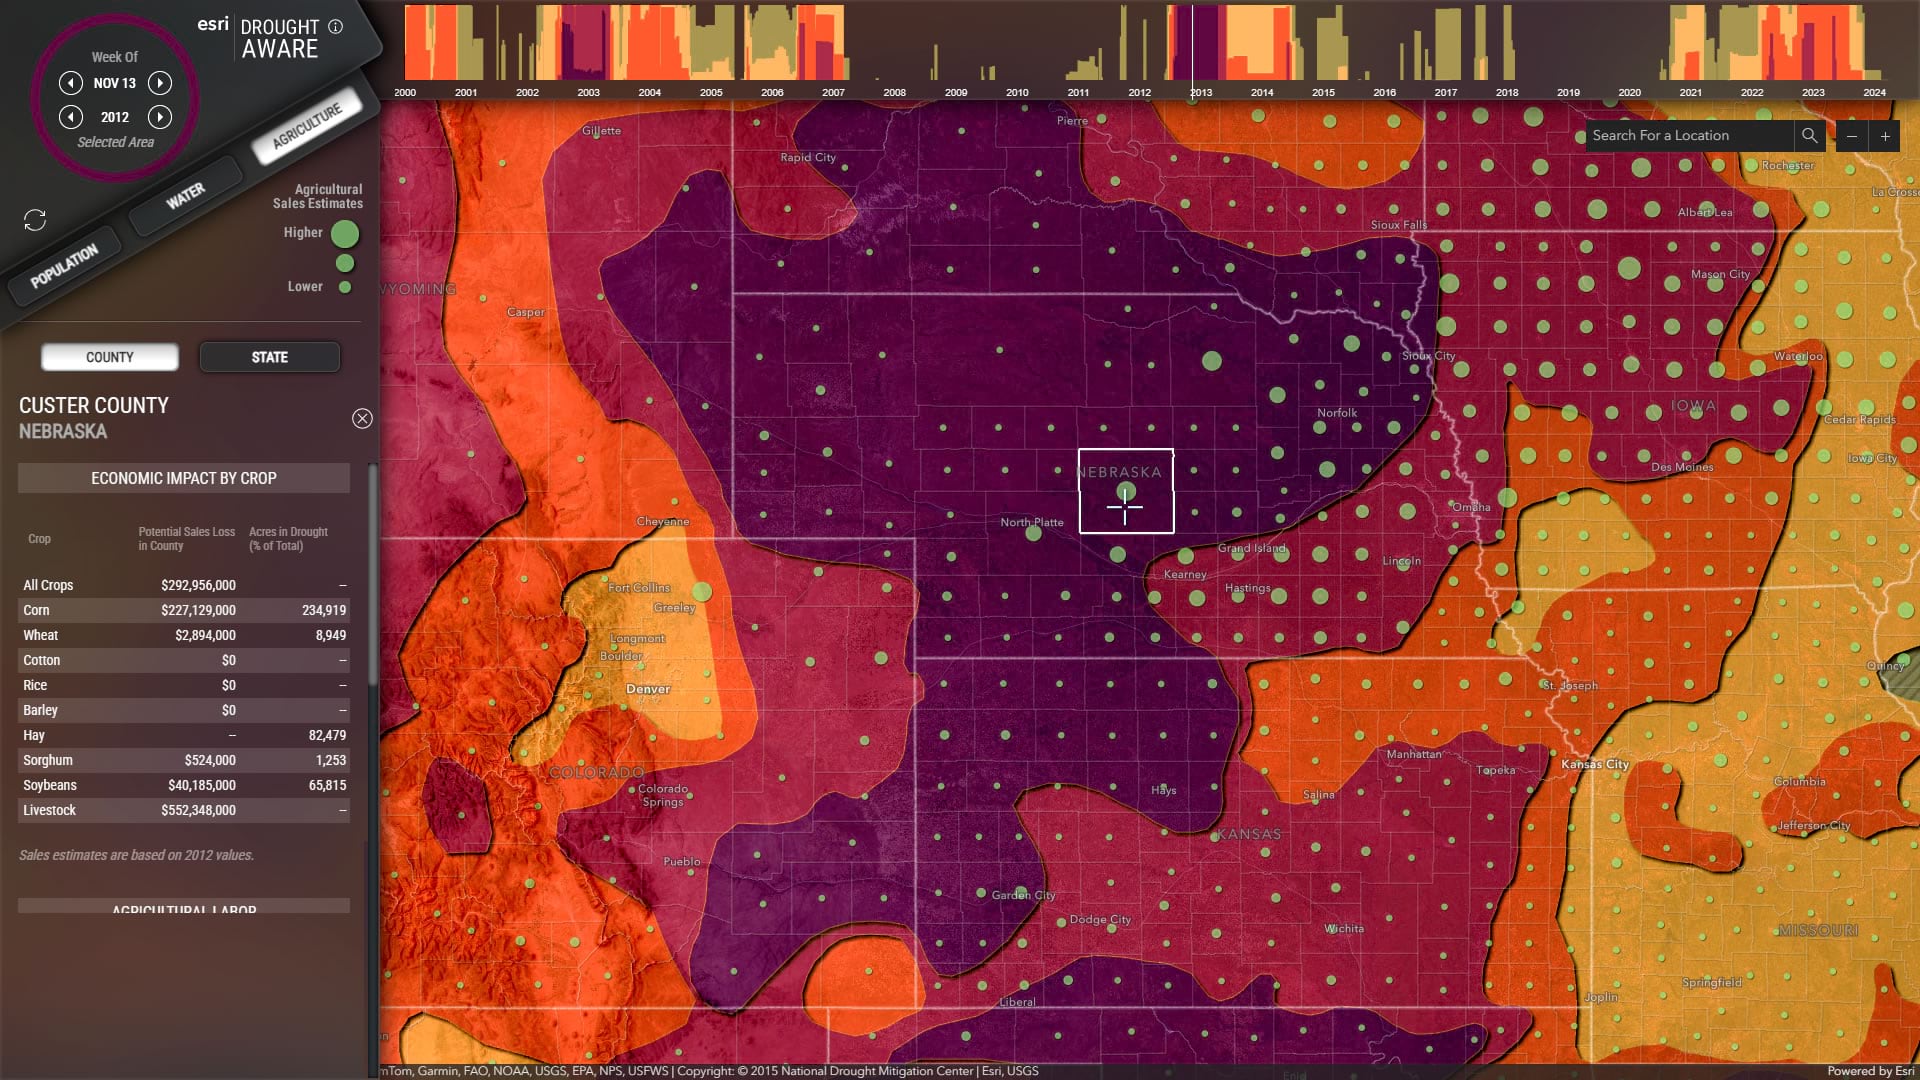
- Agriculture: shows the potential economic impact by major crop, the affected labor, and the agricultural exposure to droughts. The data is available at County and State levels.
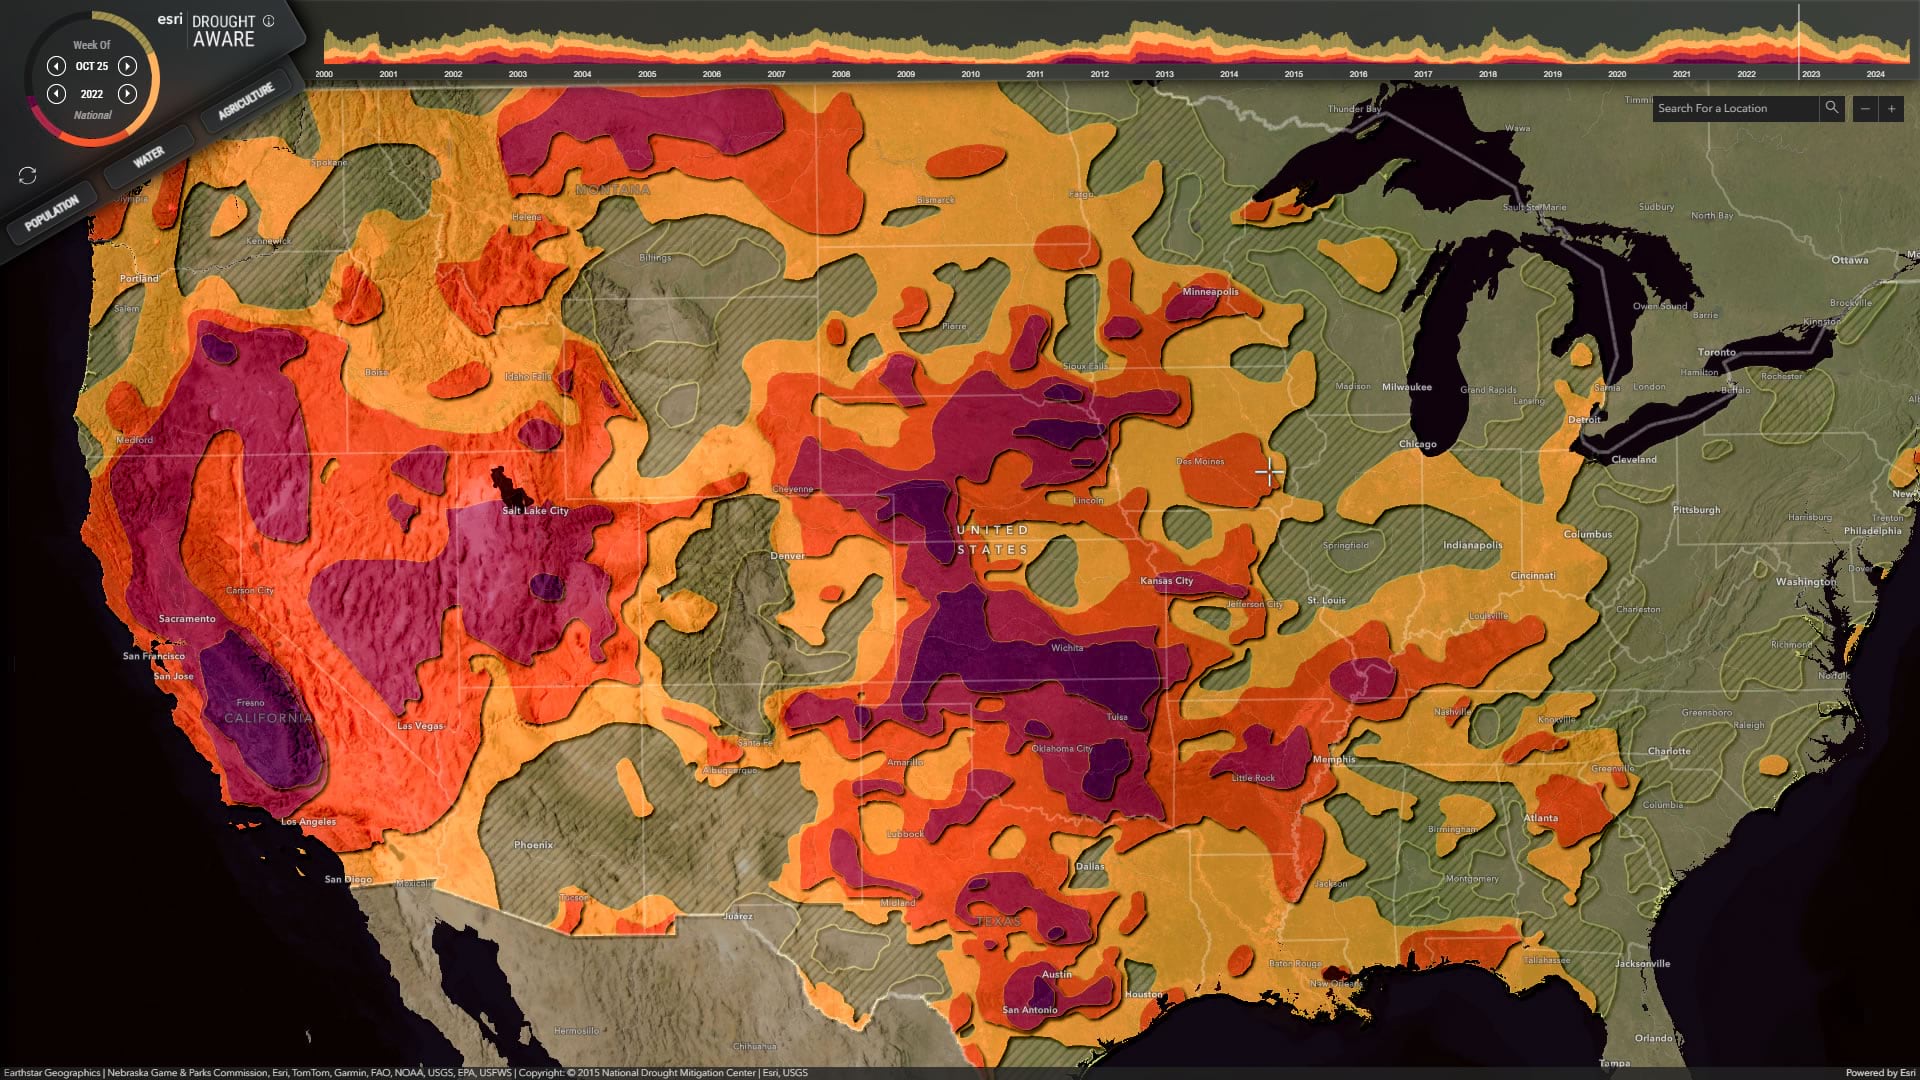
Drought Through Time and Place
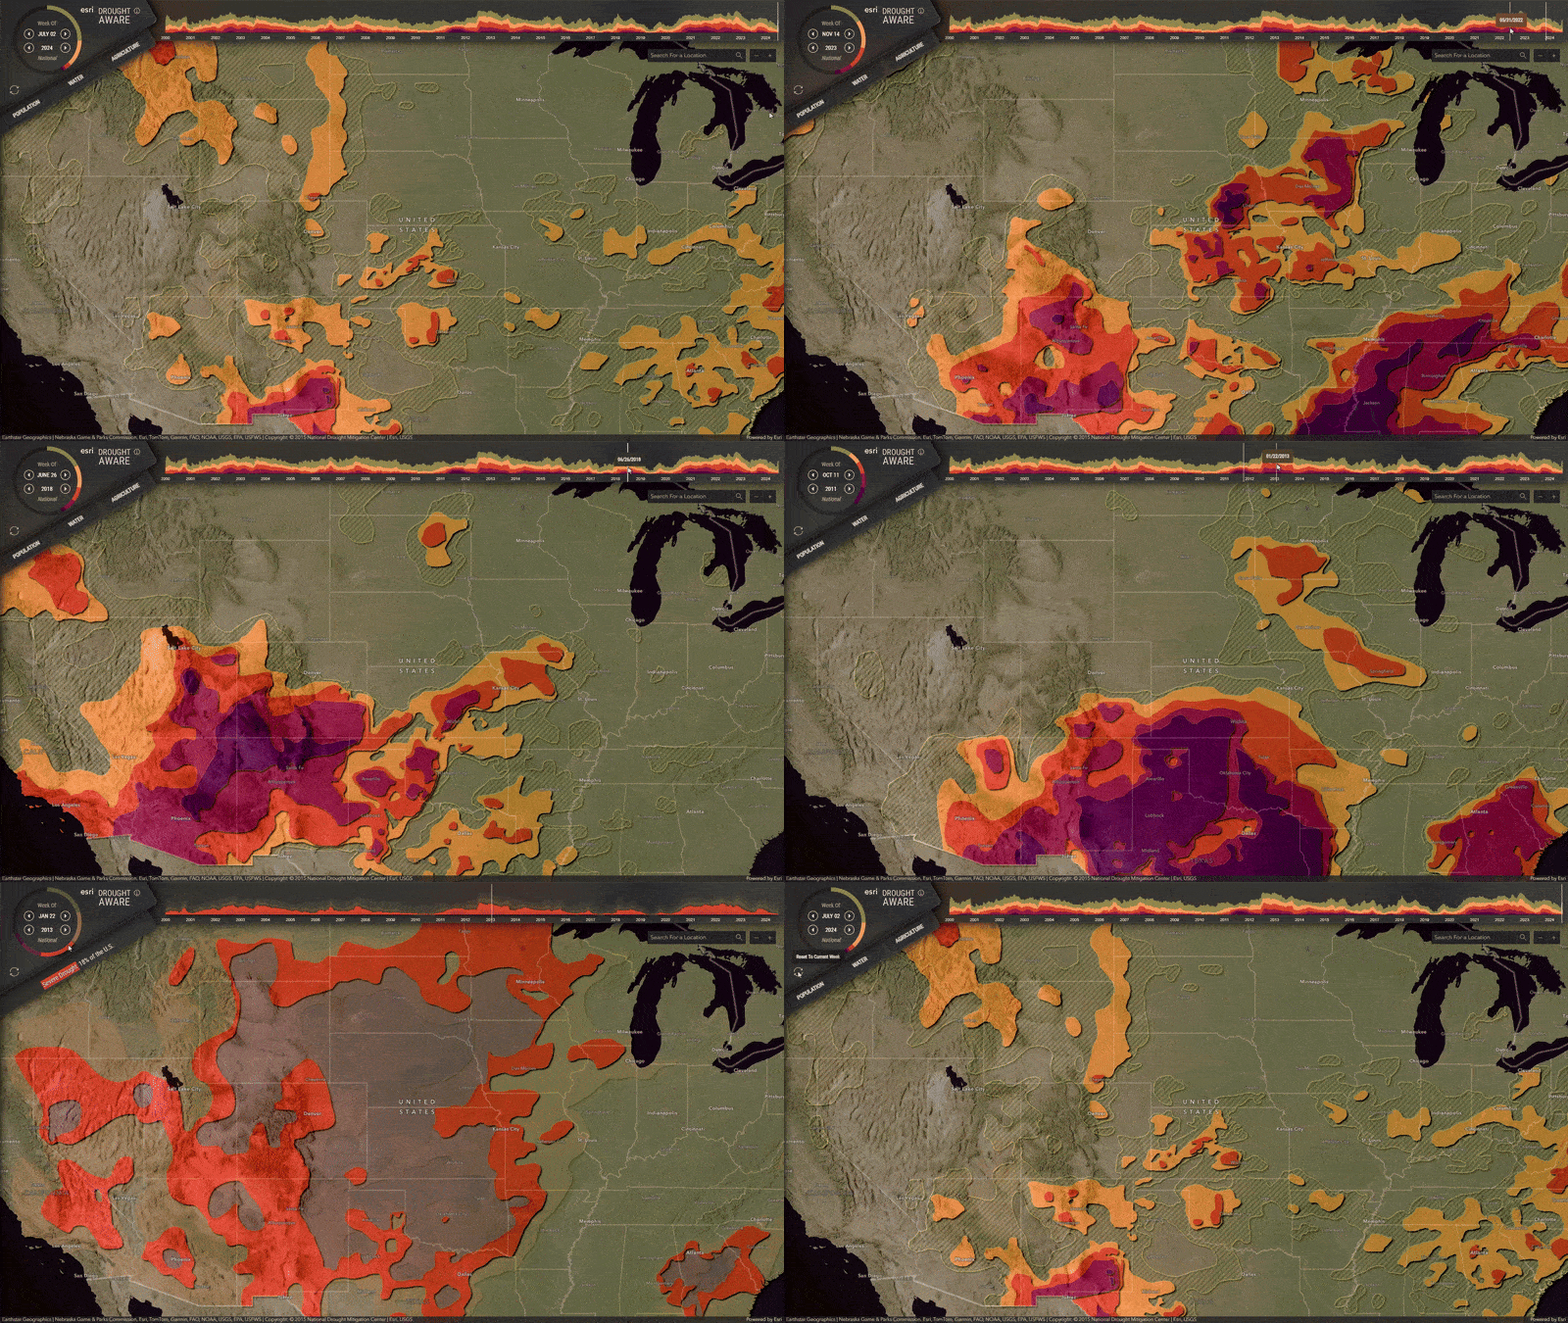
There are many ways to explore the phenomenon of drought in this app. The topmost timeline shows categories of drought severity, since the year 2000, as a proportion of the overall land of the United States. Choose any point in time to see that week’s geographic ranges of drought. The sector chart in the top left provides a detailed breakout of the proportion of the nation experiencing drought at that time. Mouse over any portion of the chart to see its corresponding geography.
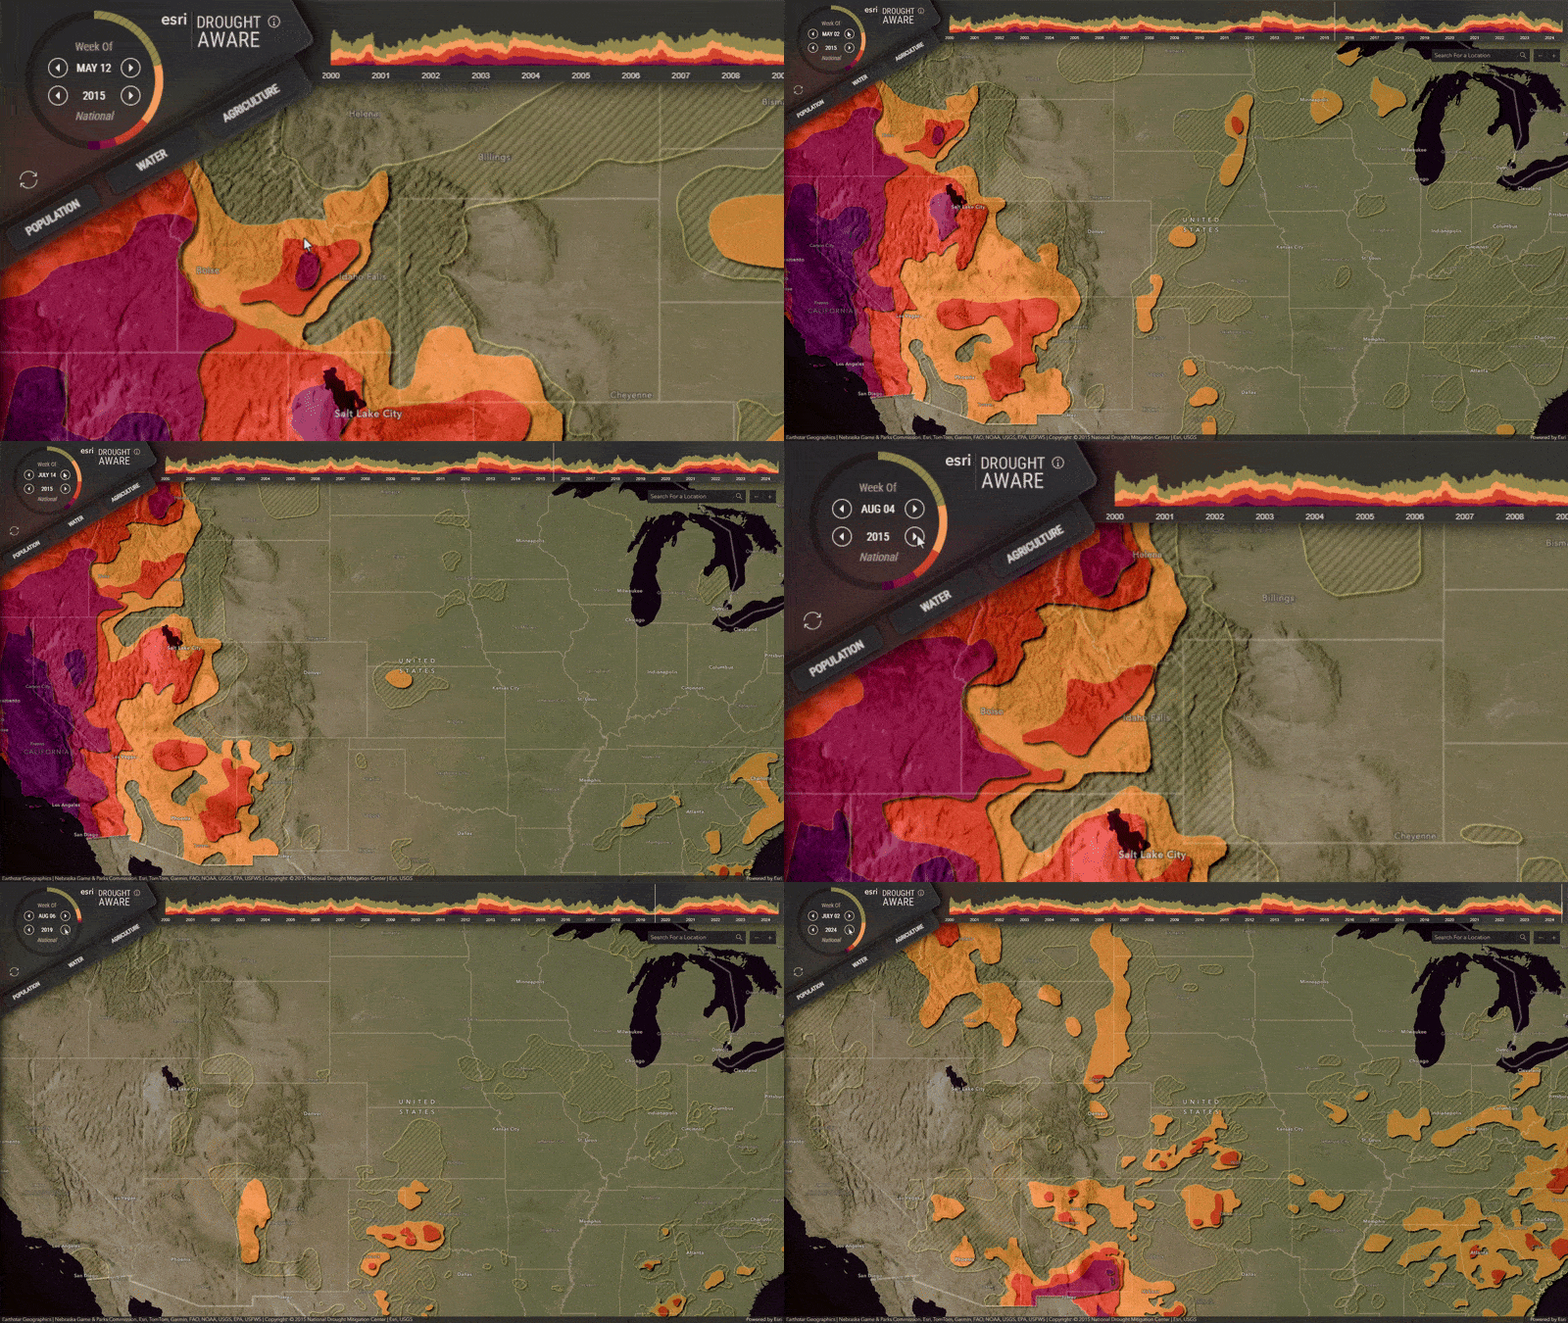
Step through time using the week and year buttons. You can progress chronologically week-by-week or get a comparative sense for drought by stepping through years.
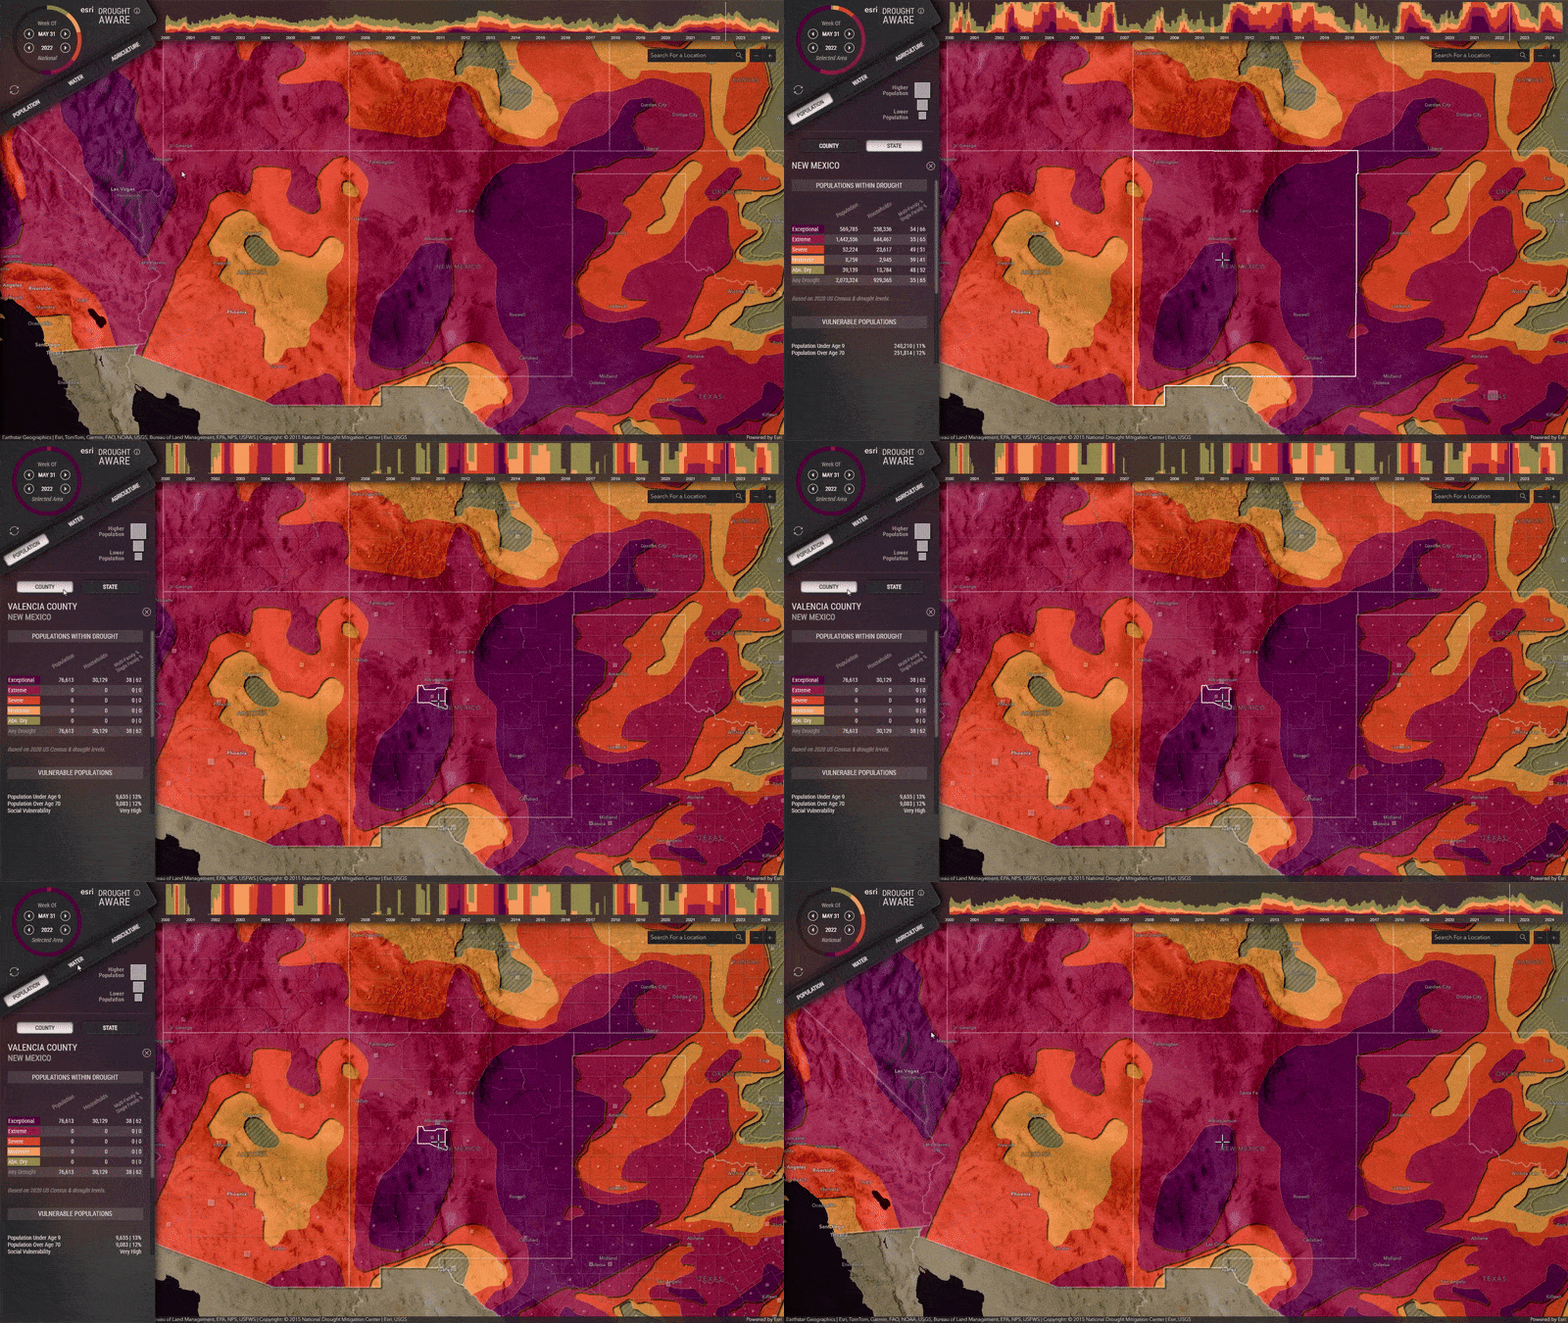
When no location is selected, the timeline and sector proportional charts represent the extent of drought for the full area of the United States. When a state, county, or watershed are selected, they update to represent that more specific area.
Data Sources
The data layers used in this app can be found in Living Atlas:
- U.S. Drought Monitor
- American Community Survey (ACS)
- USDA Census of Agriculture
- FEMA National Risk Index
- National Water Model (NWM)
- National Hydrography Dataset (NHD)
- National Inventory of Dams (NID)
- National Boundary Dataset (WBD)
Keeping up to Date
The data behind the app is updated every week after a U.S. Drought Monitor map is released. The process is automated using a live feed routine that access, process, and updates the information. The population, water, and agriculture summaries in Drought Aware are calculated by the live feed routine using the U.S. Drought Monitor maps and the data sources layers in Living Atlas. The Live Feeds methodology and tools are available in the Live Feeds Community Group.
Summary
The Drought Aware App in Living Atlas provides information about areas in the United States affected by drought across different time intervals and over multiple drought intensities. The app shows summaries about the affected population and the potential impacts to crops, agricultural labor, rivers, and reservoirs. The Drought Aware App and its underlying layers are available in Living Atlas.
More Information?
Interested Living Atlas? Visit the Living Atlas Esri Community and ask questions to our experts.

Article Discussion: