The December 2023 Broadband Data Collection (BDC) is now available within ArcGIS Living Atlas. This ready-to-use layer shows fixed broadband availability for every Census Block and H3 Resolution-8 hexagonal area in the U.S. and outlying territories. The layer summarizes the December 2023 BDC data showing the number of served, underserved, and unserved Broadband Serviceable Locations (BSLs) by transmission technology in a given geography. It is a composite of six sublayers – State, County, Tract, Block Group, Block, and H3 Resolution-8 hexagons – each with a related table listing all Internet Service Provider (ISP) offerings by technology and speed tier.
About the BDC
The BDC is a combination of two datasets:
- Broadband Serviceable Location (BSL) Fabric. This is a dataset of all locations in the United States and Territories “where fixed broadband internet is or could be installed.” It was developed by CostQuest in consultation with the FCC and is updated twice a year.
- Broadband Availability. This shows what broadband services are available at locations included in the Fabric. It is reported by Internet Service Provides (ISPs) to the FCC every six (6) months
This layer shows the number of Broadband Serviceable Locations (BSLs) in a given geography by their corresponding speed tier for December 2023. Version four of the Fabric is the base of the current map. The speed tier is defined by speed and latency and each BSL is bucketed into one of three categories:
- Served – low-latency Fiber, Cable, Copper, or Licensed Terrestrial Fixed Wireless offering of speeds greater than or equal to 100/20 Mbps.
- Underserved – low-latency Fiber, Cable, Copper, or Terrestrial Licensed Fixed Wireless offering of speeds less than 100/20 Mbps, but greater than or equal to 25/3 Mbps.
- Unserved – all service that is not low-latency or less than 25/3 Mbps, and all Geostationary Satellite, Non-geostationary Satellite, Unlicensed Terrestrial Fixed Wireless, and Other.
For more information about the Broadband Data Collection in ArcGIS Living Atlas of the World, please see this blog article which describes the significance of the data and its origins.
Layer Enhancements and Changes
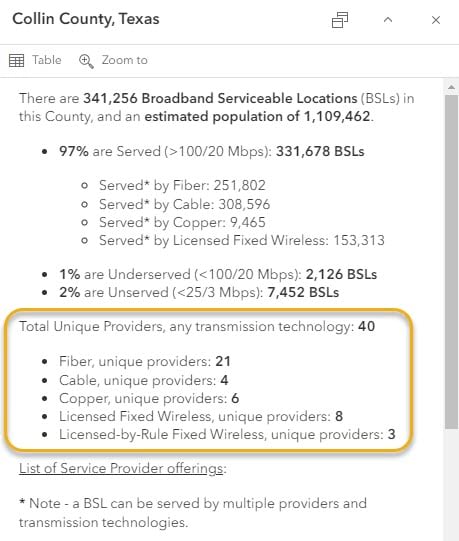
New with this update are the unique provider counts by transmission technology for the H3 Resolution 8 hexagons, Census Blocks, Block Groups, Tracts, Counties, and States. This statistic provides a summary count of unique providers, by geography, for All technologies, as well as the specific technologies of Fiber, Cable, Copper, Licensed Fixed Wireless, and Licensed-by-Rule Fixed Wireless.
The following pop-up shows an example of the unique provider counts by transmission technology. The pop-up also lists the specific providers, by technology, and the number of BSLs passed.
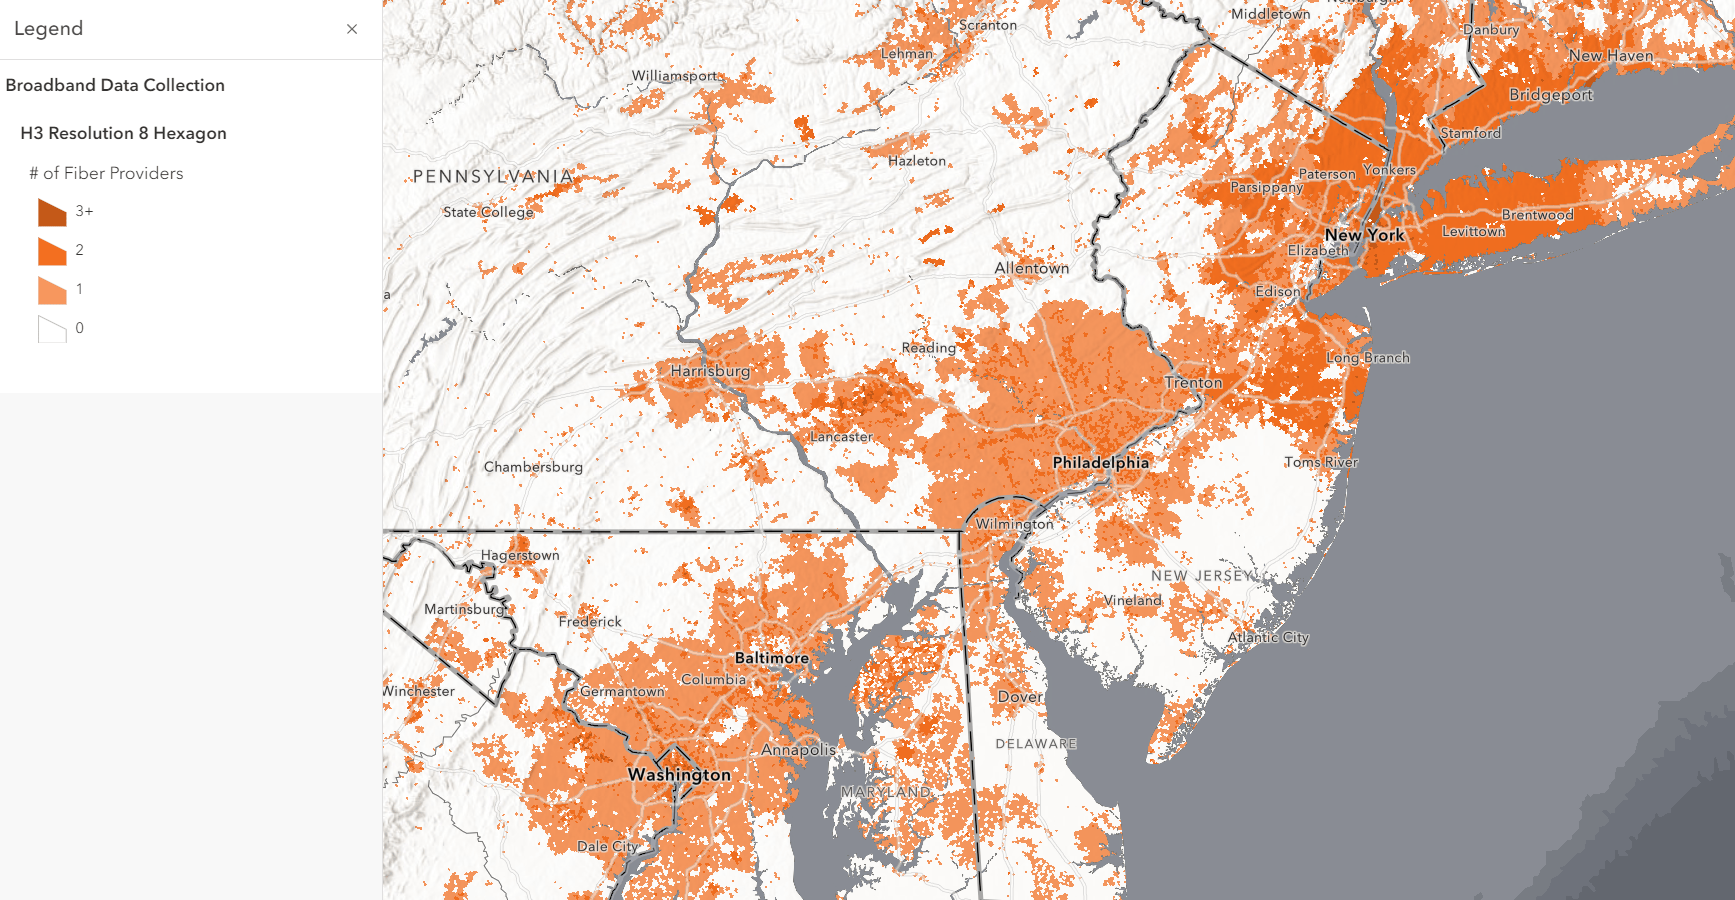
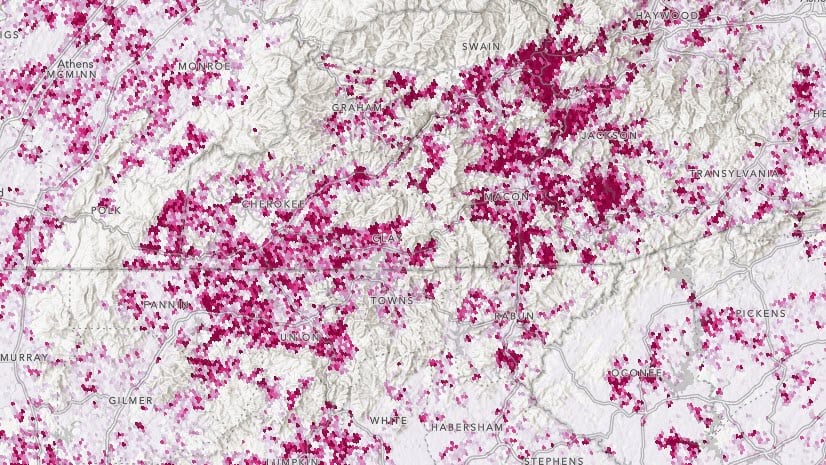
Unique provider counts can help understand market competitiveness and provide additional insight into the broadband landscape. In the map below, we see the number of fiber providers by H3 Resolution 8 Hexagon. While having three or more broadband providers in a community can be a characteristic of healthy competition – with resulting lower prices, faster speeds, and overall better service – overbuild also has several disadvantages. Overbuild refers to the deployment of redundant fiber-optic infrastructure in a given area. As broadband service providers overbuild each other, they will have to assume lower penetration rates, lower returns, inefficiency, increased maintenance costs, and wasted resources.
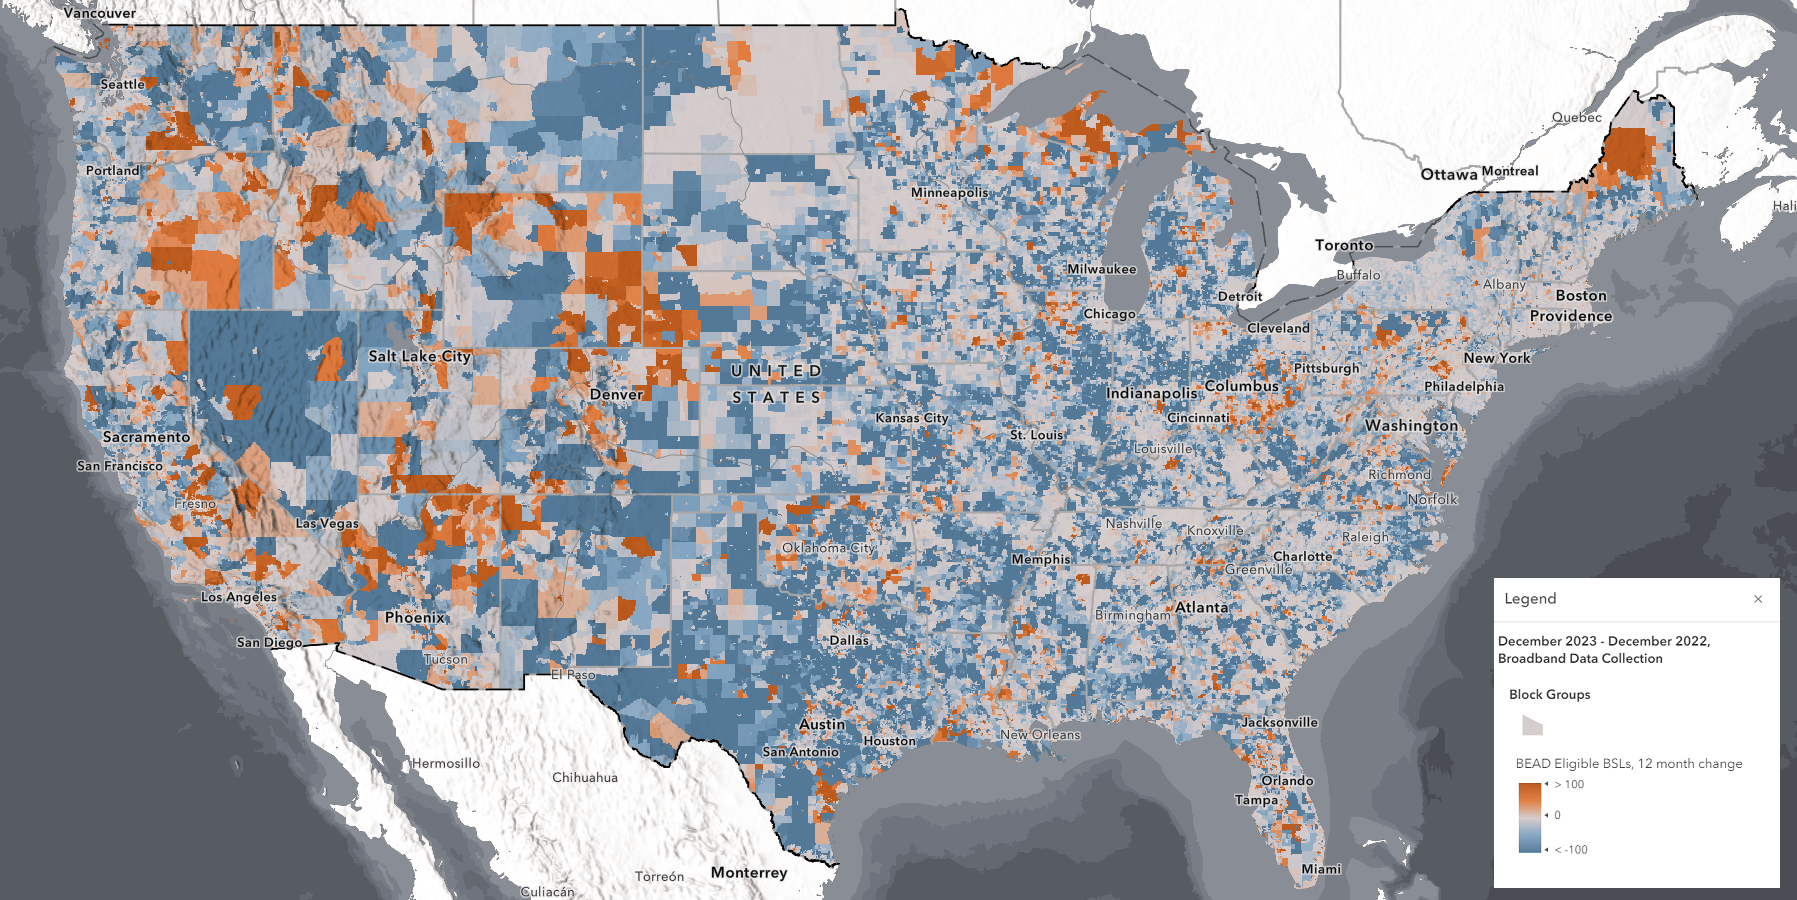
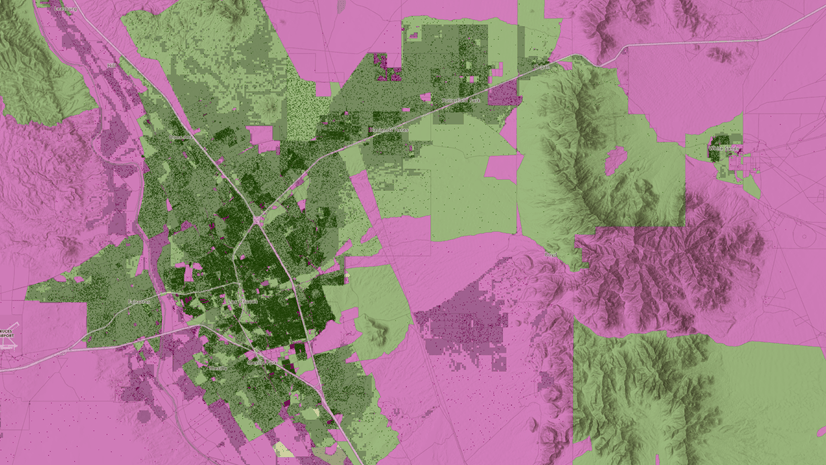
As with previous versions of the layer, the default symbology shows the number of BEAD eligible locations. A BSL is eligible for BEAD funding if it is unserved or underserved. The map below shows the change in the number of BEAD eligible locations from the December 2022 BDC release to the December 2023 release.
You can investigate all of the changes for the three most recent BDC releases with this interactive web map of US counties.
More information on how the layer can be used by communities, communications service providers, and others, to improve broadband connectivity, can be found on the Esri Telecom Community. This blog article describes how to create transmission technology footprints, and this blog article describes how to create provider footprints.
We look forward to seeing how you use these new fields and encourage you to share your work and your thoughts with us. We plan to continue maintaining the layer and making improvements. And would love to hear what enhancements you would like to see. You can share your thoughts with me at pryan@esri.com.
Happy Broadband Mapping!!!


Article Discussion: