Parks departments support a broad range of activities, facilities, and experiences for the communities they serve. As someone who once nurtured the growth of Special Park District programs, I’ve seen first-hand the difference an informed tree inventory can make and the critical necessity of equitable shade. One of today’s key challenges many Park agencies face is the equity of tree distribution in each park. A part of this issue is the percentage of paved and landscaped areas. Depending on development practices, both past and present, there can be gaps in access to trees and, as a result – shade. In this post, we’ll discuss some of the challenges in tree distribution and a simple approach to park equity using GIS for tree inventory, which is such a big undertaking.
Parks are more than just patches of green. Forested urban parks help keep neighborhoods cool. As a park enthusiast, they’re assets for our cities, places of refuge for our minds, and arenas for community vitality. But access to these spaces is not a privilege that’s been distributed fairly. Park equity stands at the forefront of a movement to correct this imbalance, ensuring every community can breathe freely, play safely, and flourish fully.
Understanding Park Equity
Park equity is not just about having parks—but about having fair access to quality green spaces regardless of race, income, or zip code. It’s a compassionate acknowledgment of historical oversight and a commitment to fixing the imbalance.
We can see where to make investments using a geographic approach to equity and social justice. My experience as a GIS supervisor for a Special Park District involved supporting rigorous mapping of tree distributions—a vital component of park equity. Forested urban parks provide shade and are essential in cooling neighborhoods, fostering biodiversity, and nurturing community wellness.
The Tree Inventory Challenge
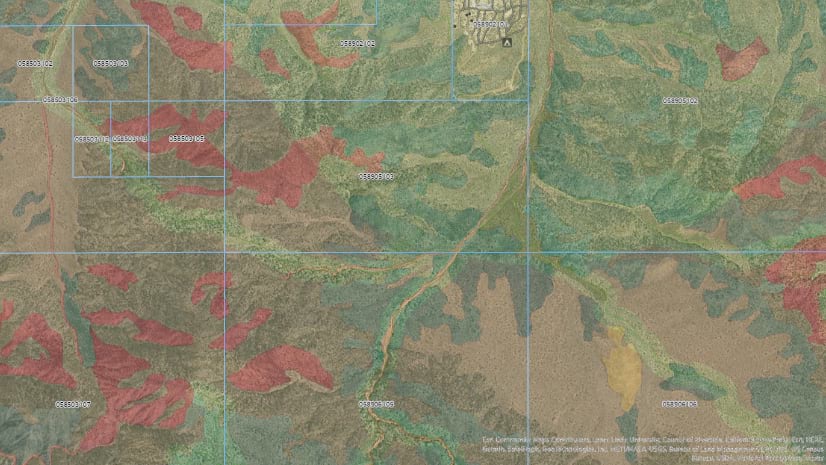
Remember, historical investments in tree planting didn’t embrace the whole community—some areas relished a lush canopy while others sweltered without one. Our task is straightforward: map our tree inventory, identify areas that need more trees, and create an actionable plan. For now, we do not need fancy LiDAR; just a tree inventory layer and ArcGIS Online to get us started.
When I supported the urban forester in maintaining our tree inventory, the program collected basic tree information (species and age) and extensive maintenance history maintained in GIS. There were many factors that played into decision-making for long-range planning efforts, like Capital Improvement Plans. There were a couple of considerations in classifying the types of areas within the parks, like forested, landscaped, or grassy. Understanding forested areas vs. landscaped parks helps identify heat-prone areas, which helps with tree planting plans within the landscaped areas to know where to plant new trees. Having a mapped inventory of the trees within every park’s landscaped or manicured areas with streamline the identification process of where new investments could be made to course correct from past strategies.
Grassy areas vs. forested areas
Another consideration was understanding the ratio of grass to paved surfaces; more paved areas can lead to more heat. Grass, if well maintained, assists with cooling but can also present some challenges. Grass is a resource-intensive asset to maintain. Depending on the species, new trees need regular up-front watering, but grass requires regular mowing and watering. This adds to the overall maintenance costs for parks. If a park is mostly grass with little to no tree canopy, this creates a poor park experience for people on a hot day. By leveraging the tree inventory overlaid on mapped grassy areas, a park planner now has the data to evaluate if a given park has a good density of trees, providing cooling and shade.
We can also be met with other uncontrollable challenges—funding shortfalls. For example, as a park’s GIS supervisor during COVID, we needed to decrease watering grass to save the maintenance program’s vital budget. To avoid an allocation mishap, we needed to know what areas would be impacted by this change. So, we partnered with park maintenance to show them the mapped grass areas of each park and displayed which ones would not be watered for the summer of 2020. Implementing an equitable lens, we ensured no single community was totally cut off from grassy fields for the summer months.
Another aspect to consider is using Living Atlas for relevant socio-economic data to understand the community profile and who will access and use the park. This allows the park agency to make cultural considerations, perform appropriate outreach, and address community-specific needs.
Let’s wrap up!
In conclusion, having a basic tree inventory as points that are visualized on a map can transform a Park agency’s approach to managing its urban forest. Park planners can leverage GIS to address historical inequities in past planning approaches and ensure data-driven decisions are made for long-term shade equity success. If you’re interested in a more streamlined approach to inventories of public trees and understanding tree conditions, check out the Tree Management Solution demo video.


Article Discussion: