During my time as a map librarian in higher education, I spent a lot of my time talking about ArcGIS StoryMaps. The visual appeal of text, images, and maps dancing in step with each other at the touch of a finger was immediately captivating, and I was compelled to share their efficacy in communicating complex concepts to my community of students, faculty, and colleagues.
In 2019, two of my former colleagues and I put our heads together to create Pancakes & Silver: Historical Map Reading, Data Extraction, and 3D Visualization, a story about a significant lode of silver ore discovered in Virginia City, Nevada, in 1859. It became a case study of dynamically using scanned map collections for research and an opening demonstration for the StoryMaps workshops I began to provide.

It didn’t take long for our community to share in my captivation with StoryMaps, and we were soon answering many questions from a wide range of disciplines on how to craft their stories best. But with this came one recurring hurdle: georeferencing historical maps.

Unlocking scanned historical maps
The learning curve for georeferencing historical maps is on the steeper side, especially for those unfamiliar with GIS concepts and tools (the majority). Additionally, many of the proposed story ideas from our community didn’t require georeferencing beyond the desire to simply pan around a scanned, high-resolution image of the original map. Simply put, the collective wanted interactivity options for images similar to what we had for web maps.
February 22, 2023: the day the world changed. Okay, maybe that’s an overstatement, but it was the day media layers were announced as a new function in ArcGIS Online. This opened the doors for us to craft interactive experiences with scanned maps in our stories easily!

Now on Esri’s StoryMaps team, I continue to support the higher education community, and figuring out approachable, interactive ways to learn about maps, map collections, and GIS remains an interest. Another interest is roping my former colleague, Stanford Geospatial Center’s (SGC) Geospatial Reference and Instruction Specialist, David Medeiros, into projects.
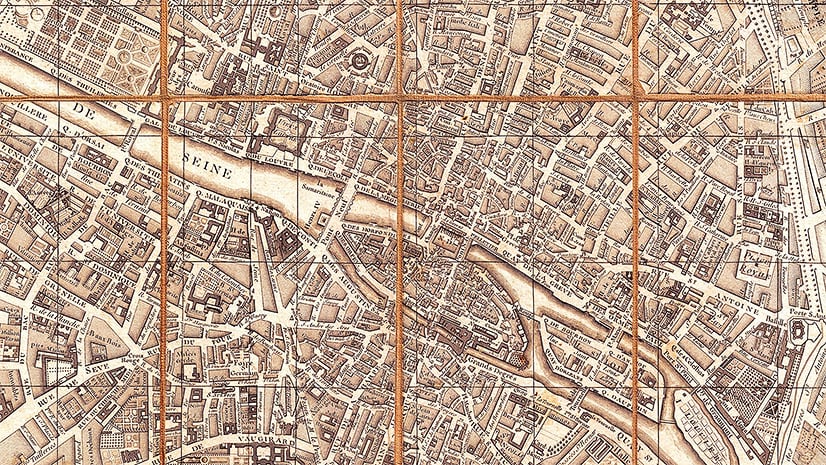
Wanting to utilize the new media layers function in a story, David and I identified that the topic of water development in California’s San Joaquin Valley would have instructional value for students. We outlined a story that returned to the Pancakes & Silver model of being part story, part instructional, and part demonstration. Naturally, we also returned to David Rumsey’s historical map collection (David donated his collection to Stanford in 2009).

The resulting new story, A spatial inquiry case study: Water development in the San Joaquin Valley, applied three technologies that we believe are significant to using historical maps in research and StoryMaps:

Machines Reading Maps
The stars aligned in 2023 for scanned historical maps: in addition to Esri’s new media layers function, David Rumsey integrated the Machines Reading Maps (MRM) technology into his personal map collection website.
MRM revolutionizes (and that’s not an overstatement) the capability to discover maps to serve our needs. Historically, map collections could only be searched by the more general metadata assigned to any given map, such as title, location, author, publisher, year of publication, theme, etc. This method leaves out potentially thousands of discovery points when every little label on a map is considered. And with MRM, every little label is now considered.
As we began to craft our water development story, we wanted to find maps labeled with the San Joaquin River, so these were the keywords we used in our search:

Media layers
After exporting a copy of the high-resolution scan from David Rumsey’s site, we then added that image as a media layer to a web map in ArcGIS Online:
As a web map saved in our ArcGIS Online content, the historical map scan could be brought into the StoryMaps builder easily by adding a map via applicable media blocks. For this story, we used the sidecar immersive block because we wanted to choreograph a tour around the historical map with text that described certain close-up views of the map:
Our chosen historical map was rich in detail — too much detail to include in one story — so we identified four key points on the map that could summarize the story of water development in the San Joaquin Valley. We began by adding a view of a table that detailed the Central Valley Project (CVP), a significant water management project devised in 1933. From there, we navigated to three important dams featured on the historical map that further described the CVP’s purpose and function:
For a comprehensive walk-through of this workflow, read Map-based images & ArcGIS StoryMaps: A treasure trove of possibilities.

Media actions
As a cherry on top of these new functions from 2023, the StoryMaps team announced media actions in March 2024. An expansion of map actions, media actions allow storytellers to add interactivity to their story via a button that now supports not only maps but also images, videos, or embeds.
This new feature provided us with a great opportunity to enrich the tour of our historical map with an alternative view: current aerial imagery of the same location depicted on the map for comparison:
For a comprehensive walk-through of this workflow, read Supercharge your stories with media actions.
Closing thoughts
As map and GIS librarians, we found that creating a few sample stories — or case studies — was an excellent way to familiarize ourselves with how our collections could be used in StoryMaps. Those samples then served as demonstrations for our community in historical map discovery and analysis, data extraction, and place-based storytelling techniques.
Note: As of August 2024, you can now use images as your base layer using express maps in ArcGIS StoryMaps. Learn more about what’s new in ArcGIS StoryMaps (August 2024).

This is just the thing! Historical maps that allow action to describe your focus.