Managing stormwater infrastructure is about more than preventing flooding, it’s about treating water like the precious resource it is. Managing runoff is about acting as responsible stewards to ensure we convey water through our manmade infrastructure, and back into natural areas where it can begin the cycle once more. Throughout this journey, we must take care to manage both the quantity and quality of water as failing to do so will have long-term consequences for our health and safety.
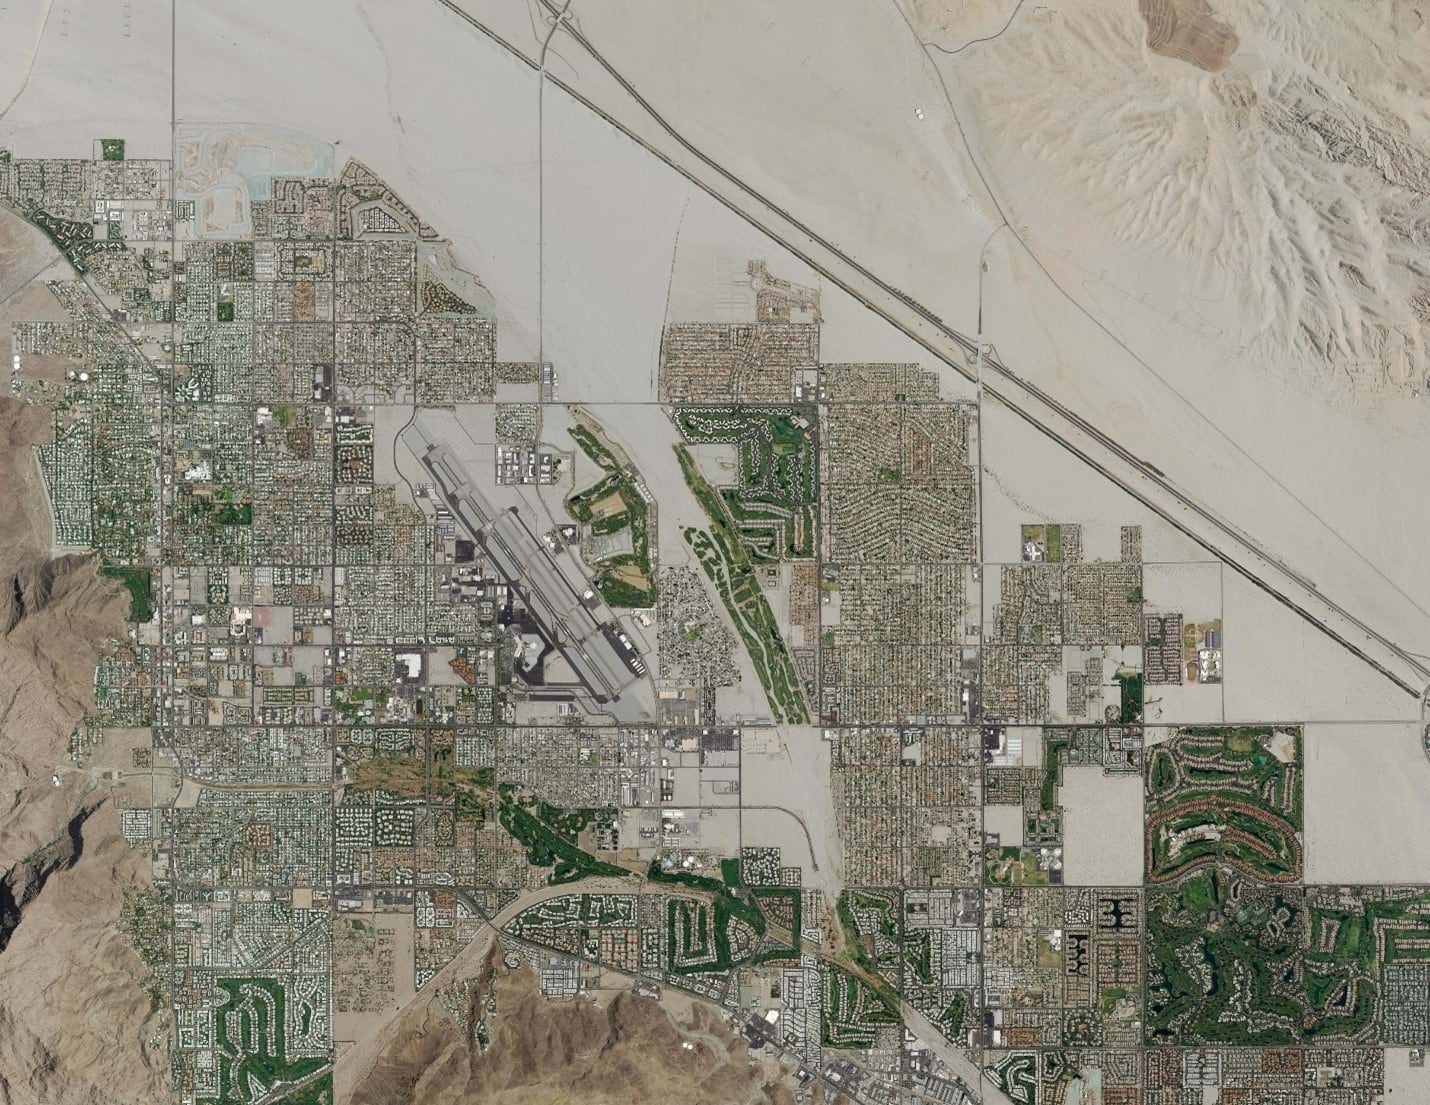
Dense urban areas face the greatest challenges since much of their surface is covered in impermeable materials that prevent rainwater from being absorbed naturally into the ground. In this article, you will learn how GIS and the ArcGIS Utility Network can be used to better manage these precious water resources. The model and data in this article is taken from the Stormwater Utility Network Foundation.
The first step to answering these questions is to have an accurate model of the natural and manmade infrastructure used to capture and manage stormwater. GIS has long been used to catalog our observations of the natural world, and with the introduction of ArcGIS Online and the ArcGIS Living Atlas this has made finding and sharing the data essential to natural resource management easier than ever before. But what about managing the human infrastructure?
If you are interested in learning more about how data is stored and managed using the utility network, I recommend you read the first article in this series in which we introduce the basic concepts and terminology you need to understand to model stormwater data using the utility network.
If you’ve already read that article, or are familiar with those concepts, we can then continue the discussion of modeling and terminology with an overview of how to model catchments and flow in the utility network. You will find many of the ideas and configurations discussed here reflected in the Stormwater Utility Network Foundation, but this article serves as a reference for why certain decisions were made, and why the system behaves the way it does. If you’re interested in more content link this, you should explore the Learn ArcGIS Utility Network for Sewer and Stormwater learning series.
Sources or Sinks
To an outside observer the process for calculating flow seems simple, we should assume that water starts at every inlet and flows as directly as possible to each outlet. While at a high level this is correct, we must also consider how to represent the effect gravity has on flow or how flow may change when the system experiences a high volume of runoff. Before we get too far into the weeds of these more advanced scenarios, we’ll start with the basics of how the utility network can be configured to represent flow in the stormwater model.
One of the first decisions made when creating a domain network in the utility network is whether the flow will be calculated using sources or sinks (you can’t use both). This decision is important because it determines whether you will need to track and manage flow by managing a known set of inputs (sources) or a known set of outputs (sinks) in your system. Because a stormwater system may have hundreds of inlets for every outlet (not to mention natural infiltration through pipes), it is more manageable to model the domain as a sink-based network.

To establish flow, all the outlets in the network must been registered as sinks within the network, this is known as enabling a feature to be a subnetwork controller. We will discuss subnetworks and subnetwork controllers a little later in this article. For now, all you need to know is that once you have established all your outlets as subnetwork controllers, downstream traces will identify the path to the nearest outlet, and upstream traces will identify all features that carry water flowing through the location being analyzed.

Now that we see how the system can calculate flow direction when performing upstream and downstream analysis, let’s look at how we can leverage this capability to model catchments and subcatchments by introducing a new concept from the utility network: the subnetwork. Much as a subcatchment represents a small, contiguous portion of a larger catchment, a subnetwork represents a connected, topologically distinct portion of your larger utility network.
In practice this is achieved by identifying all the outlets that receive runoff in an area of our network. This area is then turned into a subnetwork by configuring each of these outlets to act as subnetwork controllers for that subnetwork. Each subnetwork can have multiple controllers, so if your catchment or subcatchment has multiple outlets, each one can still act as a controller, they would just need to be configured to have the same subnetwork name (e.g. catchment or subcatchment name).
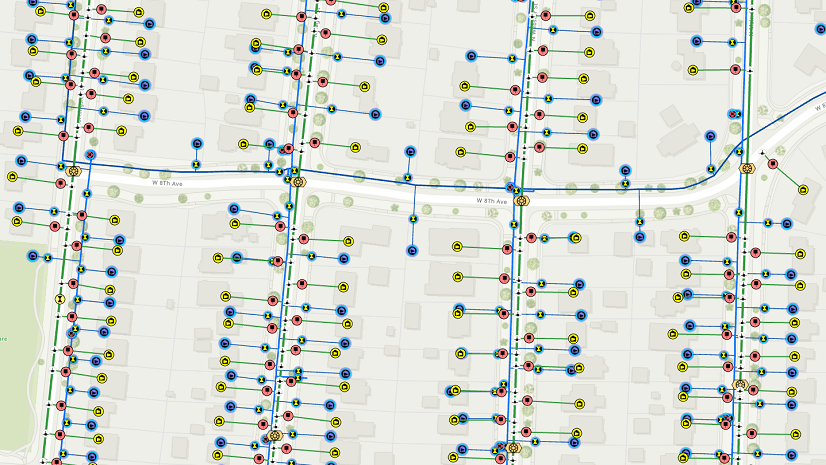
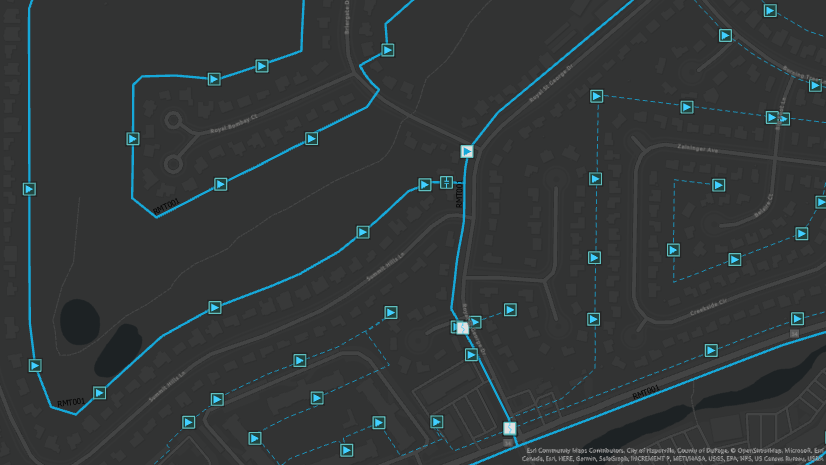
Below, you can see an example where the pipe and channel outlets act as subnetwork controllers for the catchment and subcatchment subnetworks.

The most obvious benefit of creating these subnetworks is that we can then use the utility network to do upstream/downstream tracing; however, several additional benefits become apparent once you become familiar with how subnetworks behave.
The first is that when a feature belongs to a subnetwork, the name of that subnetwork is recorded on that feature. This helps you to quickly identify which subnetwork a feature belongs to (without tracing) and makes it easier to identify and correct features that don’t belong to a subnetwork.

Next, just like connectivity is validated when features are edited in the utility network, so are the subnetworks. As your data is modified, you can keep track of which subnetworks are affected by those changes and take appropriate steps to perform quality assurance in those areas of your network.

This then raises an interesting question, if the subnetwork name is stored on the feature, how does the system represent the fact that a feature belongs to both a catchment and a subcatchment?
To answer this, we will use some new terminology then define and discuss the new terms in the following sections of the document: Catchments and subcatchments are considered different “tiers” in the network and that the stormwater network can be configured to be hierarchical. Tiers allows each feature to belong to both a catchment and a subcatchment at the same time.
Tiers
First, let’s cover what a tier represents in the utility network. To do so we will examine the concept of a subnetwork more closely. A subnetwork is a collection of features that represent a common area of flow within the network. In addition to the subnetwork name and its controllers, another important characteristic of the subnetwork is its tier.
Each tier contains a subnetwork definition, which is itself a collection of rules that govern what types of features can act as controllers for that kind of subnetwork, which features are allowed to participate in that kind of subnetwork, and any special behaviors that need to be considered when performing analysis within the subnetwork such as how to behave during heavy weather events.

Each tier also has a rank, which allows the system to understand whether it should be treated as upstream or downstream of other tiers. Rank 1 is always the ultimate source/sink of the system, so in a stormwater system the catchment is rank 1 and any subcatchments are rank 2. This means that a subcatchment is always upstream of a catchment, and a downstream trace from a subcatchment can be set to either stop at the outlet for the subcatchment or at the outlet for the catchment.
We also mentioned that stormwater networks are hierarchical. This is another property of the domain network called the tier definition, which allows a system to be either partitioned or hierarchical. The difference between these two types is that features in a partitioned network can only participate in a single subnetwork, while features in a hierarchical network can participate in a single subnetwork for each tier.

If you only care about the path to the nearest outfall, and don’t think about your systems in terms of catchments and subcatchment, then a partitioned domain will meet your needs. If you want to differentiate your subcatchments from your catchment and want to be able to trace from an inlet to the terminal discharge point(s) downstream of that location (and not just the nearest outlet) then you will want to make sure your domain network is configured to be hierarchical.

Conclusion
Once your utility network is configured and calibrated to model flow, you will find the editing workflows for the utility network allow you to keep your model valid more easily. All network edits are validated against the rules for the model and your subnetworks make it easy to identify disconnected features. These checks, along with any business rules you have configured, will give you confidence that everyone in your organization can trust the data and the results of the analysis they perform. Because the utility network is supported in mobile, web, and desktop applications this means that everyone in your organization will be able to benefit from access to this data regardless of whether they’re in the office or in the field.
What else can you do once you have your data in the utility network? Consider using it to simulate rainwater/flooding using ArcGIS Pro. Talk with your engineers about how to better incorporate the as-built GIS model into the software they’re using for design and planning. If you want to learn more about using the utility network to model water, wastewater, and stormwater datasets check out the Learn ArcGIS Utility Network for Water Utilities and Learn ArcGIS Utility Network for Sewer and Stormwater learning series. You can also download the model and sample data for the Stormwater Utility Network Foundation from the ArcGIS Solutions site.
You can also try these hands-on tutorials related to this article:


Commenting is not enabled for this article.