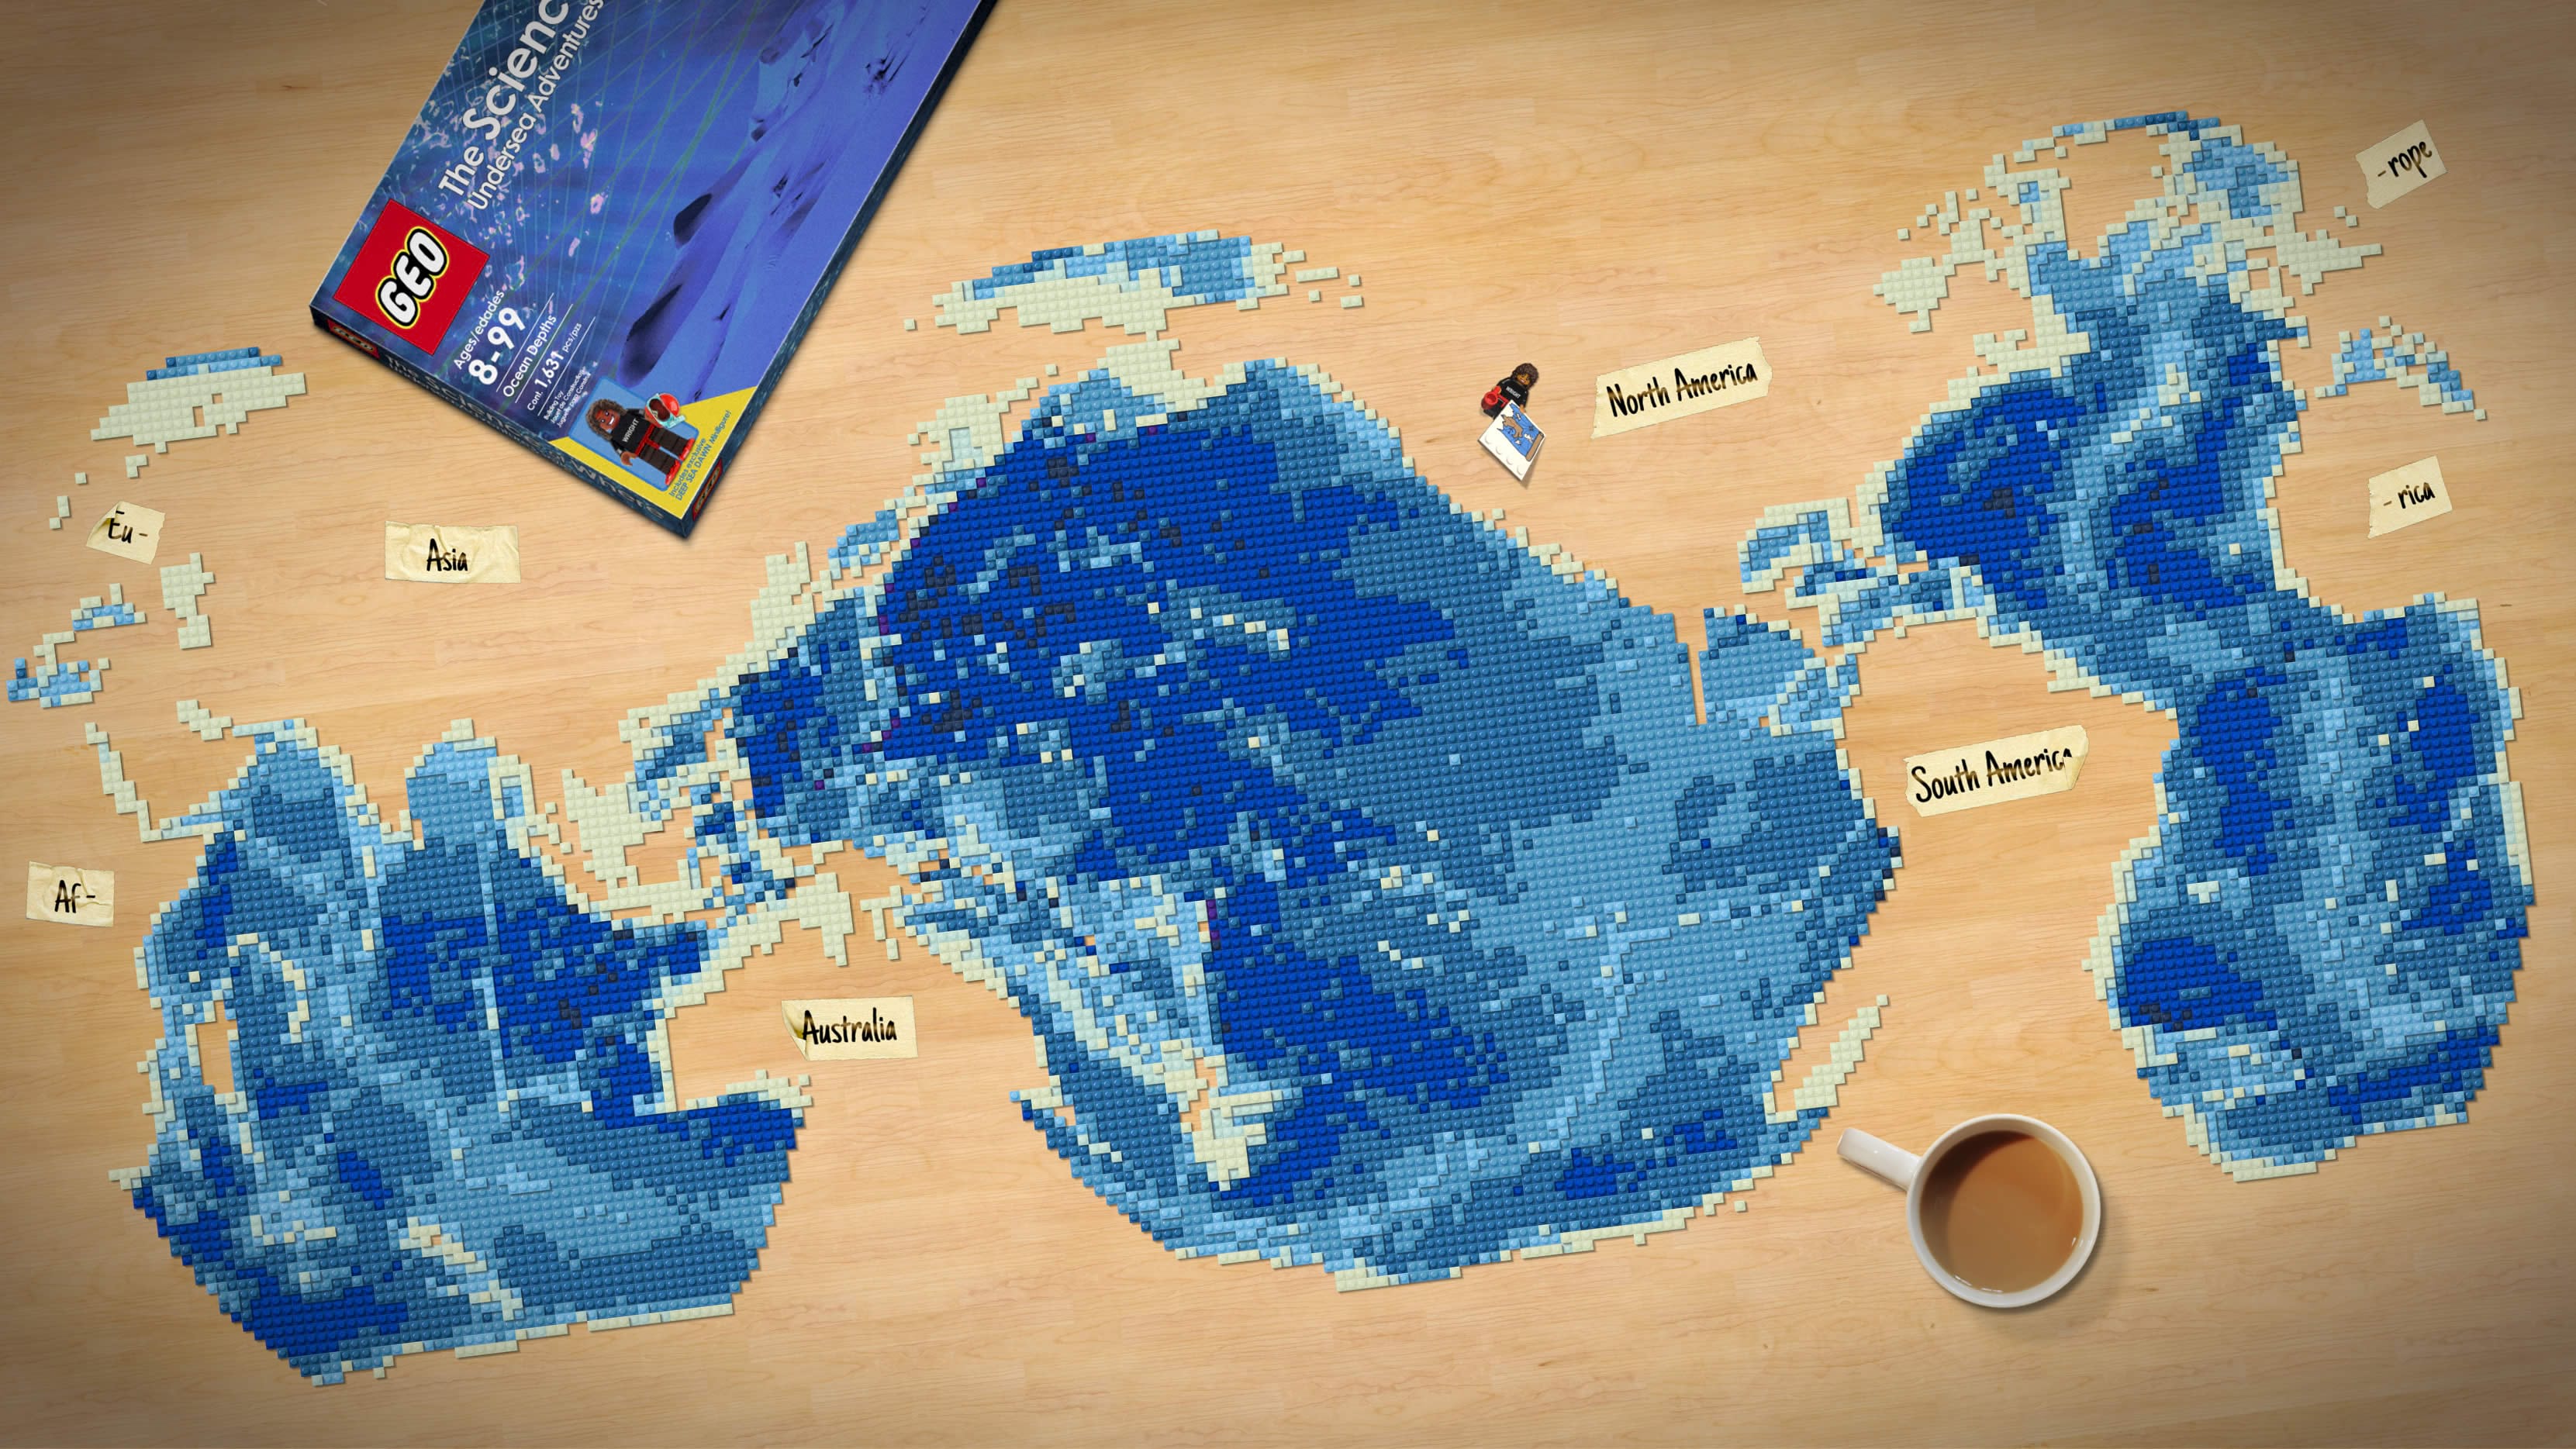
I realized last week that I never really shared out a map I made last year as a for-giggles poster for an Oceans GIS Forum. Anyway, what better way to promote the adventure and mystery of the oceans then to assemble a Science of Where Undersea Adventure Lego-like set, complete with Deep Sea Dawn minifigure?
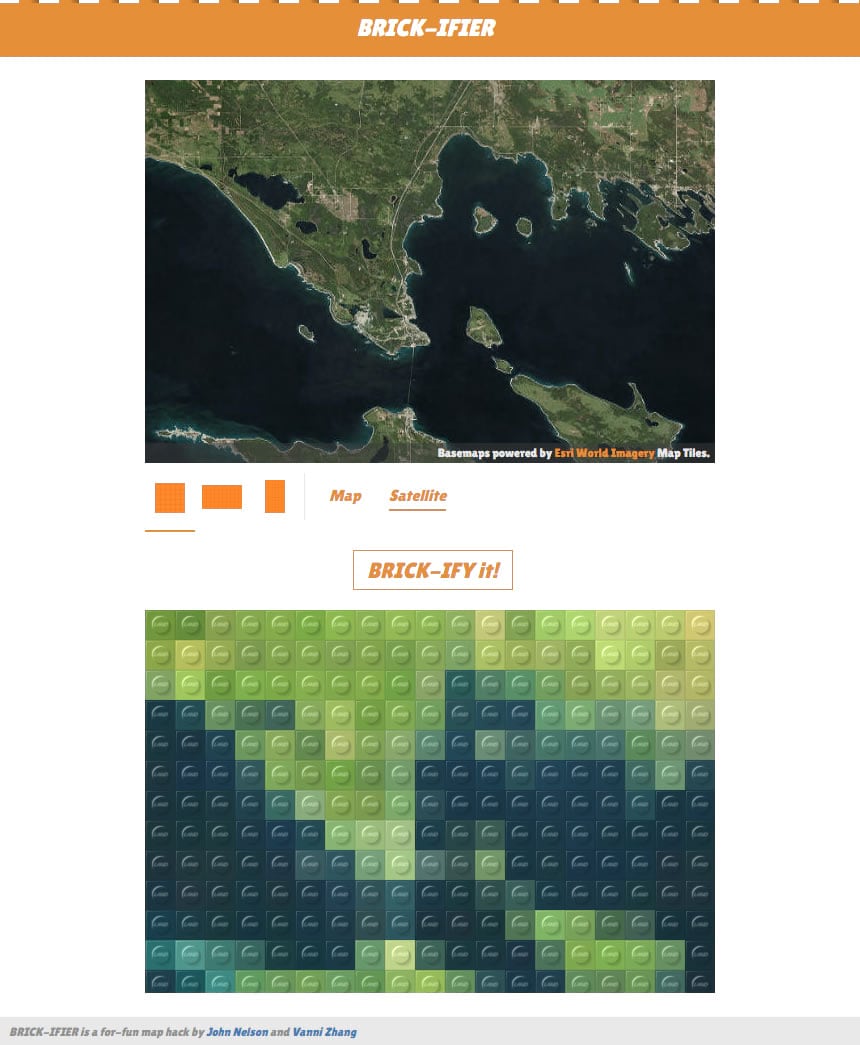
Last fall I was playing with some Lego bricks in Ken Fields‘ office talking about his cool Lego-style maps and I had an evil idea. What if I took a picture of the actual bricks to use as symbols in ArcGIS Pro? That way I could assemble all manner of Lego-like creations virtually. Plus they’d be maps, which, obviously, would rule. I had been in a bit of a Lego map kick, having collaborated with Jinnan Zhang on a Brickifier app to turn basemaps into Lego maps. Because Lego.
Assets
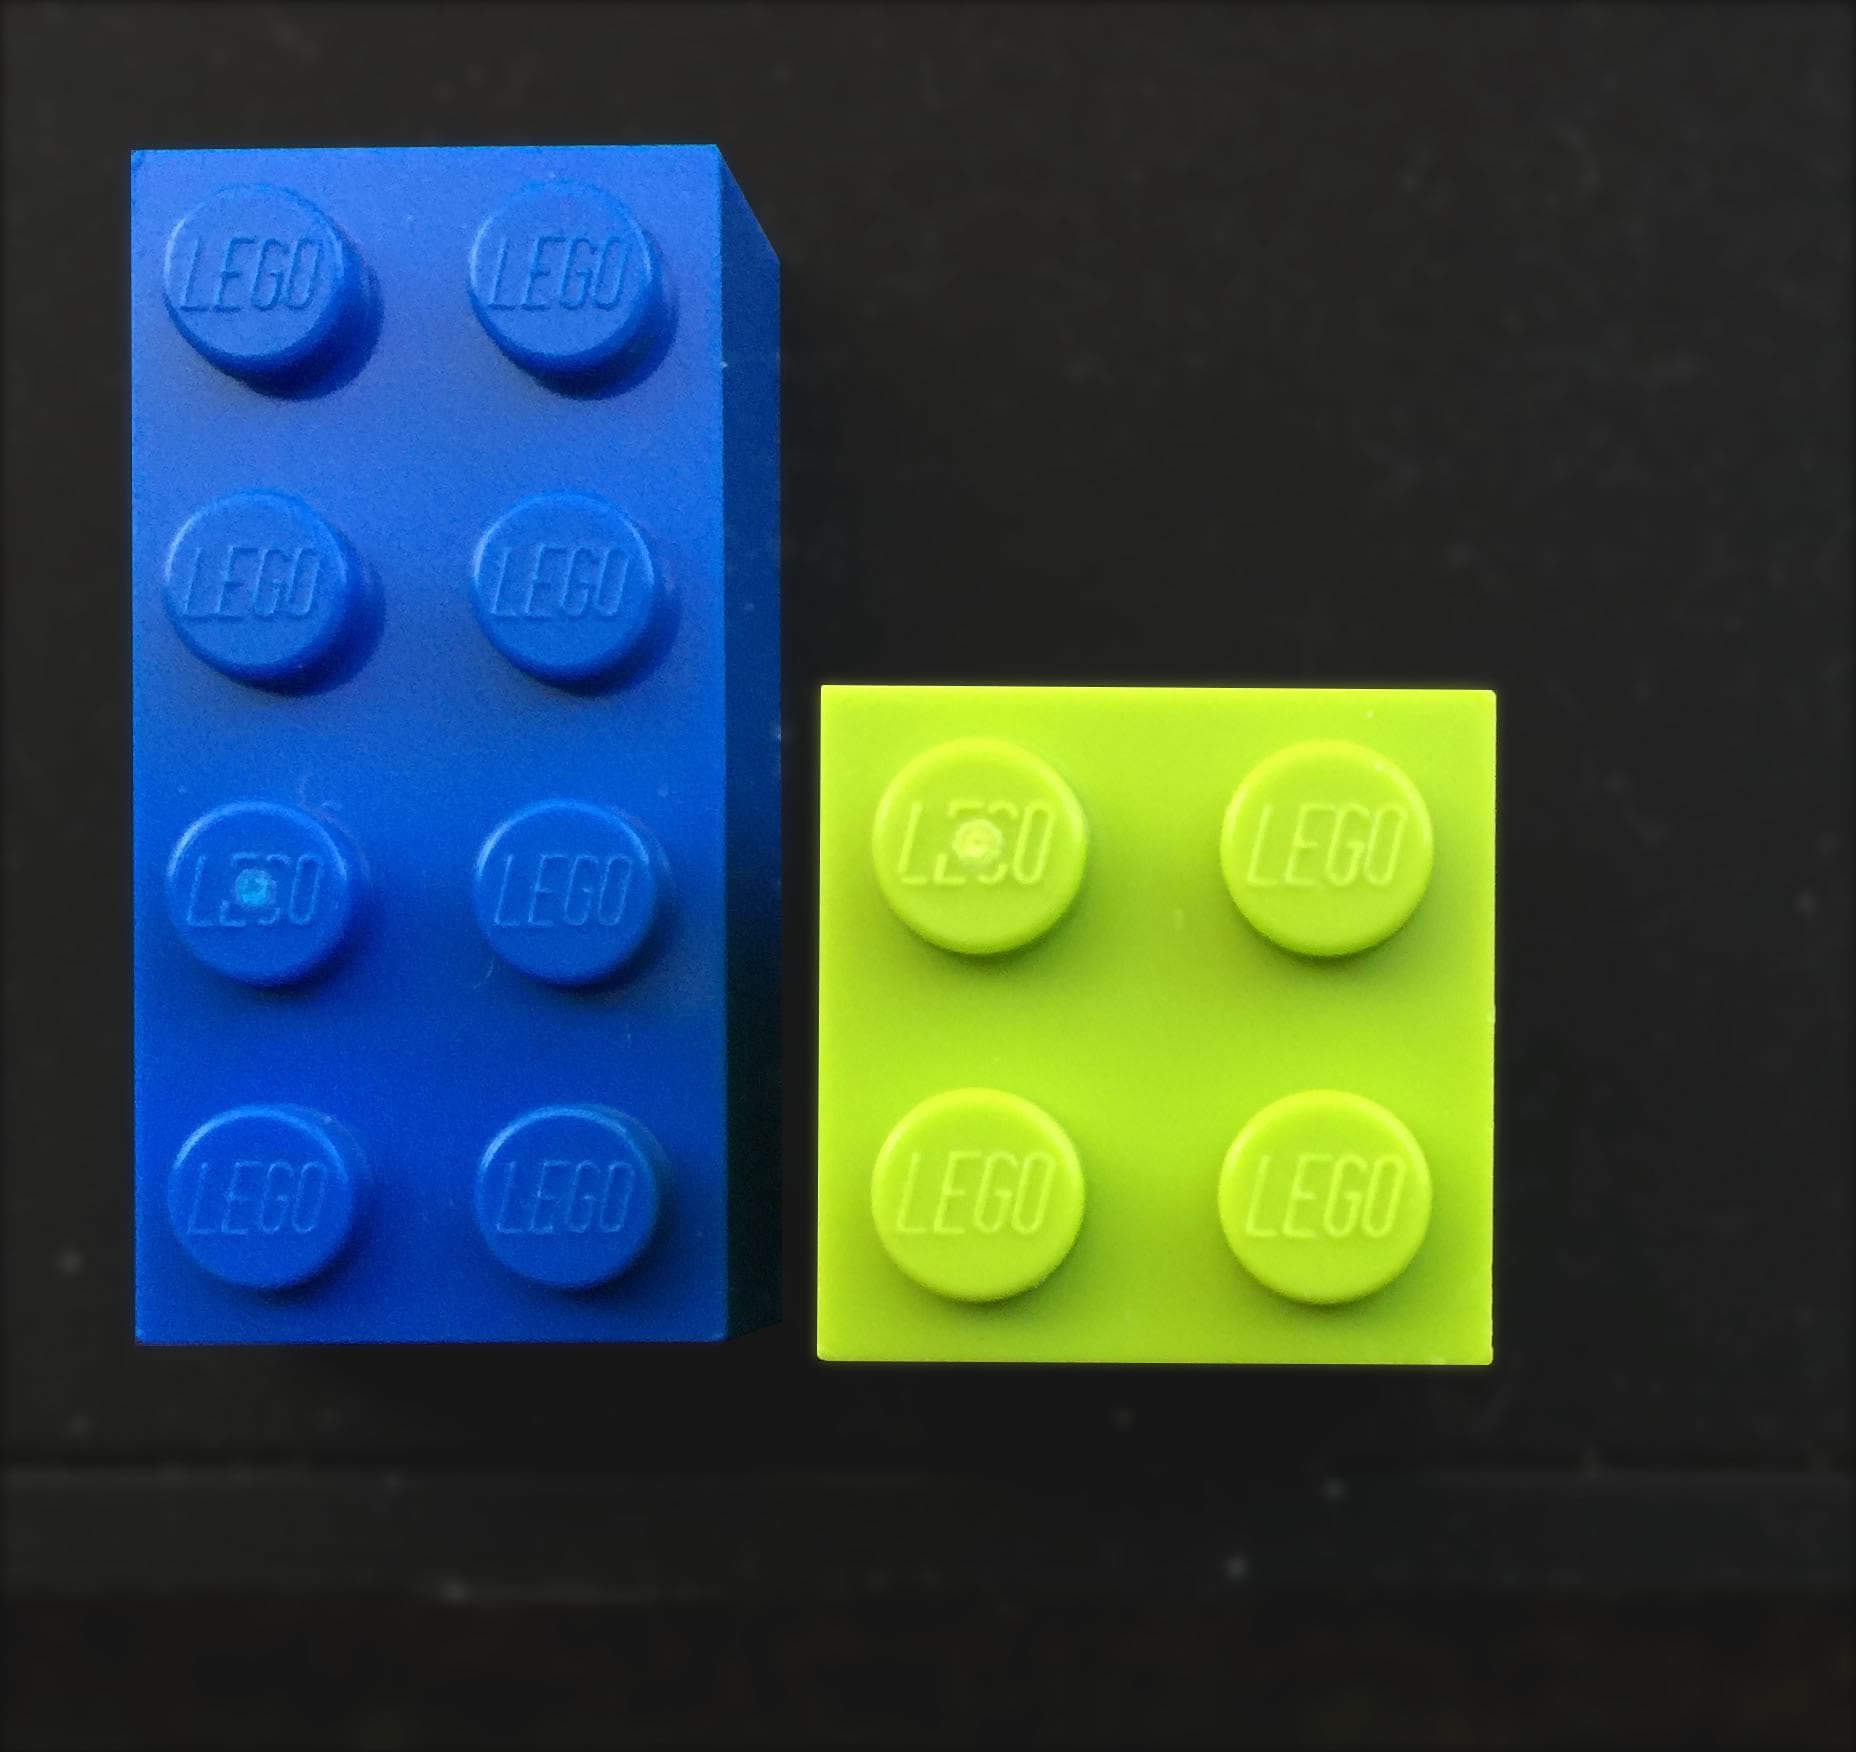
So I snapped this picture of a couple of bricks.
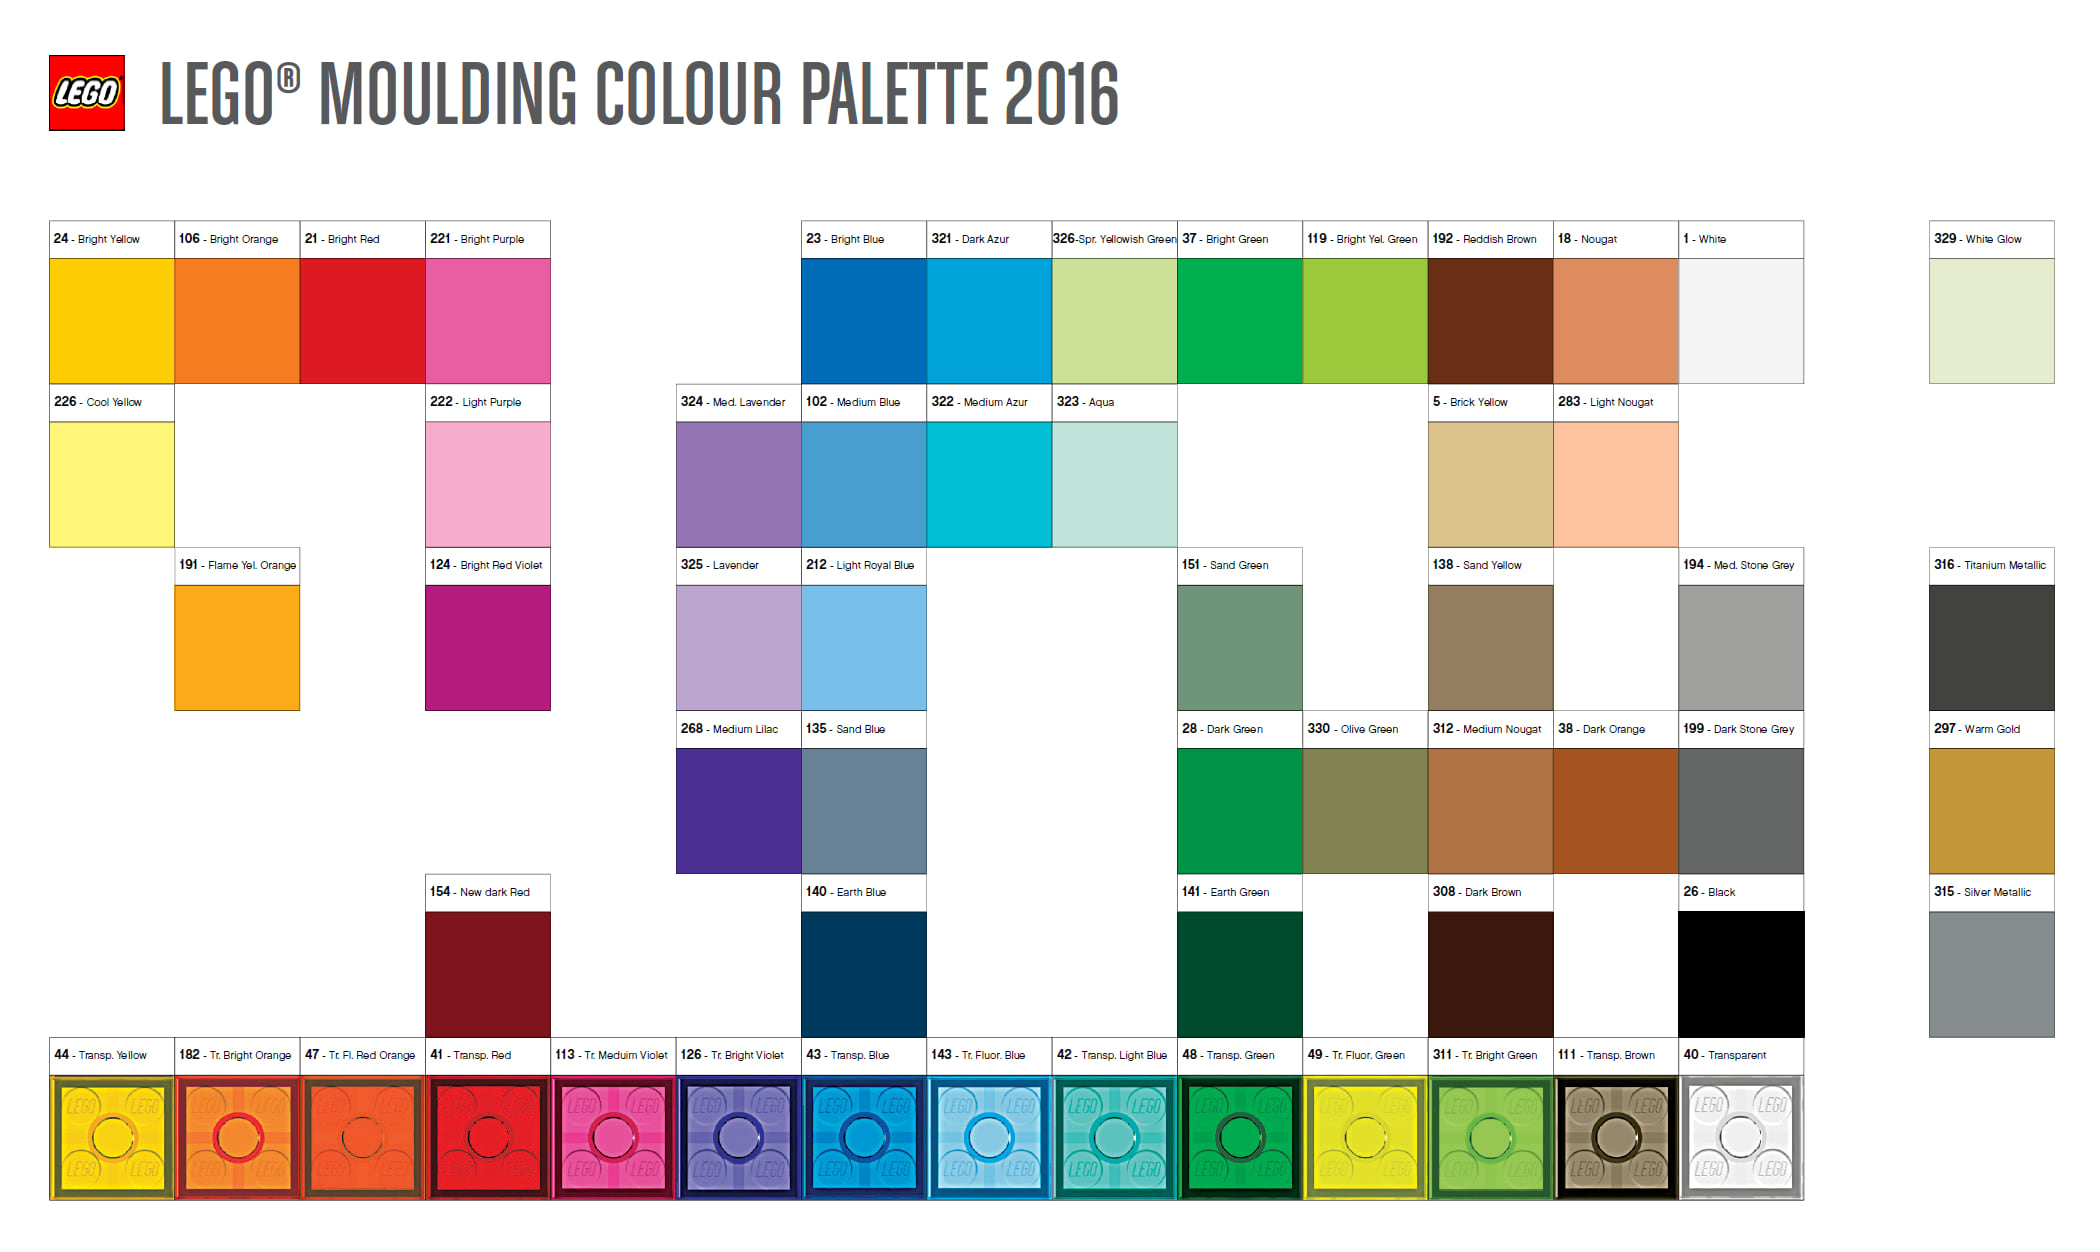
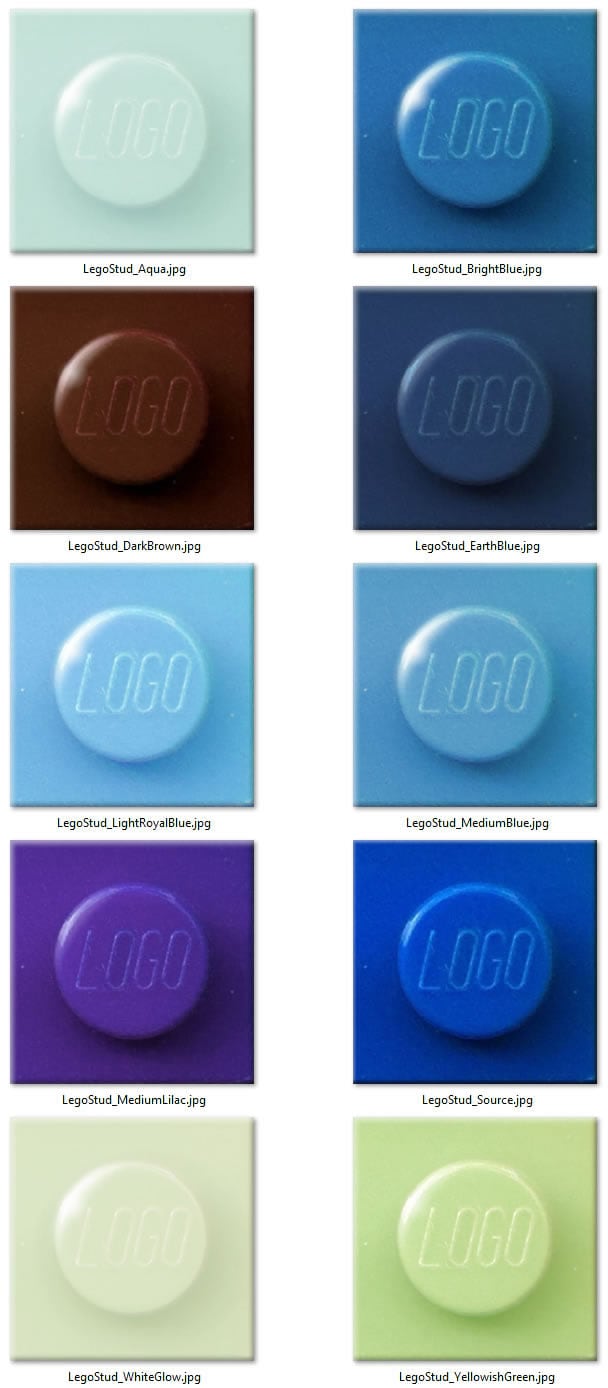
And I grabbed an official Lego color palette/name reference…
And I cropped my image to just one stud and played with the tinting to generate a good-enough palette of bricks for mapping adventures. I changed the text to “LOGO” for posterity.
Assembly
In Pro, I opened up a vector layer of oceanic bathymetry. And I promptly chose the Goode Homolosine projection, tailored to oceans.
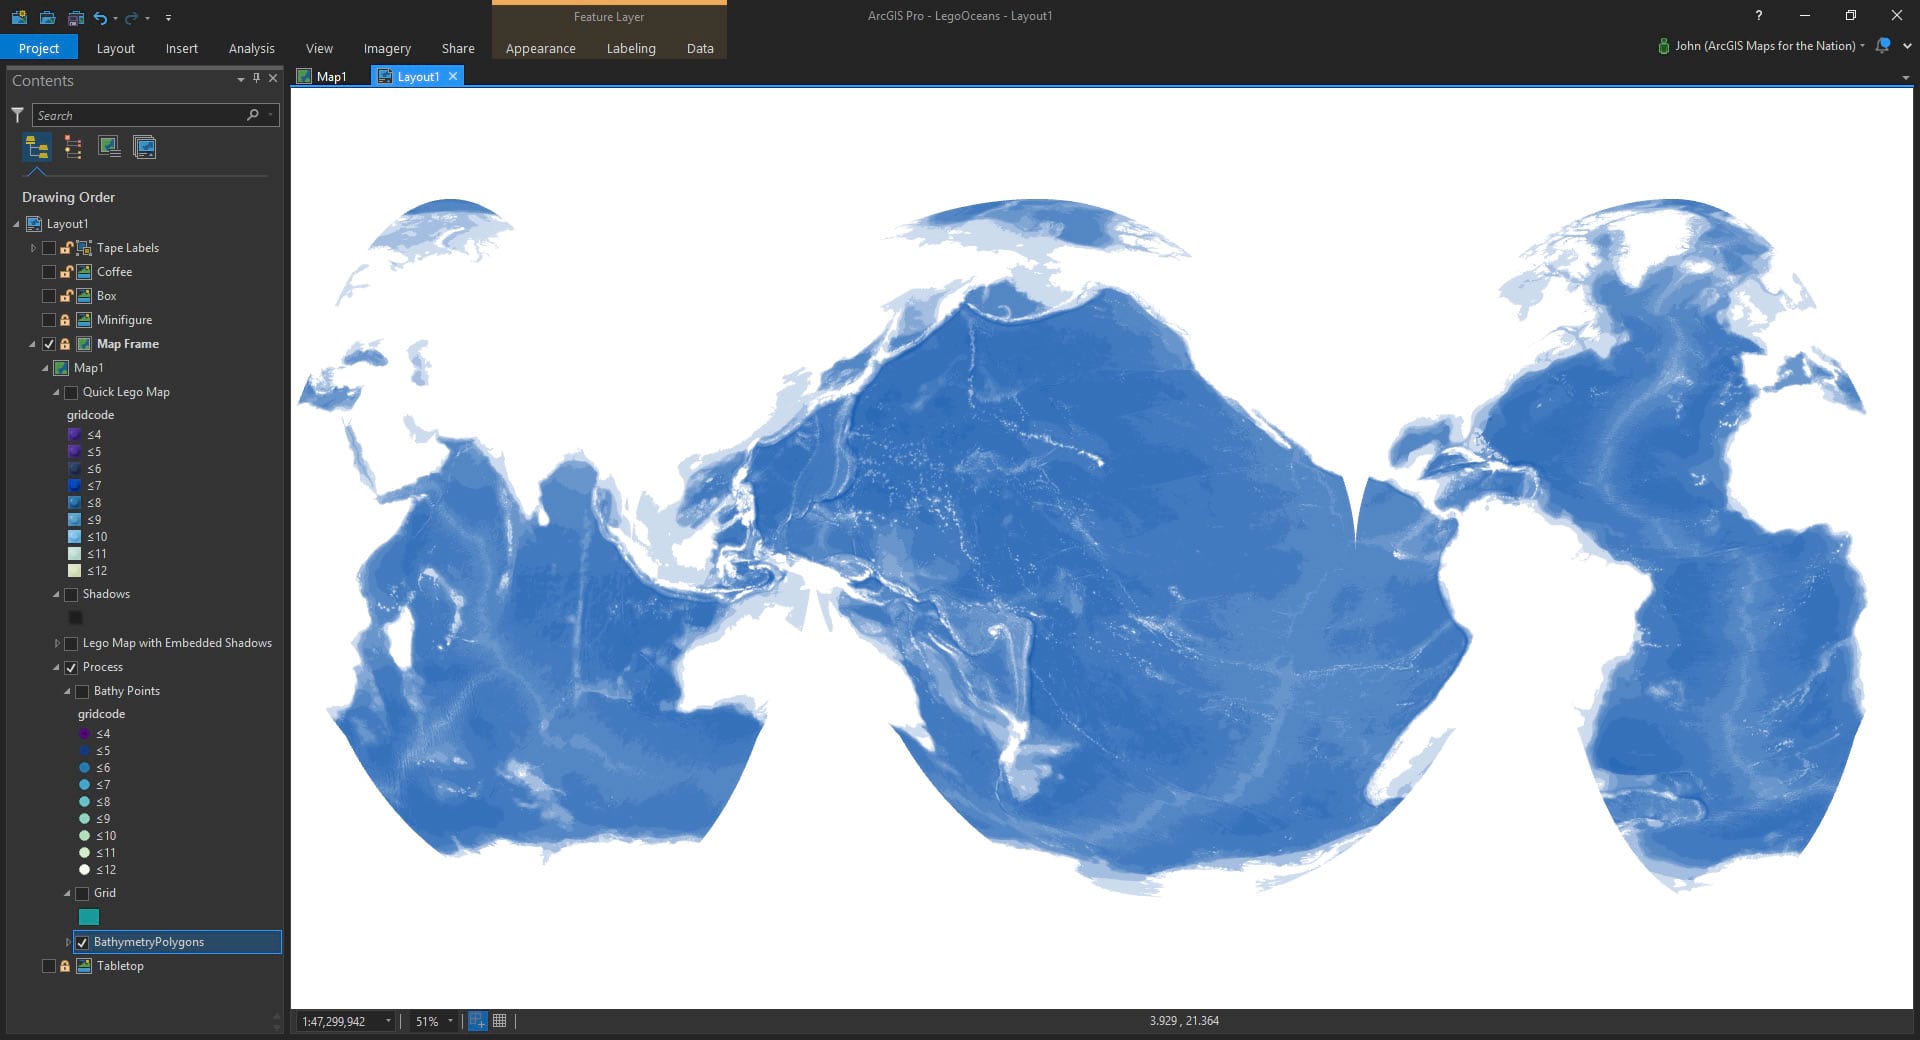
Beautiful! But not Lego. How could I make this thing look all bricky? Time to pop open the box and rip open all those cellophane bags of glorious bricks!
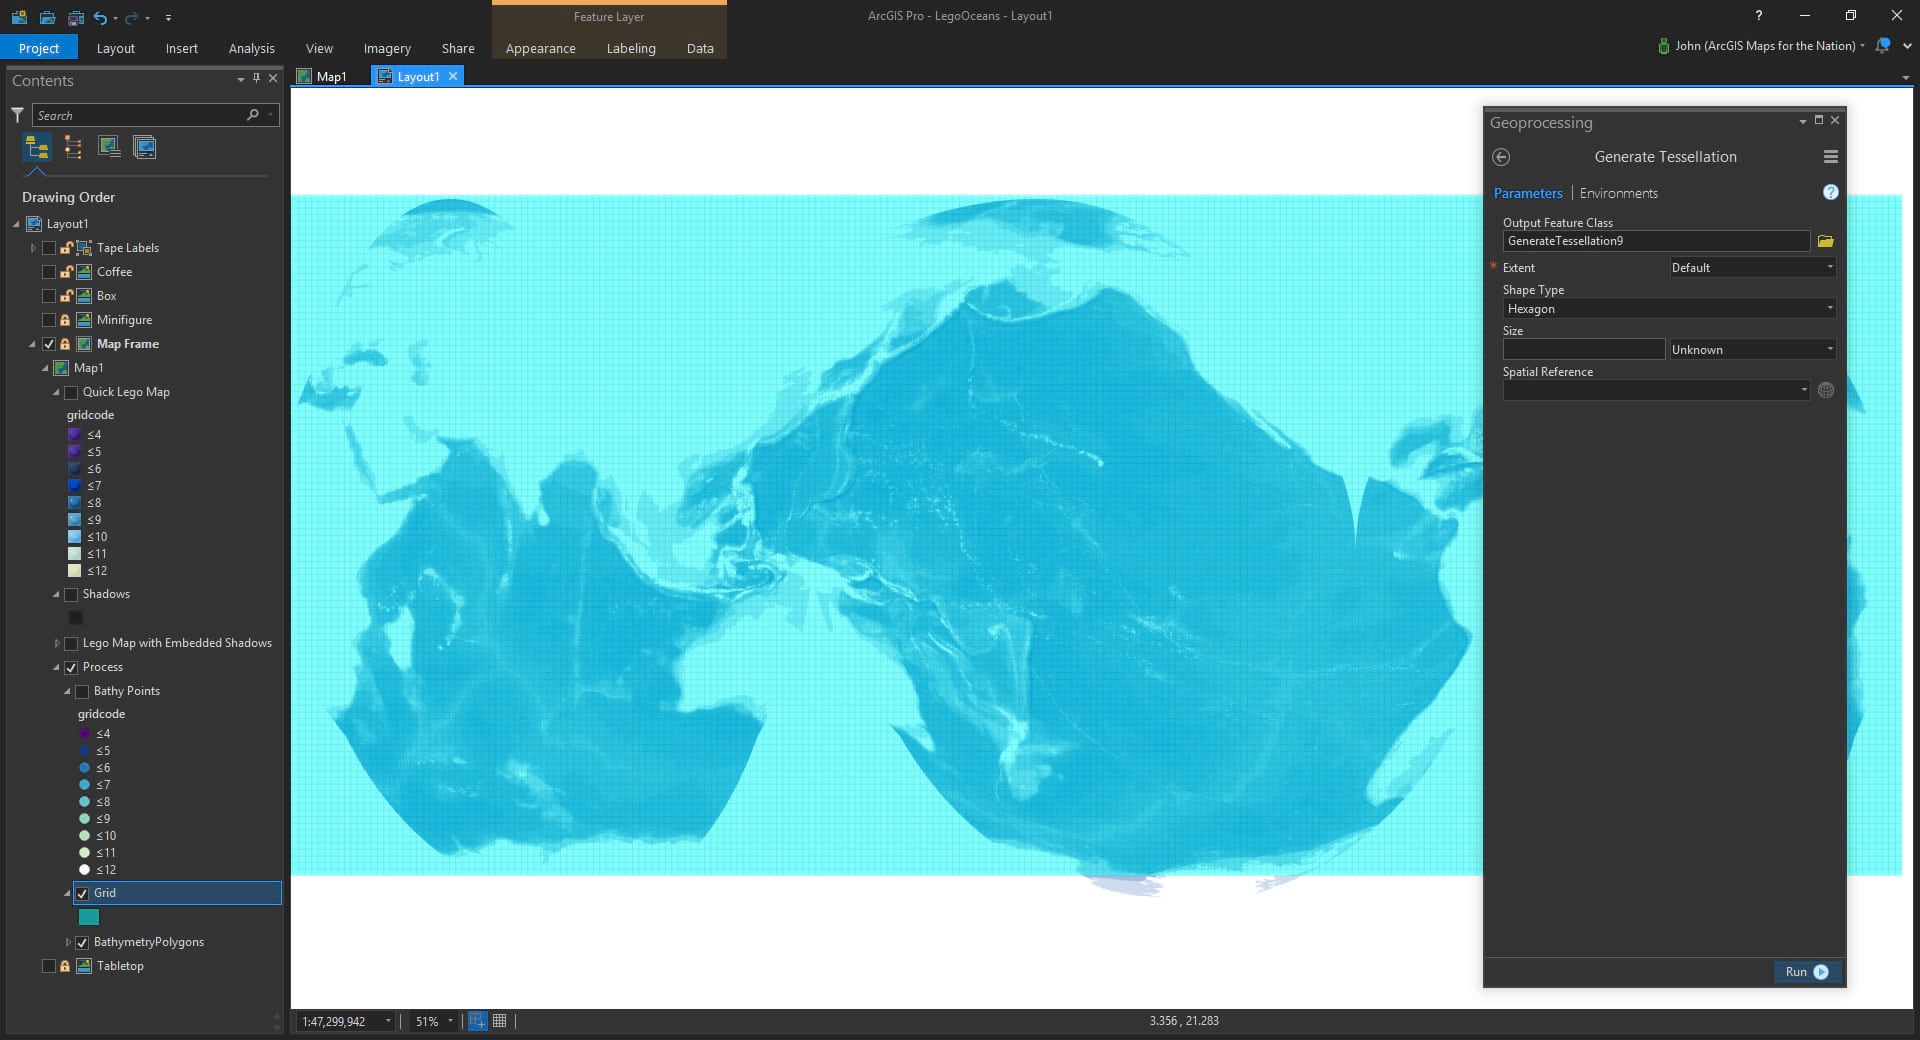
Virtual bricks. I created a new layer of squares, using the Tessellation tool.
In order to transfer the bathymetric info from the bathymetric layer to my new bricky-grid layer, I used the Spatial Join tool. Spatial joins are dark magic. It steals the attributes of one layer based on its location relative to another! I so I asked for the bathymetric depth field at the center of each little square cell.
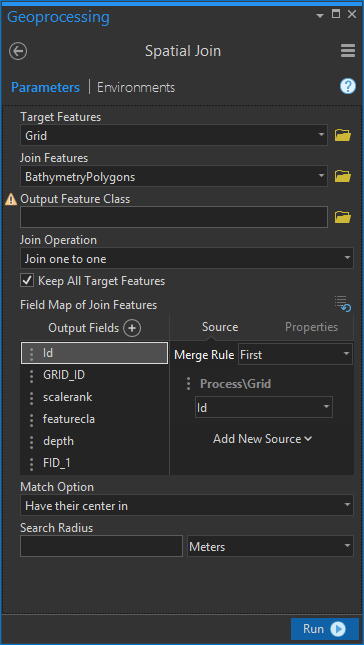
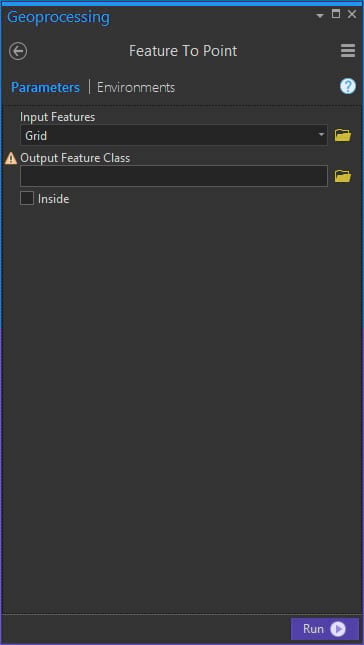
And it totally worked. Next, I converted my now-bathymetrically-aware grid into a point layer, so I could assign each point a little brick picture.
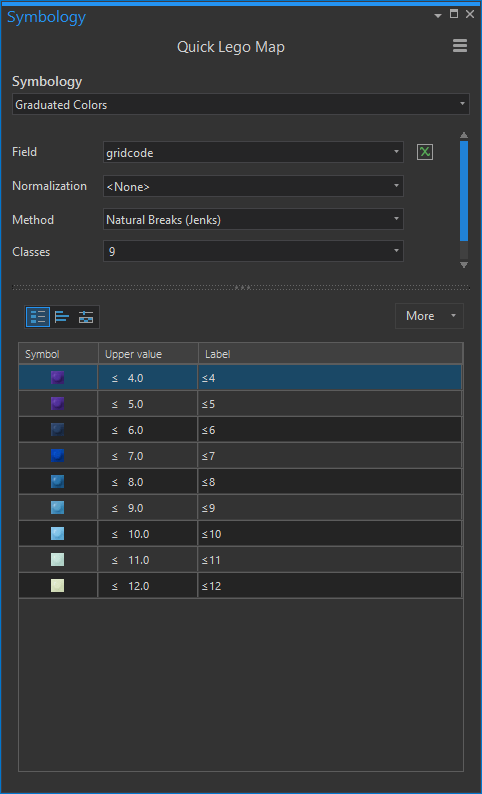
Using a circle symbol (just to get a preview of how it was coming), I chose a Graduated Color classification scheme. Coming along!
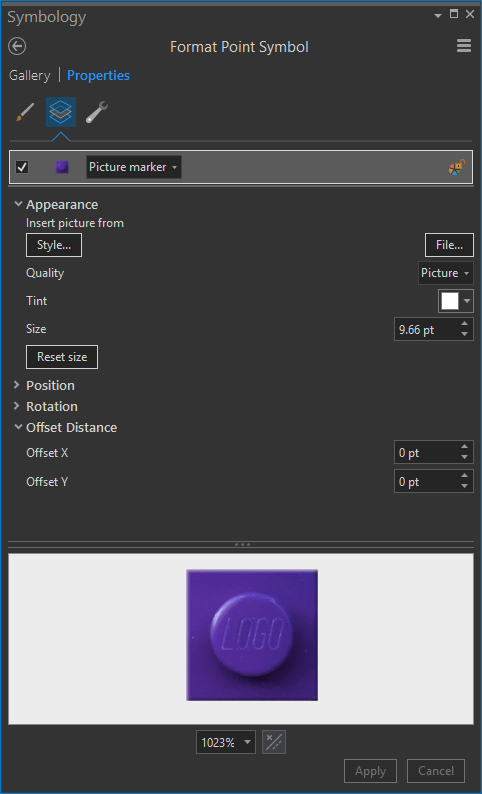
Now to swap out these simple circle symbols for my “LOGO” stud pictures. For each class, I replaced the marker symbol with a picture symbol, uploading the picture, and sizing it so it fit in my map’s layout without gaps or overlaps. Trial and error.
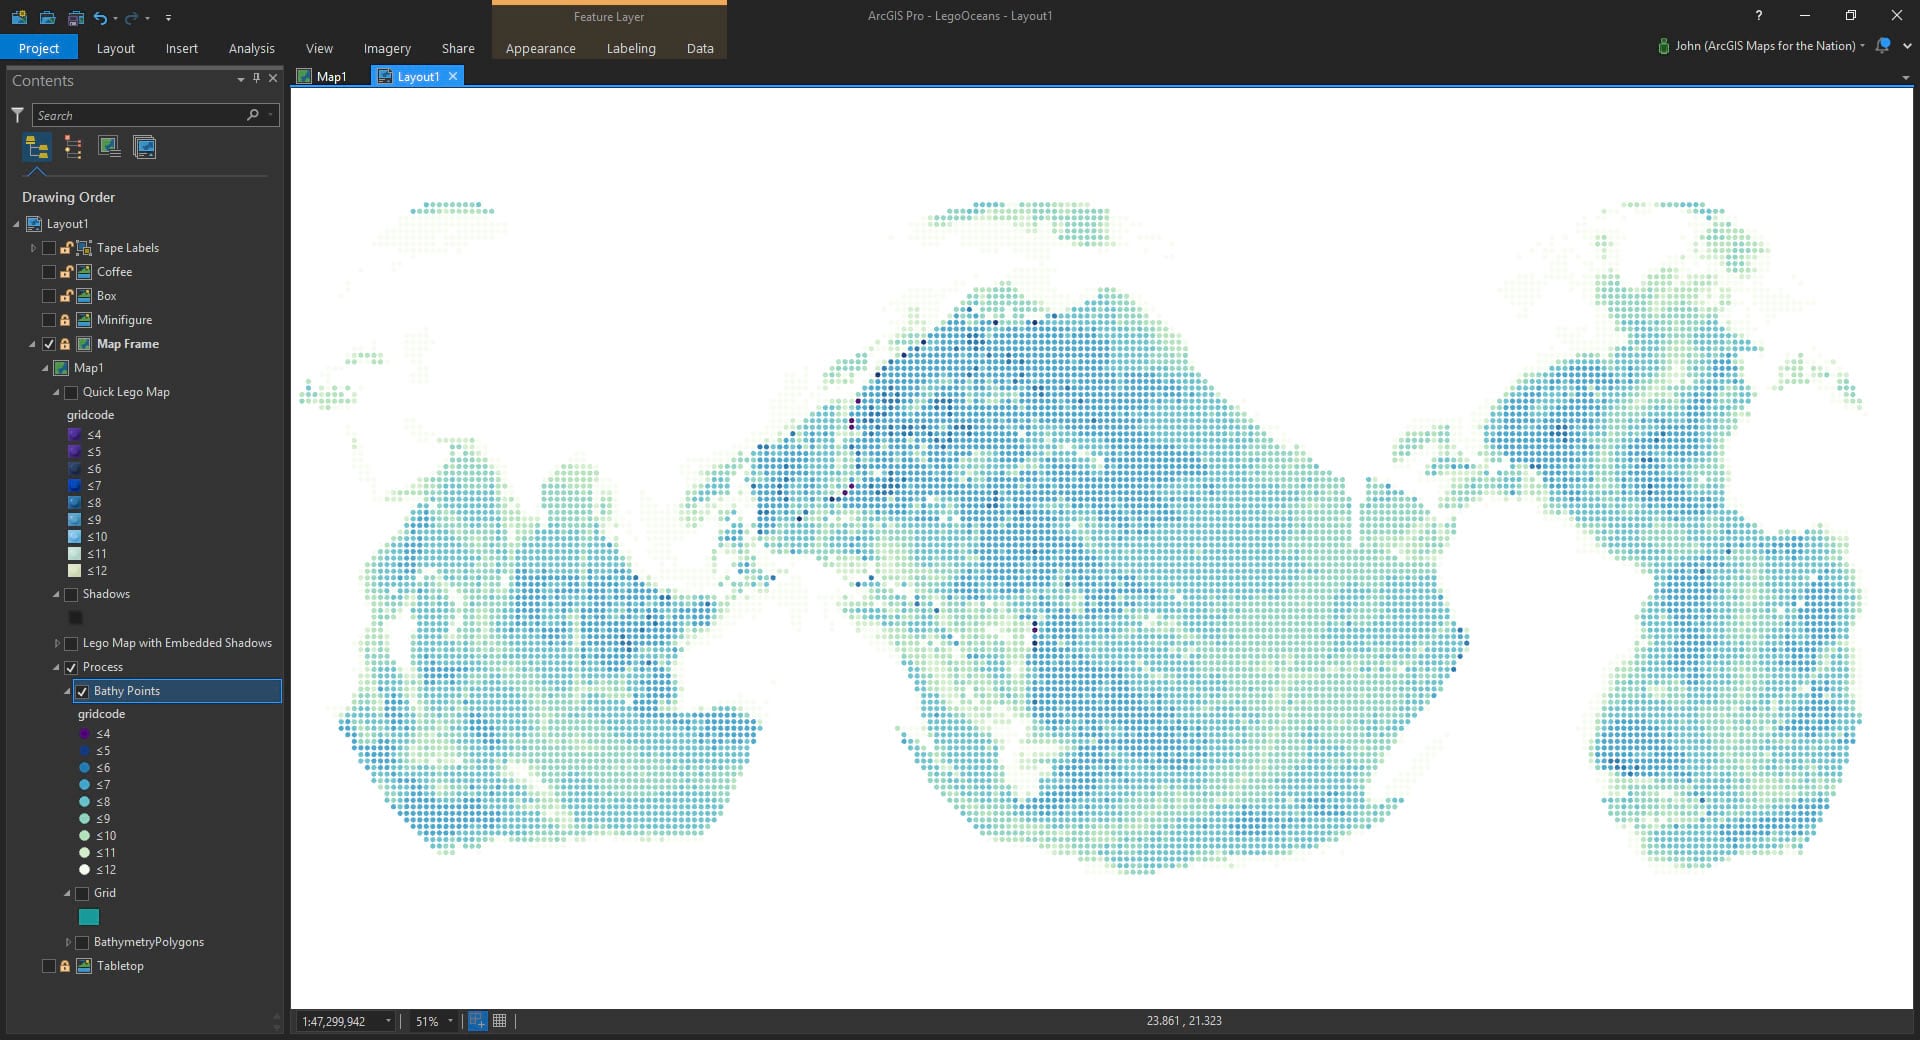
It looked like this (I also made a copy of the layer in semitransparent black and put it below the bricky layer, so it popped a bit)…
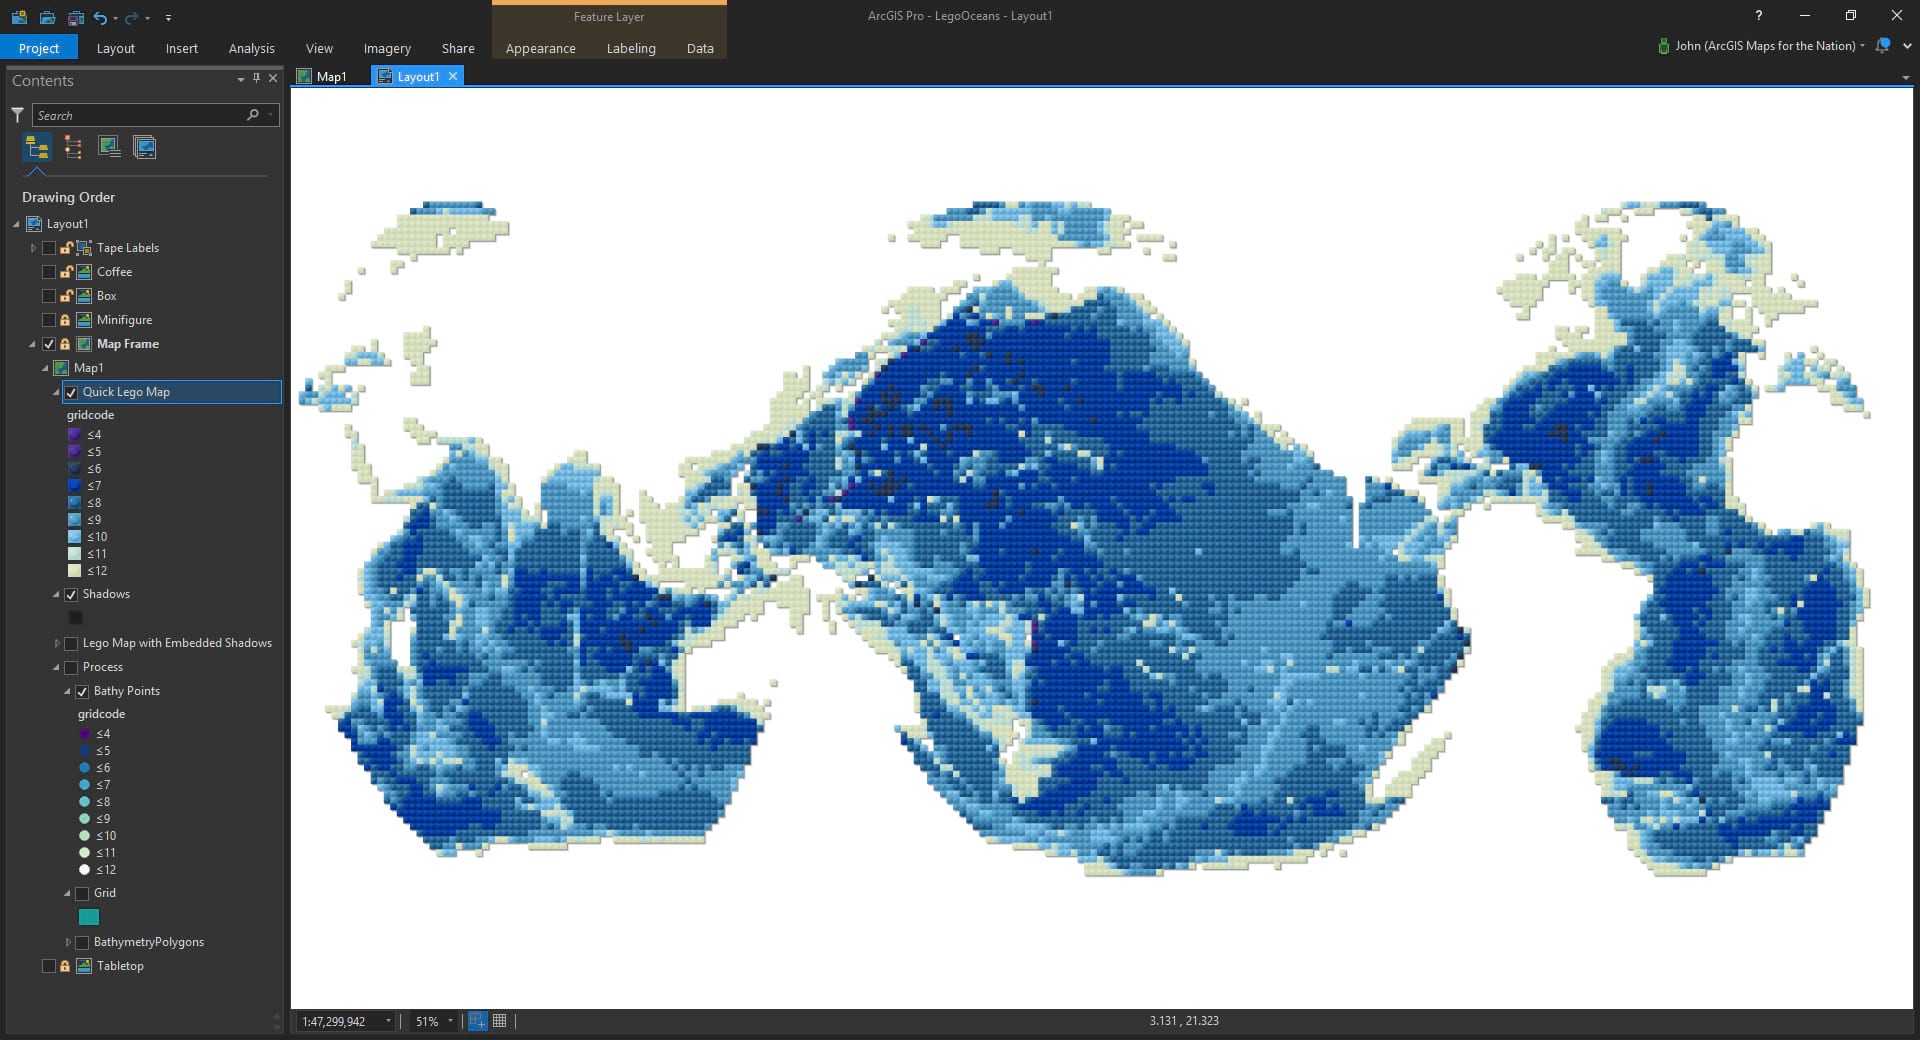
Fun, huh? I mean, serious and useful and practical and scientific.
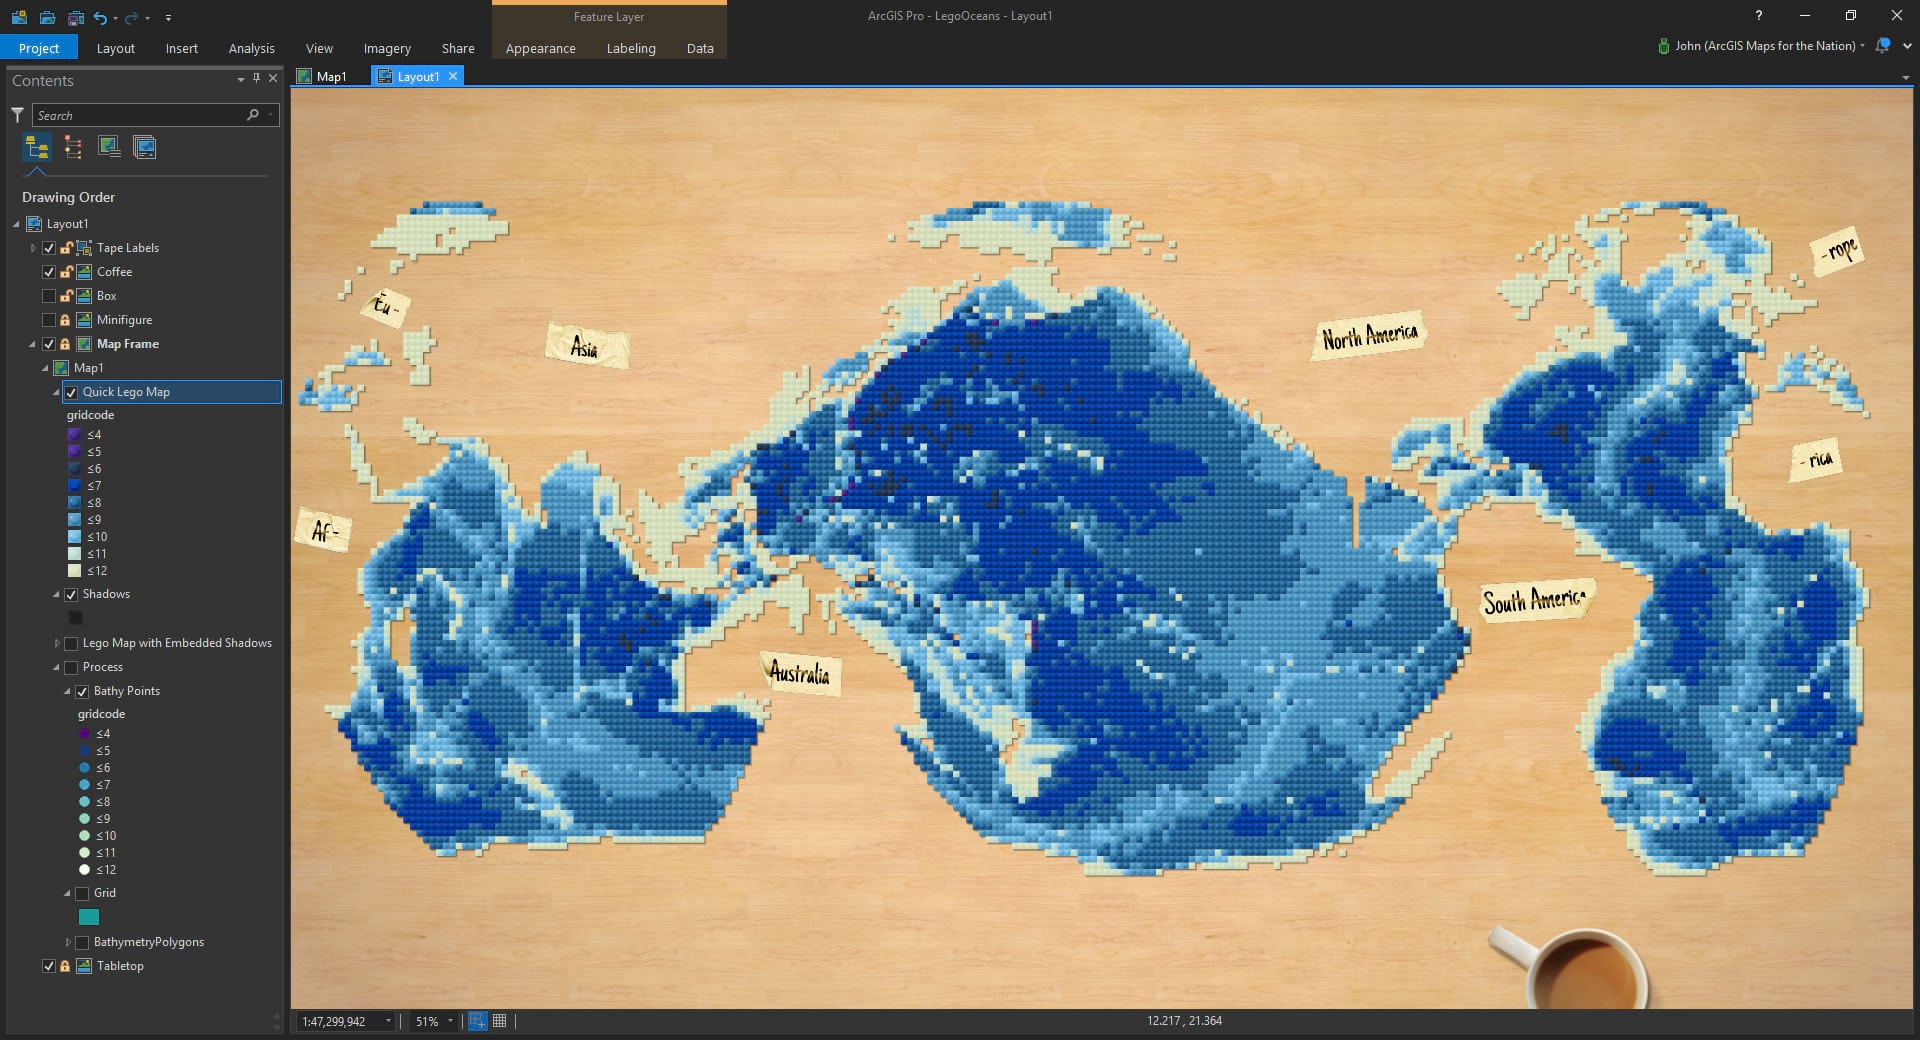
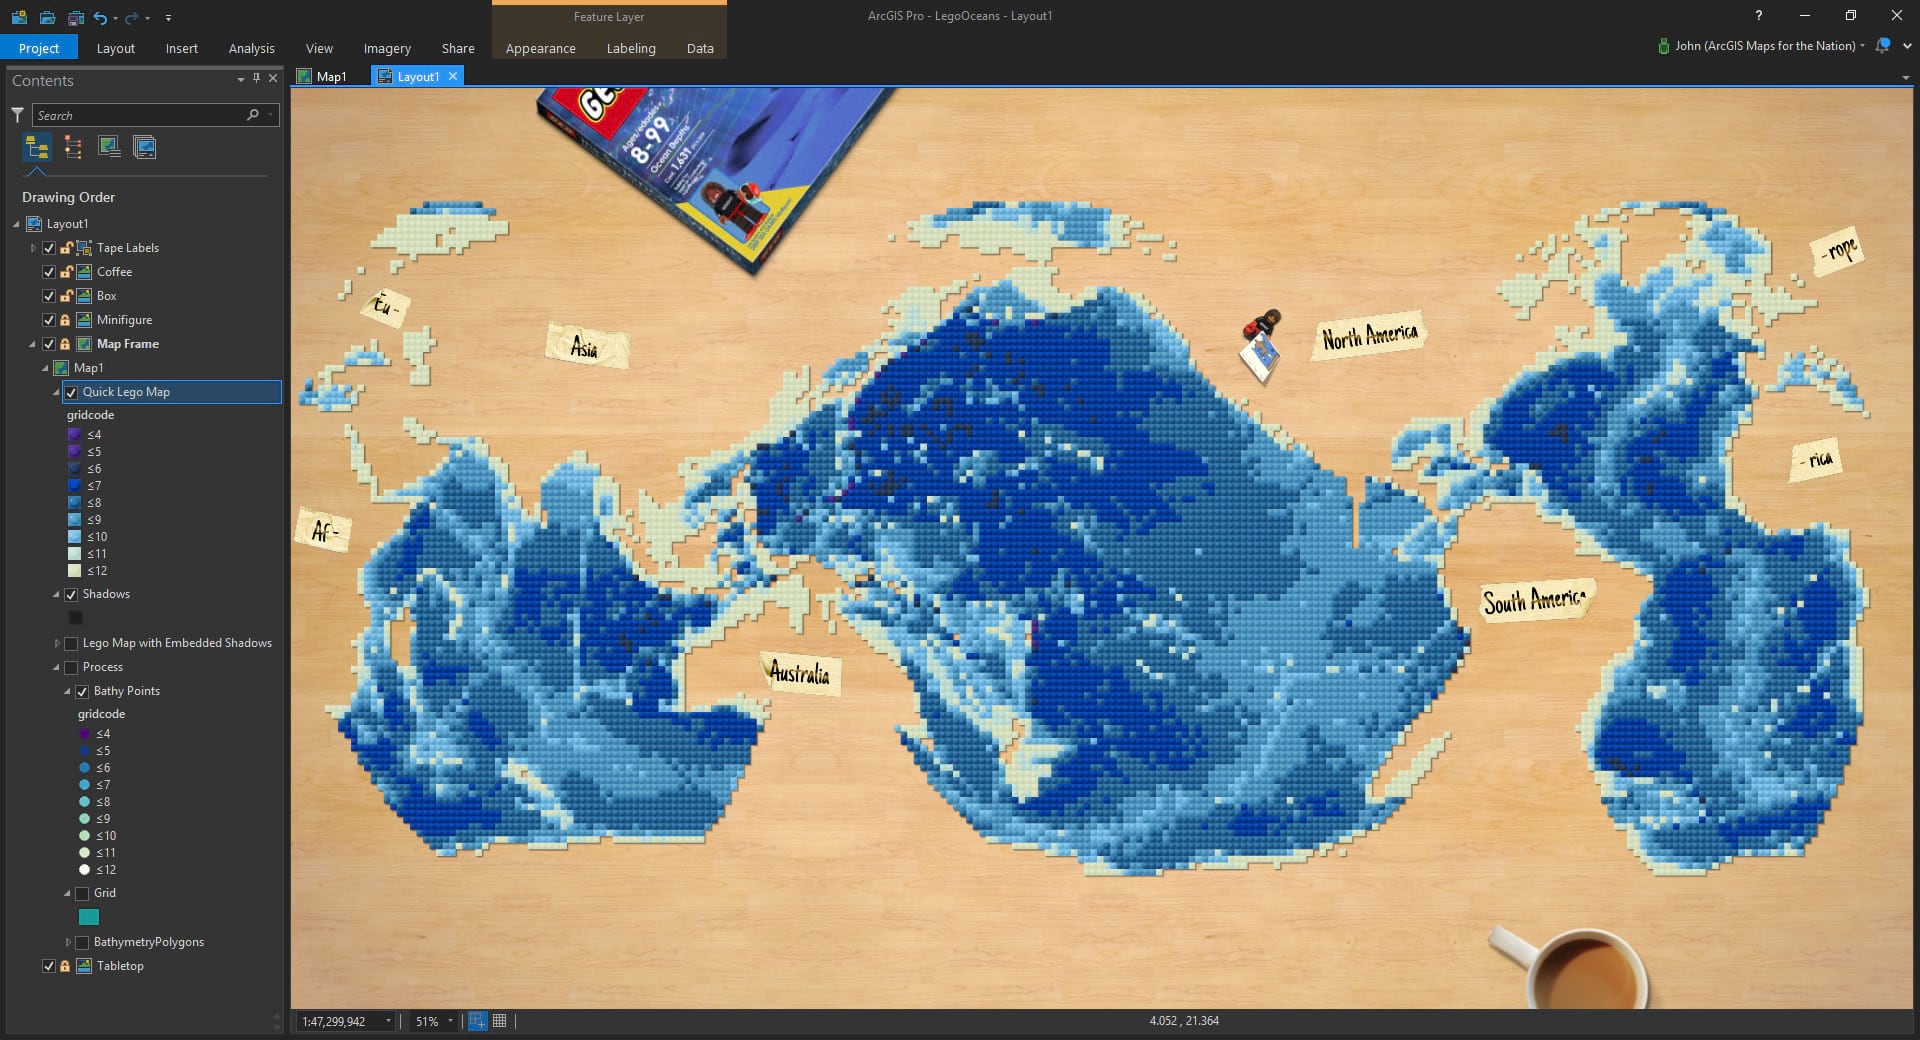
Now, with a set like this, you’d definitely want to work on a clean flat surface, like your kitchen table. And you might want to tape down some references to keep you oriented. Of course with a set this big, you’ll need some snacks or coffee to help get you through it.
My favorite part of any Lego set was the minifigure. This set happens to come with a limited edition Deep Sea Dawn minifigure (a real custom minifigure, gifted to Dawn by the geo-generous Cartonaut).
Extra Credit
And there we go! A Lego-like map of actual bathymetric data, assembled with little plastic brick images in ArcGIS Pro. No missing pieces!!
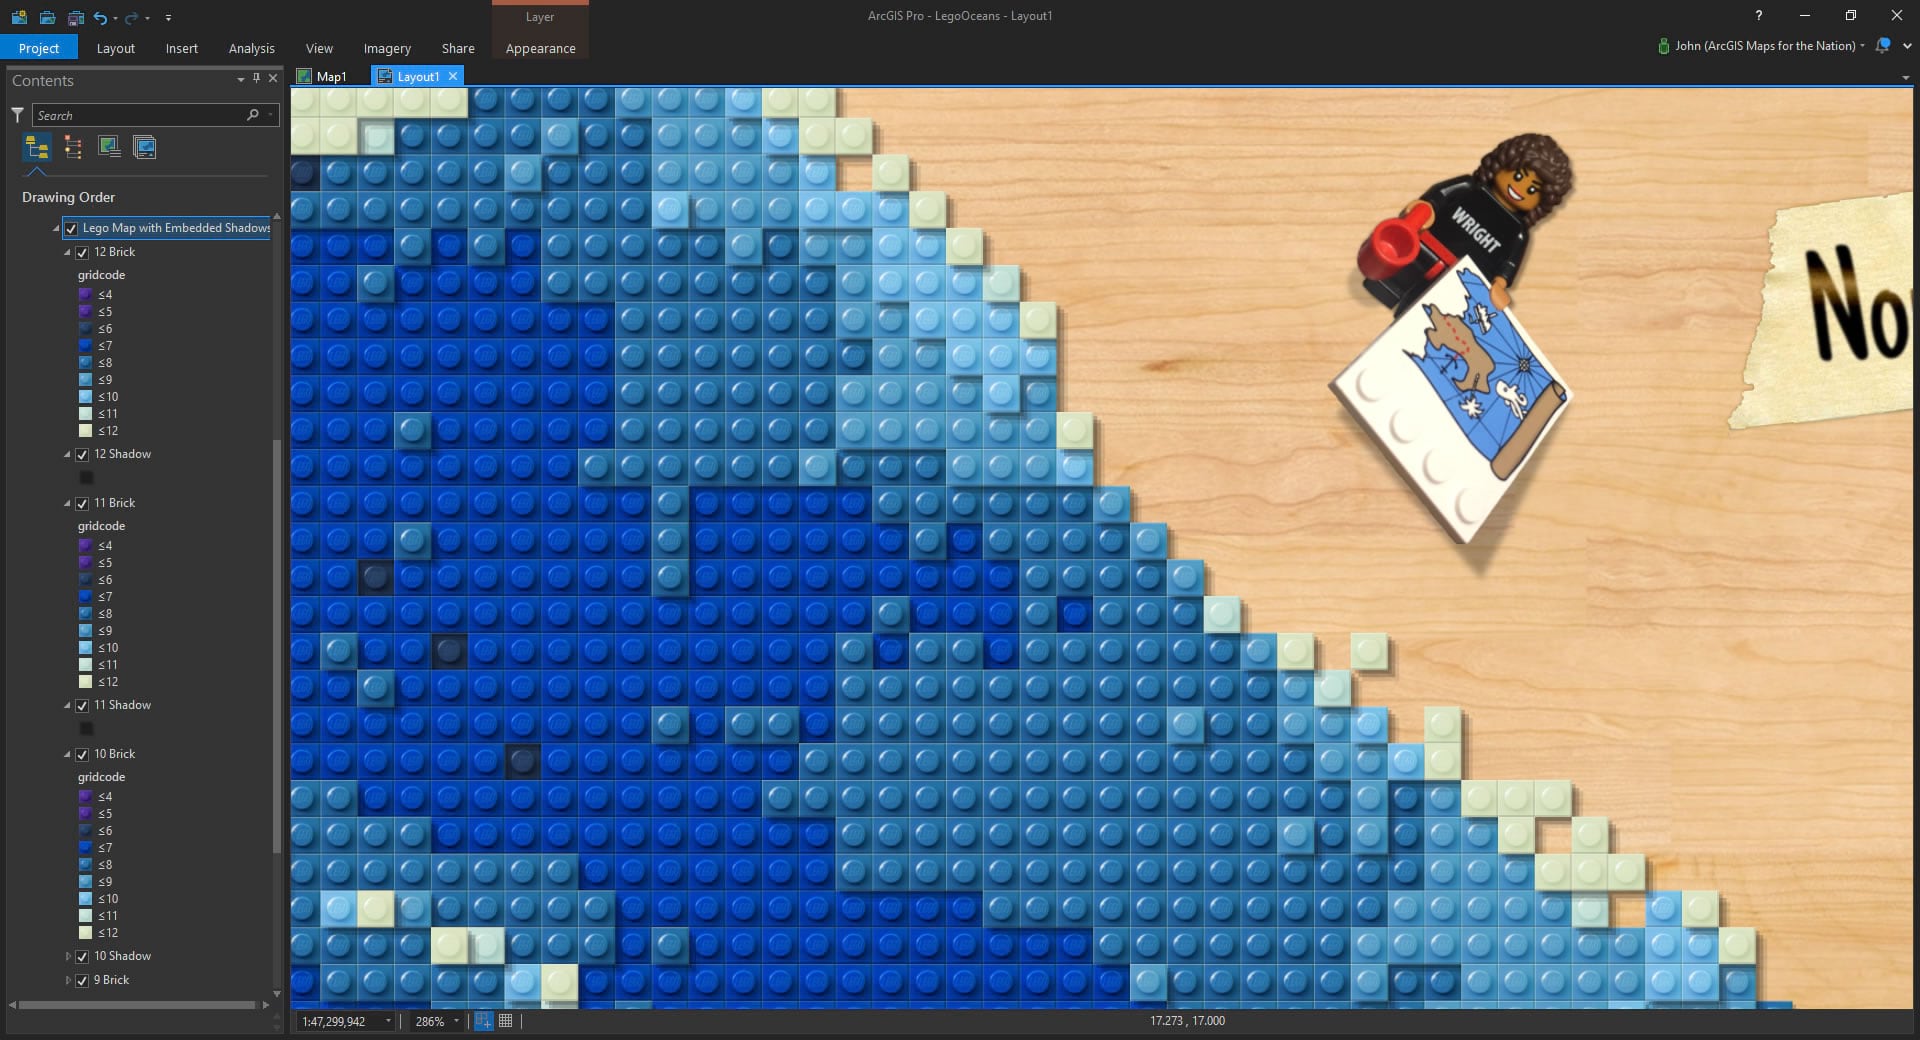
Now, I wanted my bathymetric map to actually look a bit 3D. Like the bricks were stacking up on top of each other. Extra points if you can piece together how I interleaved the shadow layers between each depth using Definition Queries on lots of copies of the brick bathymetry layer.
Styles
So I did all this last fall, before I knew about Styles. Shame! I didn’t realize then that I could save each brick as a point symbol or a repeating marker fill symbol or any of that! Creating, re-using, and sharing, styles in Pro is totally awesome.
But luckily for you, ArcGenius Warren Davison is a style master. And he’s made a style that can give you similarly bricky results and has written a how-to. Check it out here.
Happy Assembling! John Nelson

Commenting is not enabled for this article.