Many new features are introduced in this ArcGIS Experience Builder release to help users build their no code and low code web apps much easier. These features include three widgets—Search widget, Edit widget (beta), and Oriented Imagery widget. Other highly anticipated capabilities launched this month are support for line and area charts, the ability to zoom to features when applying the filter, editing existing survey records, and lazy loading views for performance. Let’s dive into them.
Search Widget
Compared with the search tool on the Map widget, the Search widget comes with more options. For example, you may use it with or without maps and place it anywhere on the page. Let’s take a close look.
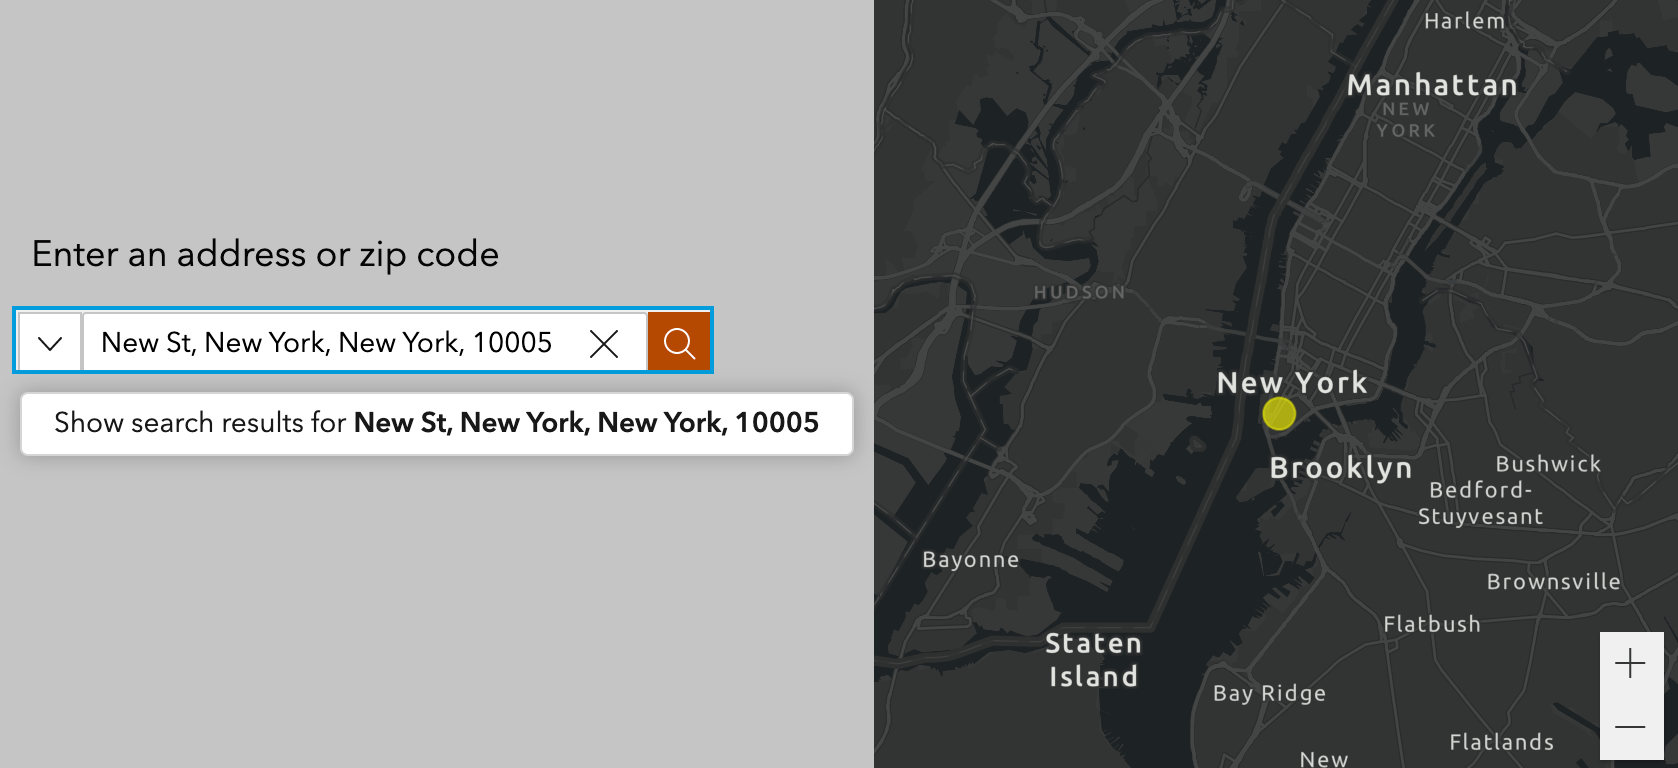
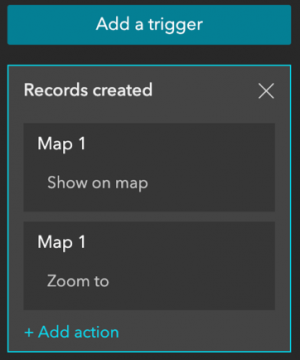
First, you can configure multiple search sources in the widget, including custom locators and layers. To find an address on the map, you must add the Records created trigger and make the map act on it such as zooming to and showing the place on the map. Keep in mind, you can search for more than one map.
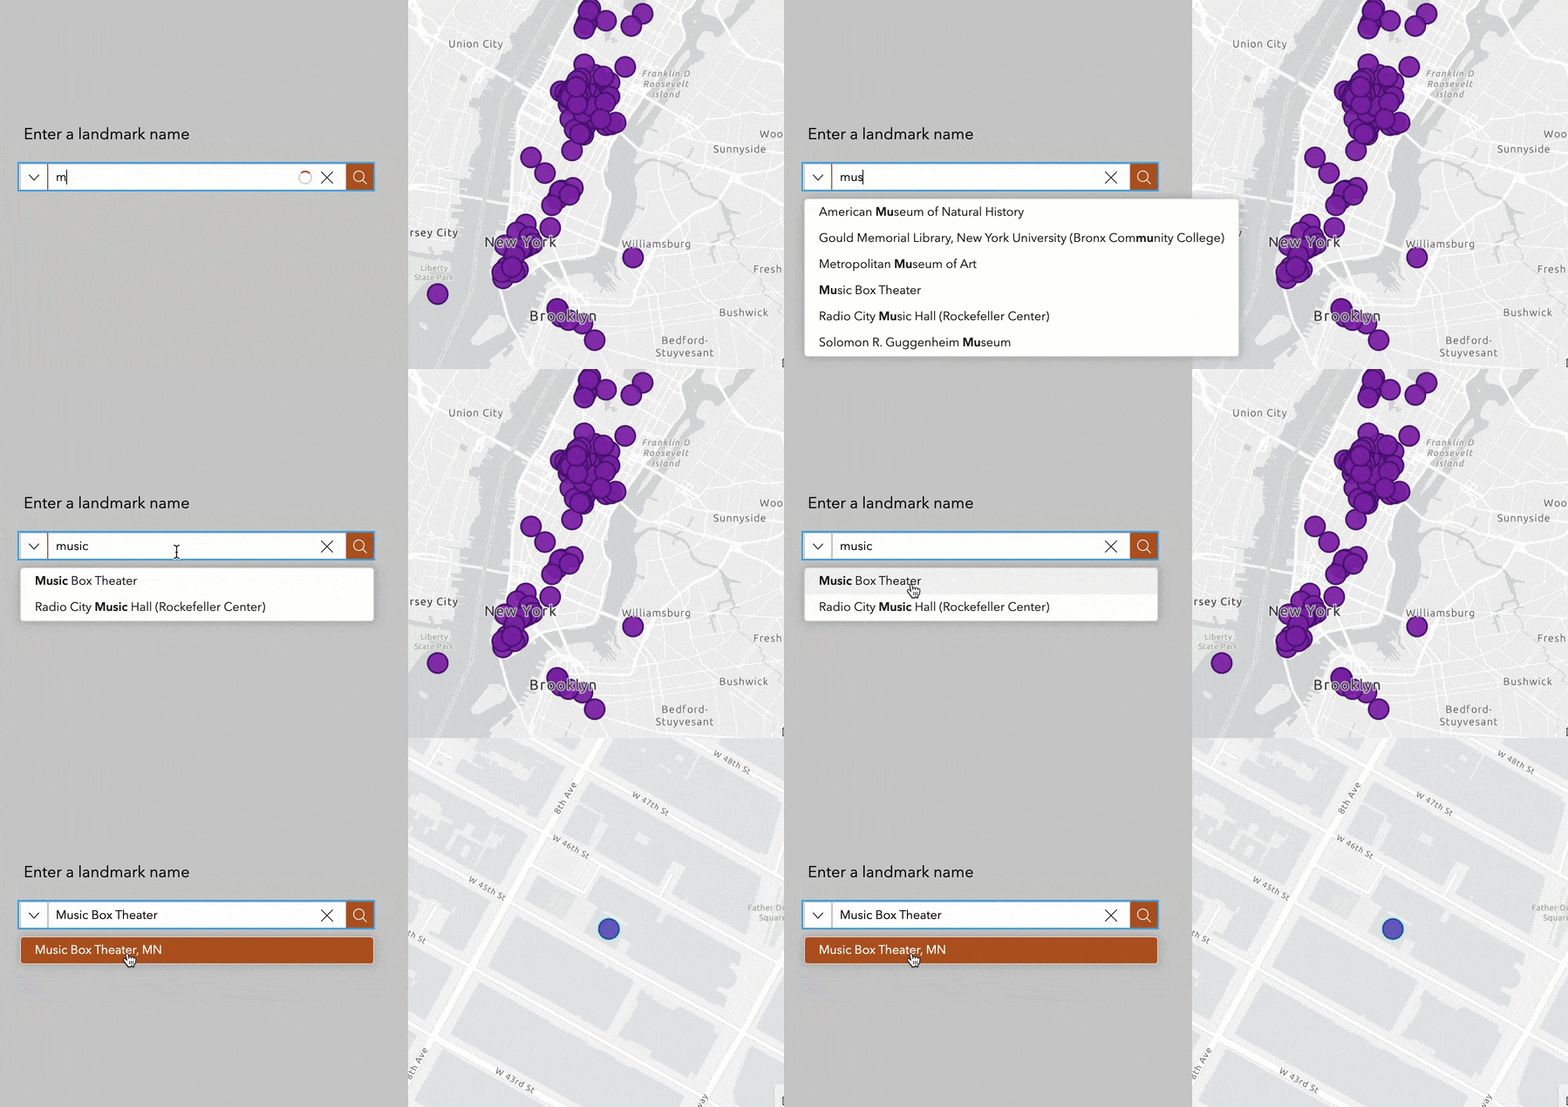
Like the search tools on the List and Table widgets, when a feature search is applied, the corresponding layer gets filtered. The following example demonstrates how to find and automatically zoom to the feature on the map. To do so, trigger the Zoom to action with Record selection changes and turn on the Auto select the first result option under Search result. When this option is off, you need to manually click the search result under the search box to zoom to the feature.
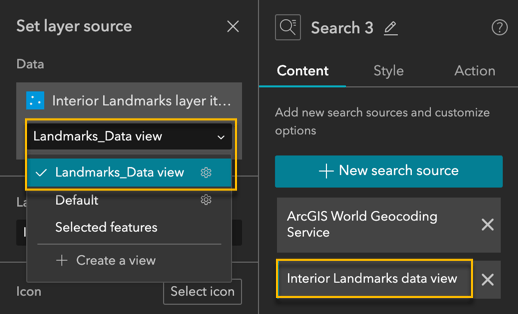
Note that in Map Viewer, Web AppBuilder, and the Map widget, the feature is selected instead of being filtered when searching a feature. If you prefer to selecting a feature, create a data view of the layer and use that view to search as shown below. Turn on Auto select the first result when applicable to avoid an extra click.
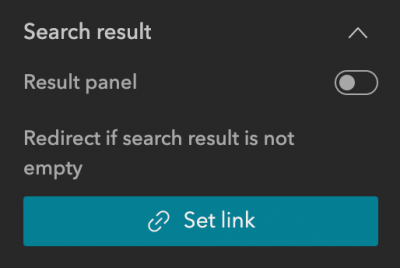
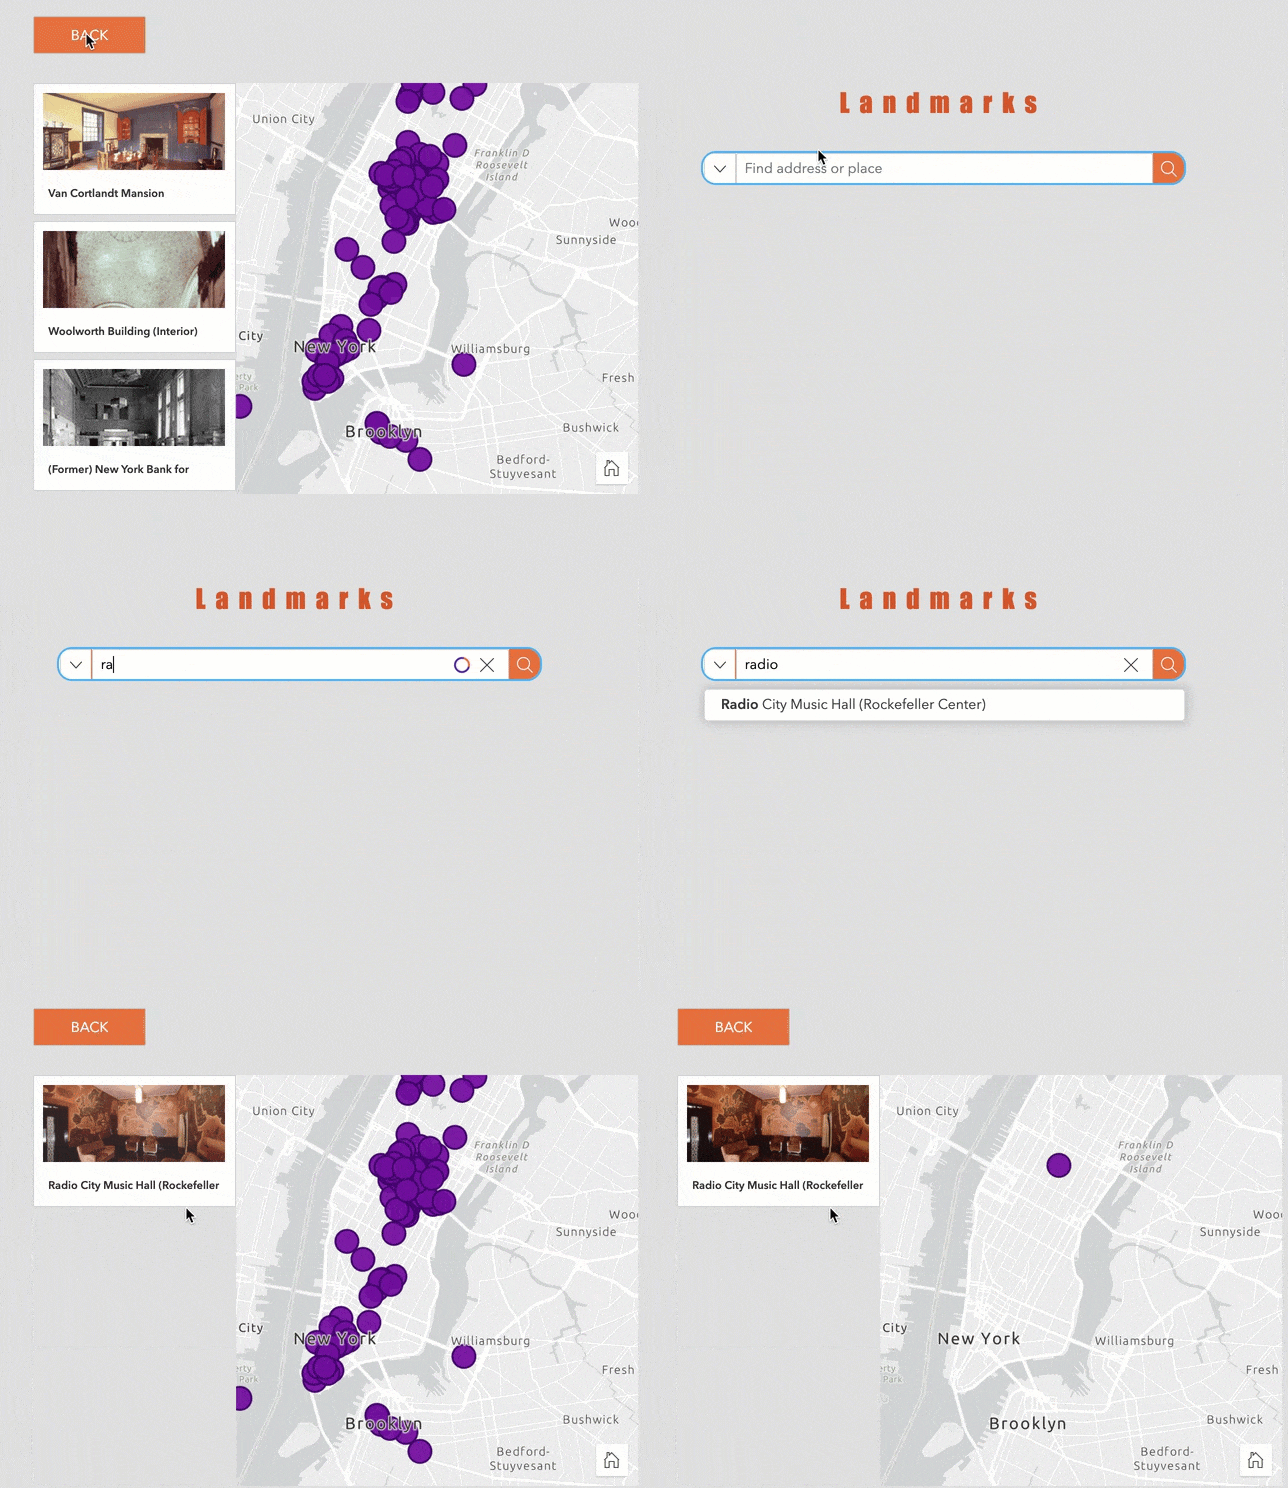
Second, you can find a feature not only on the map but also on other widgets like List and Table. Third, you can place it anywhere on the page – alongside the map, on the page by itself, or on the top of the page as a unified search tool. Lastly, you can have it show the search results on the other page on your web app by simply turning off the Result panel under Search result, then linking to the page as shown below.
The example below demonstrates a feature search on a list and a map from the other page.
Edit Widget (beta)
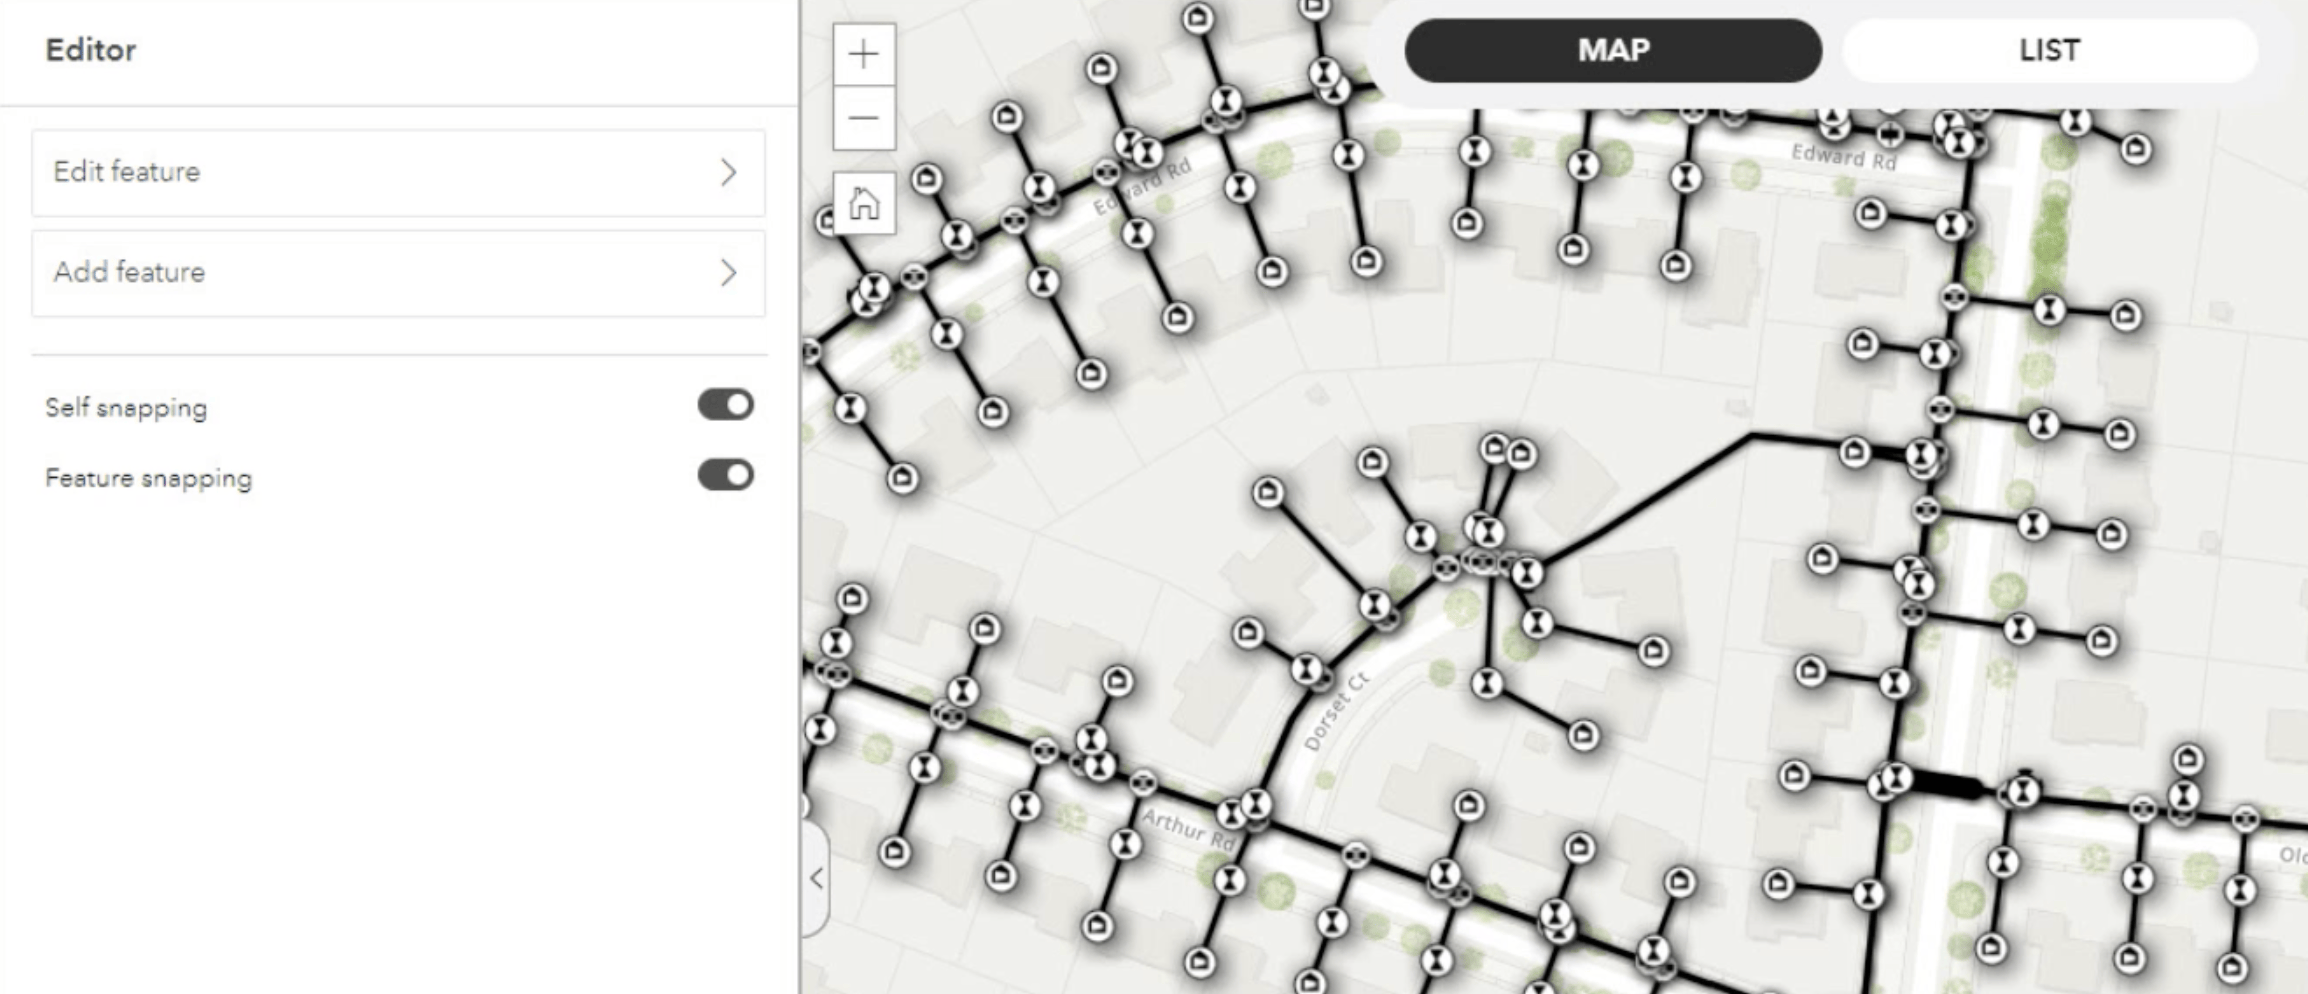
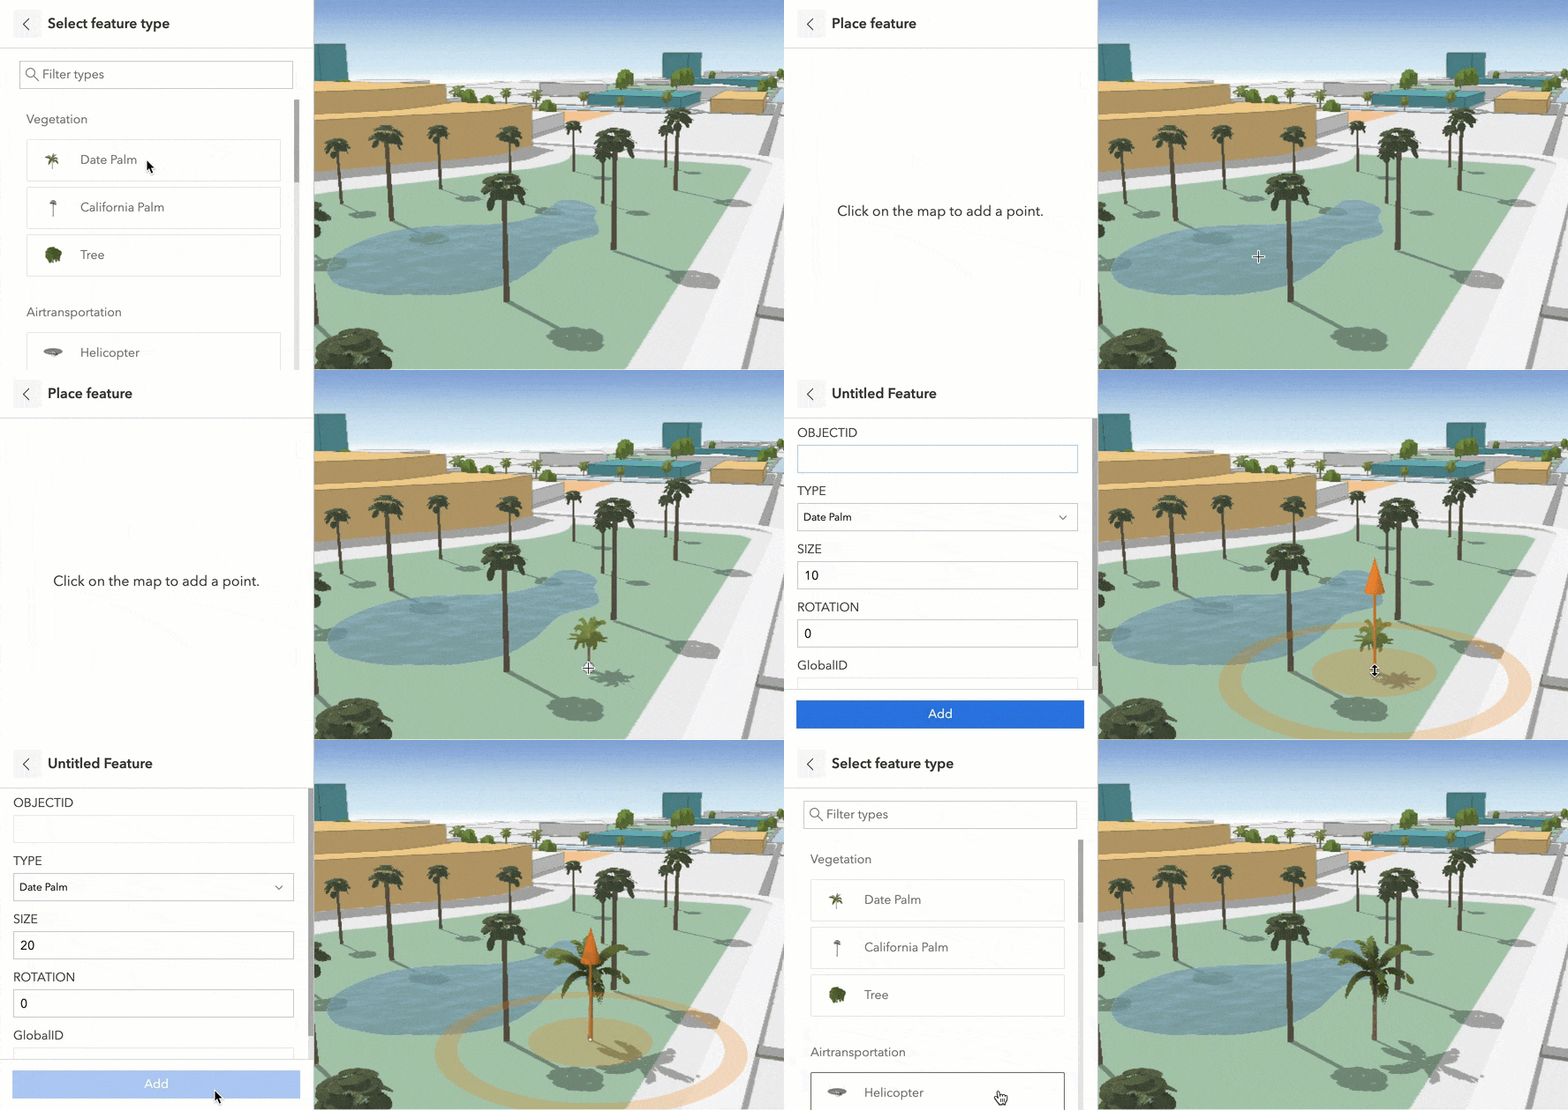
As a fundamental tool to engage through the web, users have been asking for the editing capability with or without maps. To accomplish that, the Edit widget provides two modes—Geometry and attribute and Attribute only. With Geometry and attribute, you must connect to a map to add, update, or delete a feature.
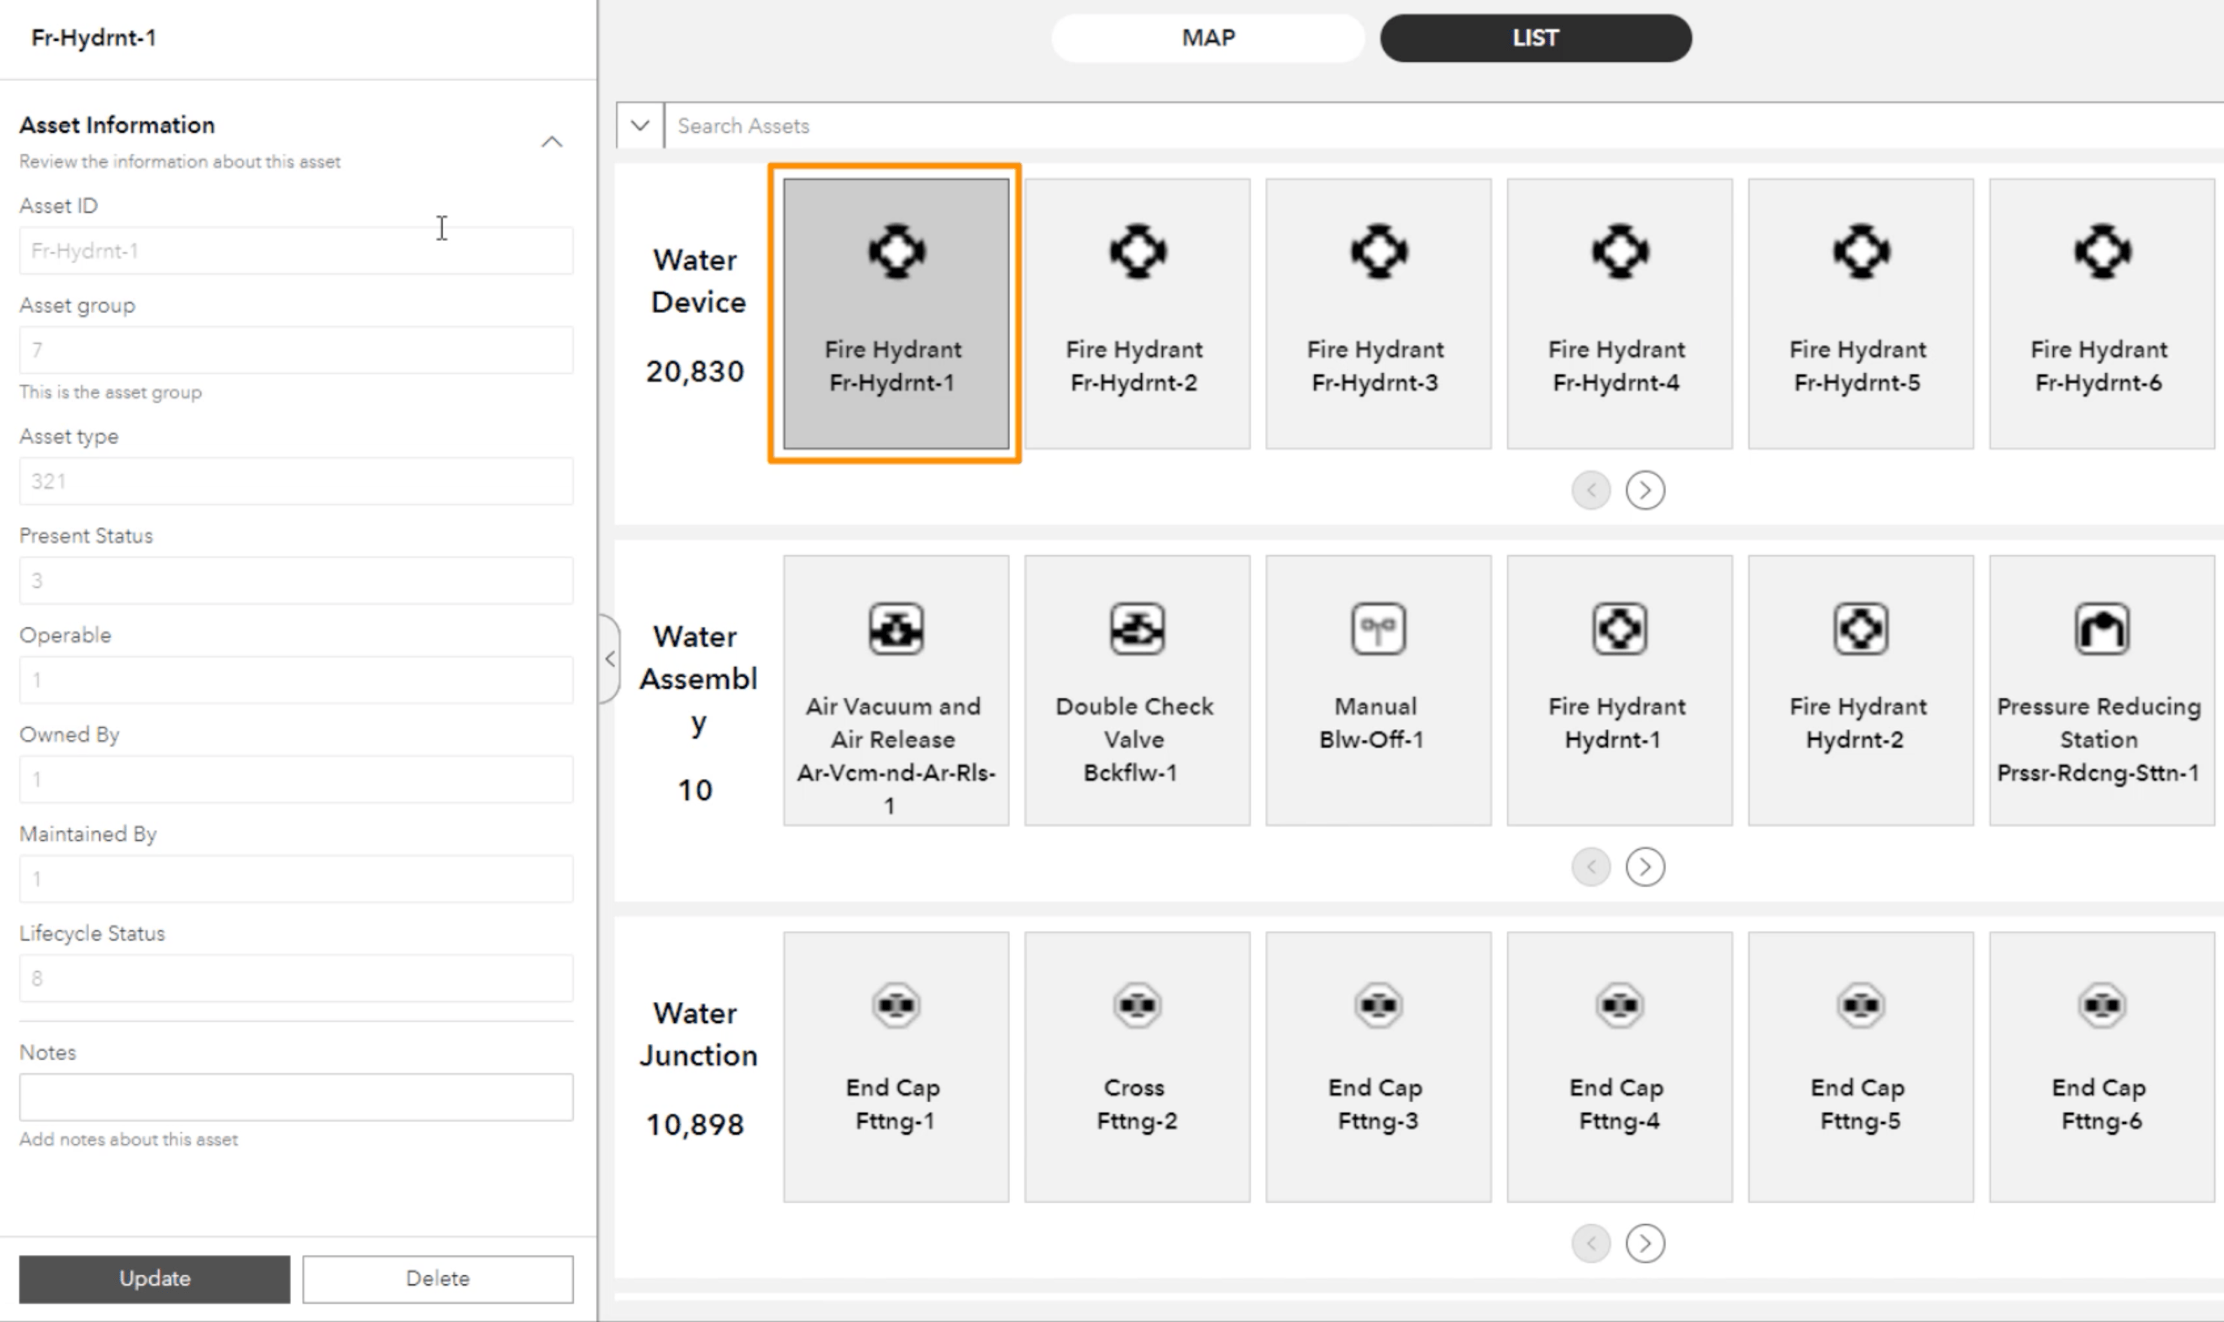
With Attribute only, you may update or delete the attributes of selected features or records from a list or table.
Next, isn’t it fun to add a palm tree to a resort on your web app? You are right! This example shows that the Edit widget works with 3D data as well.
Oriented Imagery Widget
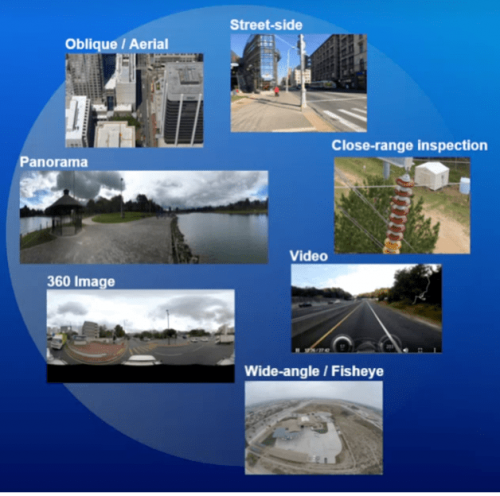
You may want to review asset inventory photos taken by field workers at a construction site or inspect a city’s assets like light poles on the street. You can do so using the Oriented Imagery widget. It allows you to interact with and visualize imagery that was taken from any angle—including oblique, bubble, street-side, inspection, and 360-degree images—in a 2D map or 3D scene.
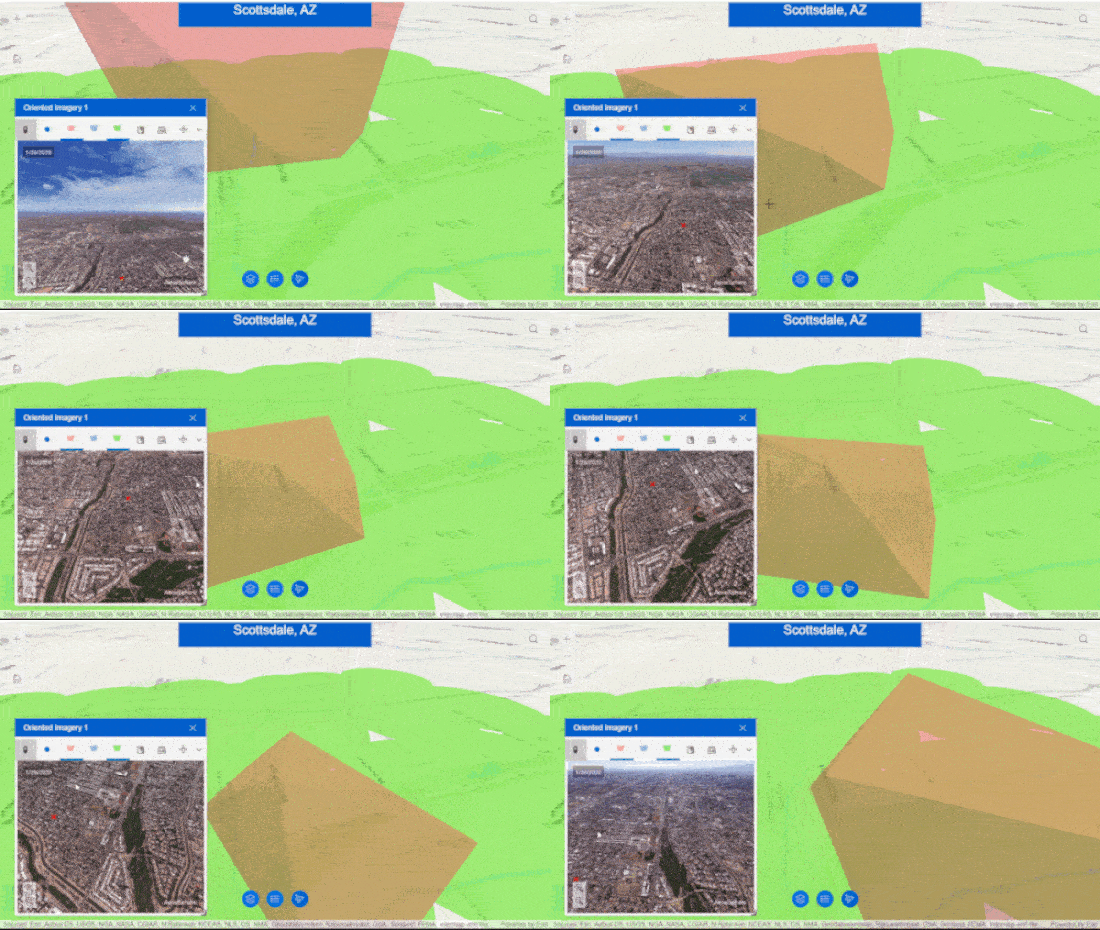
The following example shows the 360-degree view of Scottsdale in Arizona. The green area represents the imagery coverage (viewer) on the map.
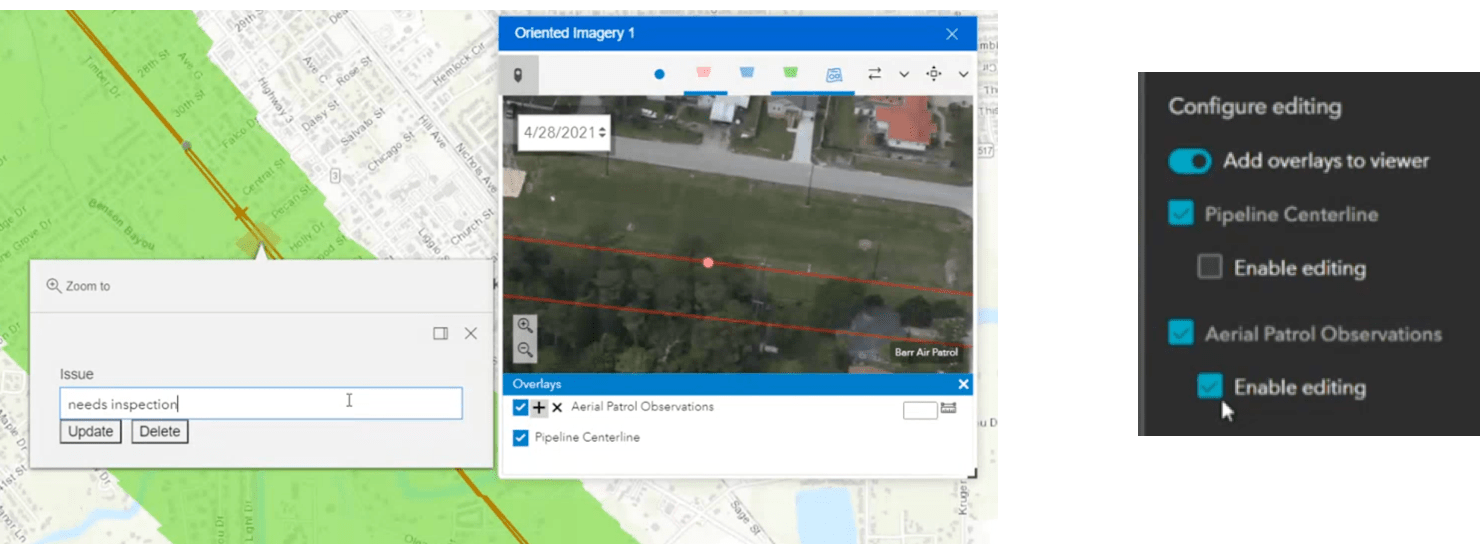
Further, you can add editable feature layers to the map as overlays, then enable feature editing within the imagery area (viewer) to add an aerial patrol observation point as shown below. You can also digitize an object, such as a hydrant, that can be viewed from any angle.
To use the widget, you must have an oriented imagery catalog (OIC) that’s published as an item in an ArcGIS organization.
Major Enhancements
Filter
With a new trigger of Data filtering changes in the Filter widget, you can now zoom and pan to features on the map after applying the filter. This is one of the most commonly requested enhancements from our users.
Chart
Below are the new line and area charts.
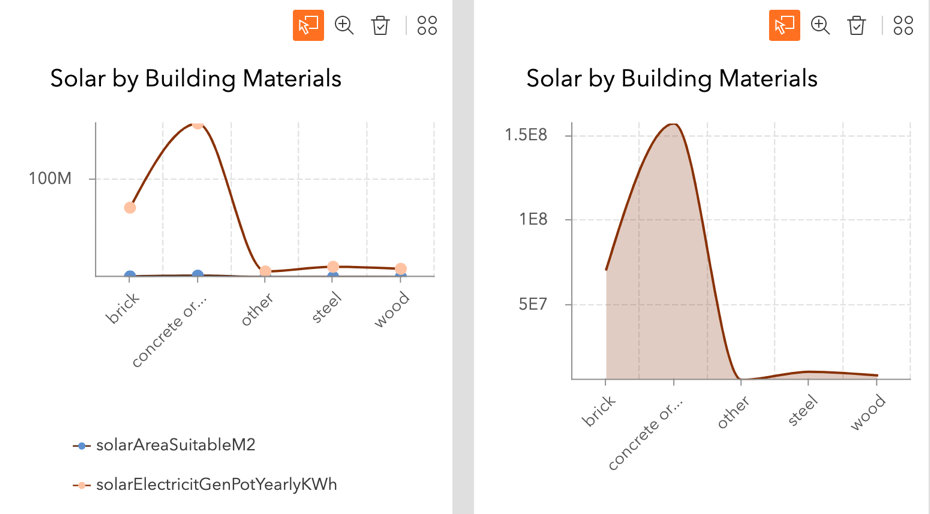
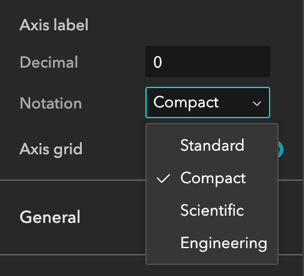
In addition, four notations have been added for displaying numerical values, including standard, compact, scientific, and engineering. In the charts above, the left chart uses the compact notation (100M), while the right chart displays the scientific notation (1E8).
Query
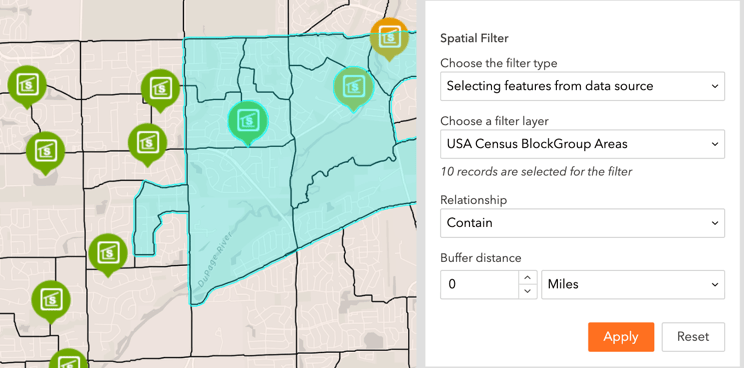
Besides the map extent and drawn graphics on the map, you can now perform a spatial query based on the geometry of selected features from a layer along with relationship rules like Intersect, Contain, etc.
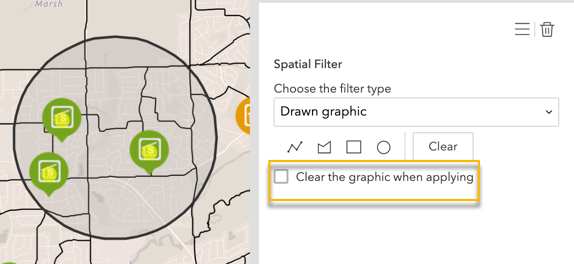
In the previous version, when you define a boundary of scope on the map using the Drawn graphic spatial filter, the graphic would not be visible on the map after executing the query. To help the users with further analyses by knowing the previous boundary, the graphic will now stay on the map until manually cleared. If you prefer the previous behavior for your web app, enable the option of Clear the graphic when applying before the execution.
In the meantime, you can customize results, such as which fields to display. You can also add meaningful names based on a custom expression from the data.
List
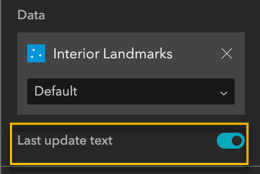
Sometimes it could be distracting to show the Last update label, indicating when the data was refreshed in the app, when data has the auto refresh interval. With this release, you can now opt to exclude it.
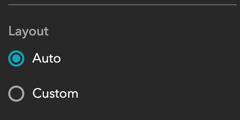
Also, it could be challenging to configure the layout nicely for each state—Regular, Selected, and Hover. The improvement we made in this release is to have Selected and Hover state layouts to automatically synchronize with the Regular state layout. This is now the default behavior. However, there could be situations in which you would like to arrange widgets differently in each state. To do so, switch to the Custom option under the Selected and Hover setting. You then have the same control as before.
Survey
Two new modes for surveys—Edit Mode and View Mode—have been added so you can edit and view existing survey records.
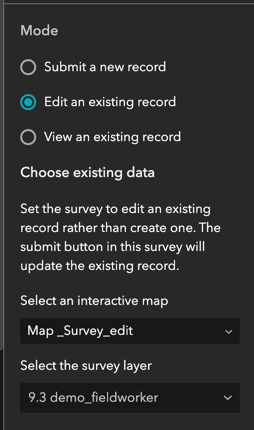
To make the edit and view mode work, you must select a feature from the survey layer on the map. Depending on how the survey form was created, this survey layer could be different from the source layer you submit a new survey record with. To locate the survey layer, click the form item in the survey folder under My Content.

On the form item page, you will see the survey layer listed under Layers. For this example, the survey layer is called “My Landmarks survey_fieldworker.”

Next, add this layer to a map, then use the map and the layer to work with the Survey widget in the edit and view mode.
Notes:
- Surveys created before version 3.9 of ArcGIS Survey123 will not work in the edit and view mode.
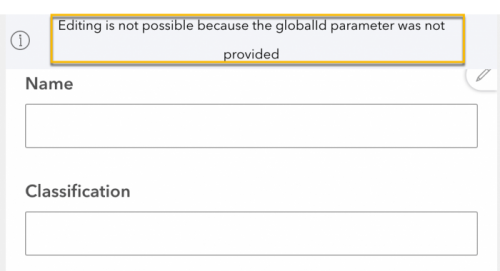
- When the Survey widget starts with the edit mode or view mode, you may see a message at the top of the empty survey record as highlighted below because there is no selected feature on the map yet. Once a feature is selected, the message would disappear.
Table
You can now use Table with 3D data as long as the scene layer has an associated feature layer, and have a better responsive display of tabs on mobile devices. Similar to the Edit widget, you can also specify which fields are editable.
Section
When there are many views in a section, it may take a while to load the app initially. This is because loading all the content in views could slow down the app. With the Lazy Loading option, the content in the view loads only when you switch to it, helping reduce the web app’s initial load time.
Templates
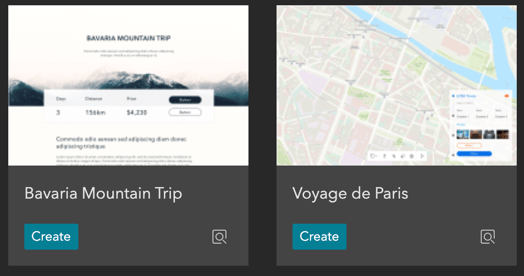
Voyage and Vacation are new default templates that use the Fly Controller widget in 3D maps. Voyage features immersive planned routes for tour attractions, and the Vacation provides an interactive trip event website. Further, check out their corresponding public templates for demonstration under the ArcGIS Online tab.
Window
There are two new window templates that deliver additional guidance, information, or data in a window.
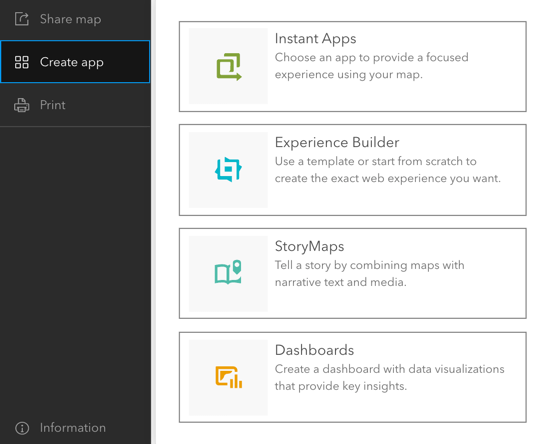
Lastly, you can create a web app with an auto-populated map directly from Map Viewer or a map or scene item page.
For more information, see What’s new in Experience Builder. Additionally, please reach out to experiencebuilder@esri.com for questions.
Thank you,
The ArcGIS Experience Builder team



In the YouTube demo you show the Fire Hydrant ID as the ID shown at the top of the edit widget. However, mine is defaulting to the ObjectID. How do you set which field is used as the Feature ID in the edit widget?
Hi Rob,
Thank you for your question.
The ID field displayed at the top of the Editor widget comes from an attribute field I have defined in the Display Field from the Layer Properties before publishing the service with ArcGIS Pro. For more information, see Set layer properties
does the list and table search tool also work in arcgis online?
Hi Rahmad,
Yes, they work in the online edition of Experience Builder at https://experience.arcgis.com.
When setting up a search widget to show results on a separate page, How do I get the map to automatically zoom in a select the feature?
Hi Anthony, you can add the “Data filtering changes” trigger from the Search widget and make the map take zoom/pan actions.