By Aileen Buckley, Mapping Center Lead
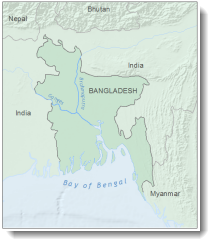
In a previous blog entry, I discussed some of the major design principles used in cartography, including figure-ground organization, which is the spontaneous separation of the figure in the foreground from an “amorphous” background. Cartographers use this design principle to help their map readers find the area of the map or page to focus on. One way to promote figure-ground organization is to use a “whitewash” effect in which the area that is not the focus of attention is slightly “washed out”, thereby drawing attention to the “figure”. The way this is done in ArcMap is to symbolize a polygon for the area outside the figure with a white fill and transparency.
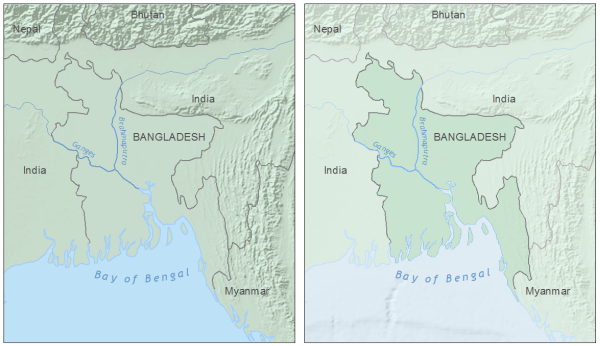
The map on the left has poor figure-ground organization. The map on the right uses a whitewash effect to promote this important design principle.
There are two ways to achieve this effect – the one you use will depend on your data. If you already have a feature class that includes polygons for the “figure” on your map as well as a polygon (or polygons) for the area outside the figure, then you do not need to make the “mask layer”. In the example below, the “figure” polygon is Bangladesh, but I have to use a mask polygon for the area outside Bangladesh in order to add whitewash to the ocean area as well.
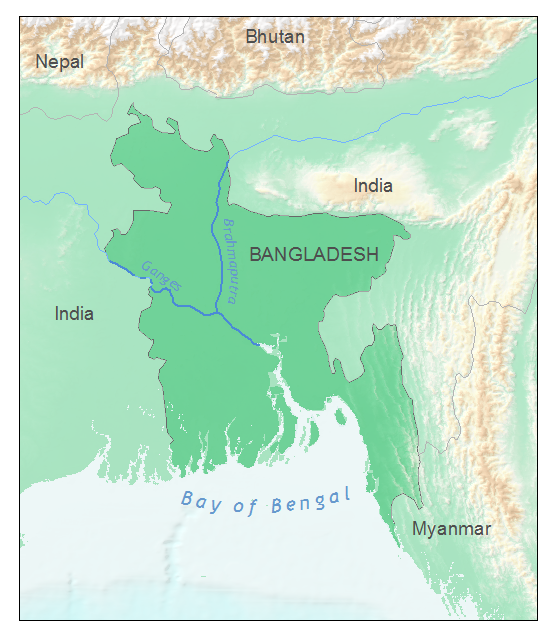
This example also shows how well this technique works when you want to provide some detail outside the area of interest – a nice alternative to simply clipping the map extent to the figure. For the map of Bangladesh, this allows you to see that the country as a whole is in a low-lying area, but its major rivers are being fed by runoff from mountains to the north and east.
Two steps are involved to create the whitewash effect:
- creating the mask layer (you may be able to skip this step, as noted above), and
- symbolizing the whitewash using a white fill and transparency.
If you have already have a feature class that includes a polygons for both the “figure” and the area outside, skip to the bottom of this blog entry to read about the alternative approach.
Creating the mask layer
To create the mask layer, you will need a polygon for an area slightly larger than you want to show on your map. You’ll then erase the area that is the figure from this polygon. There are many ways you can do this – I find that this is one of the easiest:
- In Layout view, double click the data frame to “focus” it.
- Using the New Rectangle tool on the Draw toolbar, draw a graphic that fills the extent of the page.
- Switch to Data view and make the rectangle a little larger than the page extent using the handles to pull box out on opposite corners.
- Switch back to Layout view.
- Right click the data frame in the table of contents and click Convert Graphics to Features.
- Name the output feature class MapExtent and check the option to “Automatically delete graphic after conversion”.
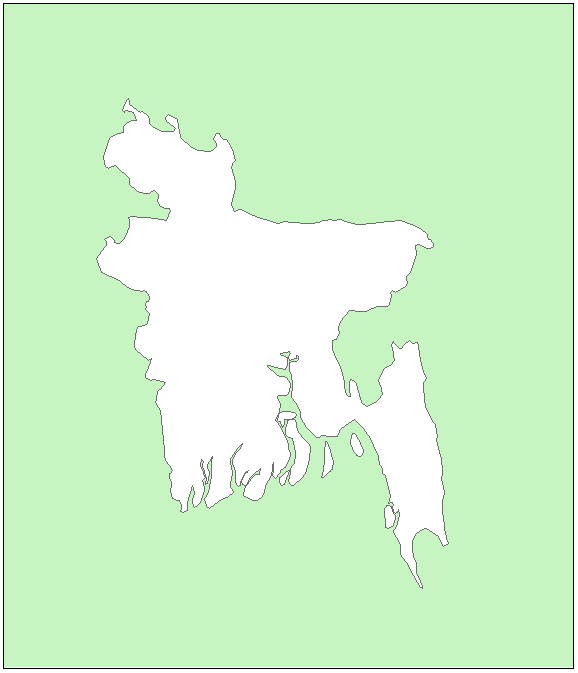
- To remove the figure polygon, use the Erase tool in the Overlay toolset of the Analysis toolbox with Temp as the Input Features and the polygon for the area that you want to be the “figure” (in my case, Bangladesh) as the Erase Features, and name the output feature class Whitewash.
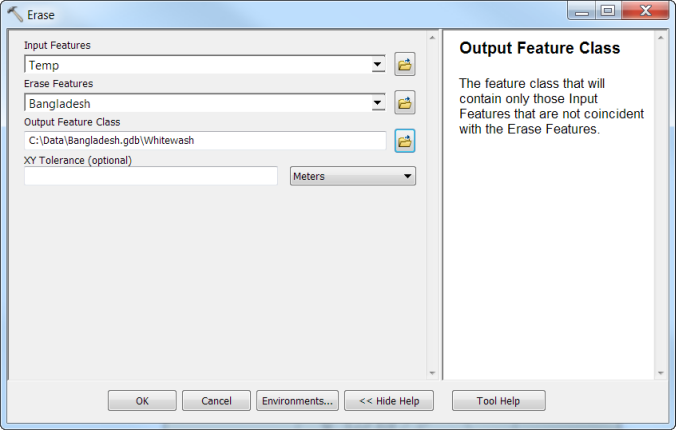 The result will include only the area outside the “figure”.
- Remove Temp from the table of contents.
Symbolizing the Whitewash
Now you’re ready for the last step in creating the whitewash effect, which is to set the symbology.
- Right click the Whitewash layer in the table of contents and click Properties.
- On the Symbology tab, use the Features > Single Symbol renderer and click the symbol patch to
- On the Display tab, set the transparency to 60%.
- Click OK.
- Now move the Whitewash layer above all others in the table of contents to see the results.
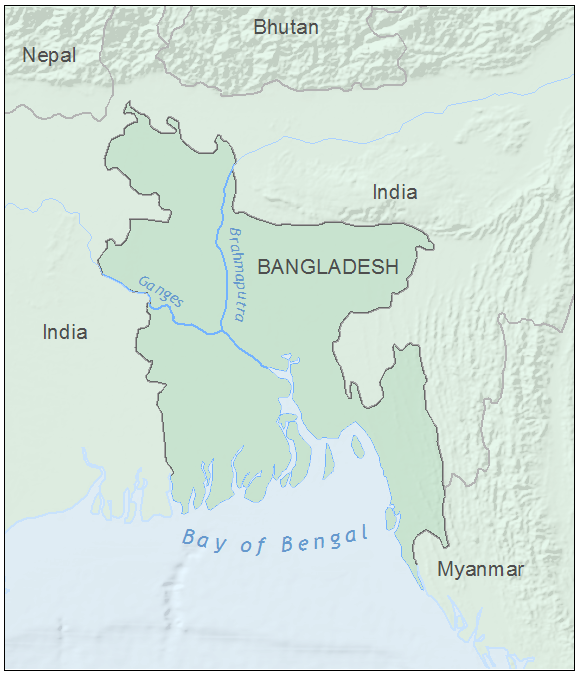
By “washing out” the area outside the figure, the whitewash effect directs the map reader’s focus to the area that’s important. An added advantage of this method is that it shows your readers that the world doesn’t end outside the main map area.
Creating the whitewash when you already have figure and ground polygons
- Right click the layer in the table of contents and click Properties.
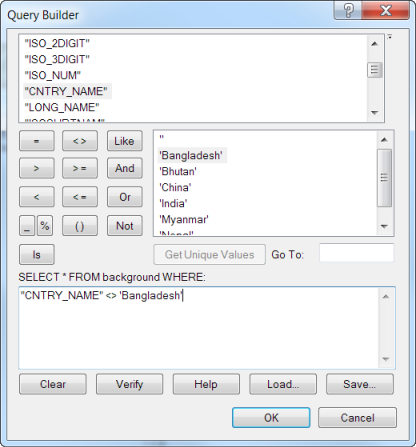
- On the Definition Query tab, use Query Builder to show only the features that are the figure. The definition query for my layer was [CNTRY_NAME] <> “Bangledesh”, since there is Name attribute that identifies Bangladesh.
- On the Symbology tab, use the use the Features > Single Symbol renderer and click the symbol patch to
- On the Display tab, set the transparency to 60%.
- Click OK.
- Now move the Whitewash layer above all others in the table of contents to see the results.
- If you also need to display the “figure”, copy and paste this layer in the table of contents (right click the layer, click Copy, right click the data frame name and click Paste Layer(s). Follow the steps above except use the definition query to only show the figure polygon (e.g., [CNTRY_NAME] = “Bangledesh”) and symbolize that polygon as you wish.

Article Discussion: