By Aileen Buckley, Mapping Center Lead
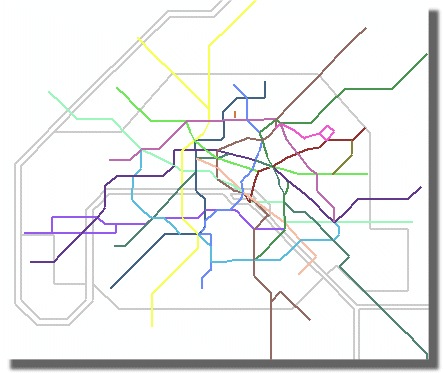
The illustration at left shows a map of the Paris Metro system (RATP). The routes are depicted in a schematic view and this kind of map is challenging to create because multiple routes may share the same path, for example multiple bus routes along a single road. When this happens, the coincident routes are offset in a fashion that makes it possible to understand the path each route is taking. When using ArcMap and line features for the routes, the coincident features draw on top of one another, making it difficult to visualize.
The RATP image is a reduced-size version of a map that was created with the ArcGIS Schematics extension. The ArcGIS Schematics extension provides a sophisticated data model and a comprehensive set of tools for creating, managing, analyzing, and displaying complex networks. Perhaps less well known is the fact that it contains tools to create custom schematic layouts. You can use ArcGIS Schematics to create maps for any linear network that you store as a geometric network or as a network dataset with the ArcGIS Network Analyst extension. I created the following workflow for a simple bus route map, but you could use it as a starting point for your own route mapping project.
1. Create the geometric network using your routes The geometric network data model has been available with the geodatabase since it was first released, and the tools to create and manage them are available with the core ArcGIS desktop software.
- If you are modeling a transportation network, include stops, stations, and terminals as junctions.
- Use ArcMap to symbolize the features as you want them to appear in the schematic diagram you are going to create.
- Save the map document, making sure that the geometric network junctions are loaded as well. This document will be used as the source for the schematic diagram.
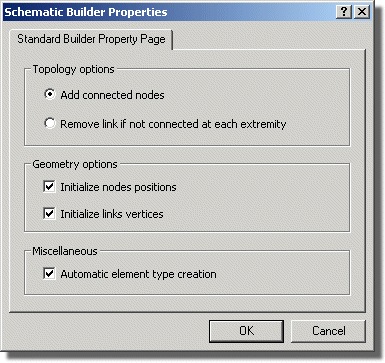
2. Create the Schematic Dataset You will need to invest some time with ArcGIS Schematics tutorials and documentation to familiarize yourself with the product and the various toolbars, interfaces, and dialogs which it contains. Even though I am quite familiar with ArcGIS, it still took me a few days to get fully acquainted with ArcGIS Schematics. The rest of this entry is mainly intended to show you where to look and what things are called, hopefully making your learning curve with Schematics shorter than mine. ArcGIS Schematics has the ability to create schematic diagrams based upon three different data models: the Standard Builder, which uses a geometric network, the Network Dataset Builder, and a Custom Query Based Builder, which uses non-spatial data. I used the Standard Builder for this map because I’d already created a geometric network from the bus routes. Create a new Schematic Dataset in the root of your geodatabase. Then right-click on that database and choose Edit Project. The ArcGIS Schematics Designer will open where you can define the parameters of the schematic diagram(s) you will want to create. However, the first time you open the project, the Diagram Type Assistant interface will launch. There are two Schematic Builder Properties which you must set if you want the schematic layout to follow the street network and copy the symbology you have set in the map document. On the Name/Builder tab, near the bottom right corner, click on the Schematic Builder Properties button. Check on both of these settings:
- Initialize links vertices
- Automatic element type creation
3. Create the schematic diagram The functionality for steps 3 and 4 is included as part of ArcGIS 9.2 Service Pack 4, and is not in any earlier releases. In ArcMap, open the original map document which contains the route symbology you want to use. At this point all of the routes are still drawn as coincident features directly on top of the roads.
- Select all of the routes and bus stops.
- On the Schematic Toolbar, click ‘Generate New Schematic Diagram’
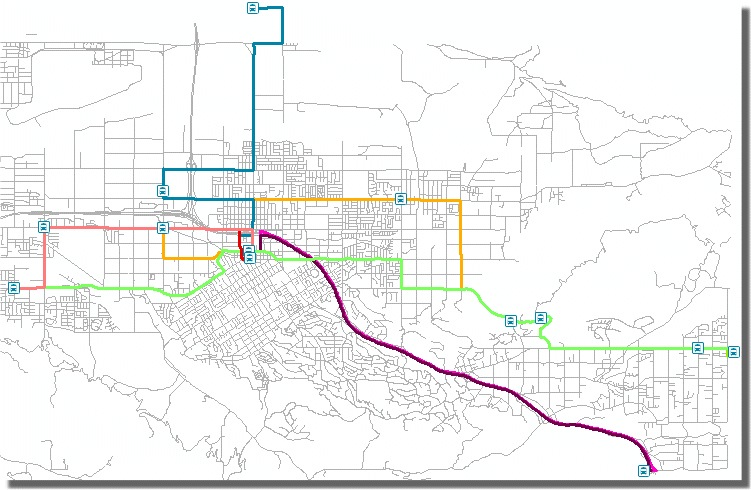
ArcGIS Schematics maintains a dynamic geodatabase-level link between your data view and the schematic diagram. This allows you to propagate changes between the two visualizations. In the example shown here, I selected the entire bus route network in order to create a map showing the all of the routes within Redlands. You can use the same workflow to select only single routes, and generate a new diagram for each one if you want to create individual route maps. Initially, the schematic diagram will look exactly the same as the original map, i.e., all of the routes will be drawn on top of one another.

- Use the Schematic Editor Toolbar to modify the diagram properties as required. For this example, I used the schematic Layout Task: Geo – Partial Overlapping Links, then clicking the Layout Properties button (far right) I set an offset value of 50 meters to get the routes to appear as shown below.
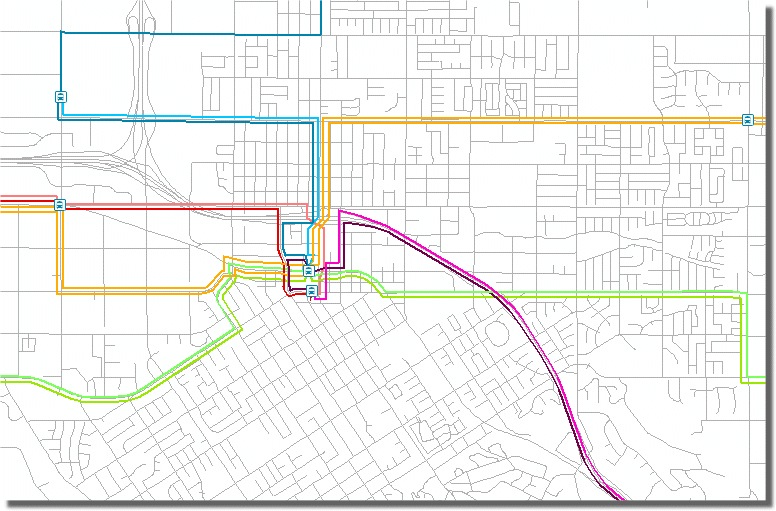
You may also choose to use this toolbar to begin some of the cartographic finishing which might be required. This is optional: keep in mind that the diagram is an independent graphic document, you can also use standard ArcMap layer properties or cartographic representations to edit the feature symbology once you export the diagram to the geodatabase.
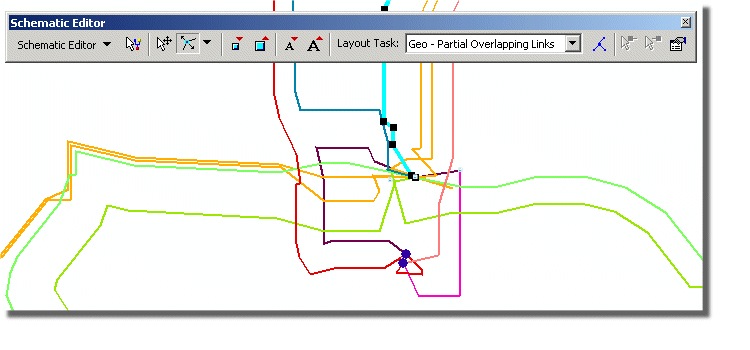
4.Export the diagram At this point you’ve created an independent diagram of the route network, but not any new data. The schematics diagram is only available for viewing with the ArcGIS Schematics viewer or within a map document. If you want to use the layout as independent data within ArcMap, you need to export the data using ArcCatalog. In Step 2, when you set the Automatic Element Type Creation, this enabled the schematic diagram function to create a set of tables it uses to generate and display the diagram. If you want ArcGIS Schematics to automatically add all the original feature attribute fields to the element types, you will need to switch an application registry key. Instructions on how to do this are contained in the Esri support site article #34089. In the ArcCatalog Tree, right-click on the Schematic Diagram you want to use, and export it to a geodatabase.
5. Perform additional cartographic finishing Now you can convert the existing symbols into cartographic representations. This will allow you to further enhance the symbology, as well as store the symbol data within the geodatabase. For example, you may wish to apply a geometric effect to smooth the lines without editing the underlying vertices, which might be important if you wish to maintain the features with their original network connectivity. Another example would be transit stations data that contain complex point marker symbols.
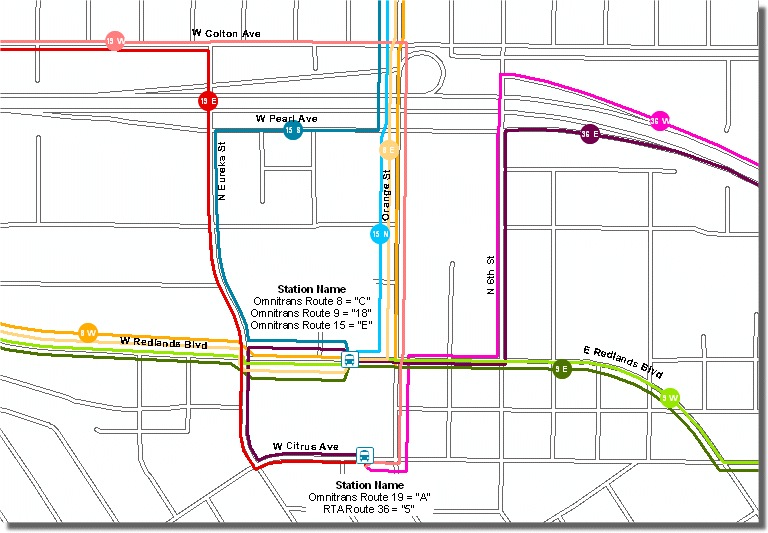
Again, the steps outlined above are intentionally brief, and are intended only to provide you with a basic workflow that you can use to create a route map. I should make clear that you will need to invest some hours to familiarize yourself with ArcGIS Schematics. However, once you have surmounted this one-time learning curve, you will have the ability to automate the creation of route maps without having to manually edit multiple linear features.

Article Discussion: