This article includes schedule information such as dates, release numbers, or scope that could change without notice. Customers and partners are advised not to make business or purchasing decisions based on such forward-looking statements.
ArcGIS Business Analyst applications help organizations make informed decisions. Due to the impacts of COVID-19, our team has been working remotely to ensure the safety and health of our team members. In our work and yours, remote work has heightened the importance of streamlined workflows to work better together.
For the upcoming April 2021 release of ArcGIS Business Analyst Web App, Community Analyst, and ArcGIS Business Analyst Mobile App, our team focused on making it easier to share your analysis output and use data within your organization. (Please note this blog covers Business Analyst applications for the Online deployment. For the on-premises version of the web and mobile app available through ArcGIS Business Analyst Enterprise, the following changes will be included in a future release, tentatively scheduled for May 2021.)
The following includes some of the features in the upcoming April 2021 release:
- New ArcGIS Dashboards workflow
- Improved Custom Data Setup
- Curating content
- Support for dark mode in the mobile app
- Data updates
New Dashboard Workflow
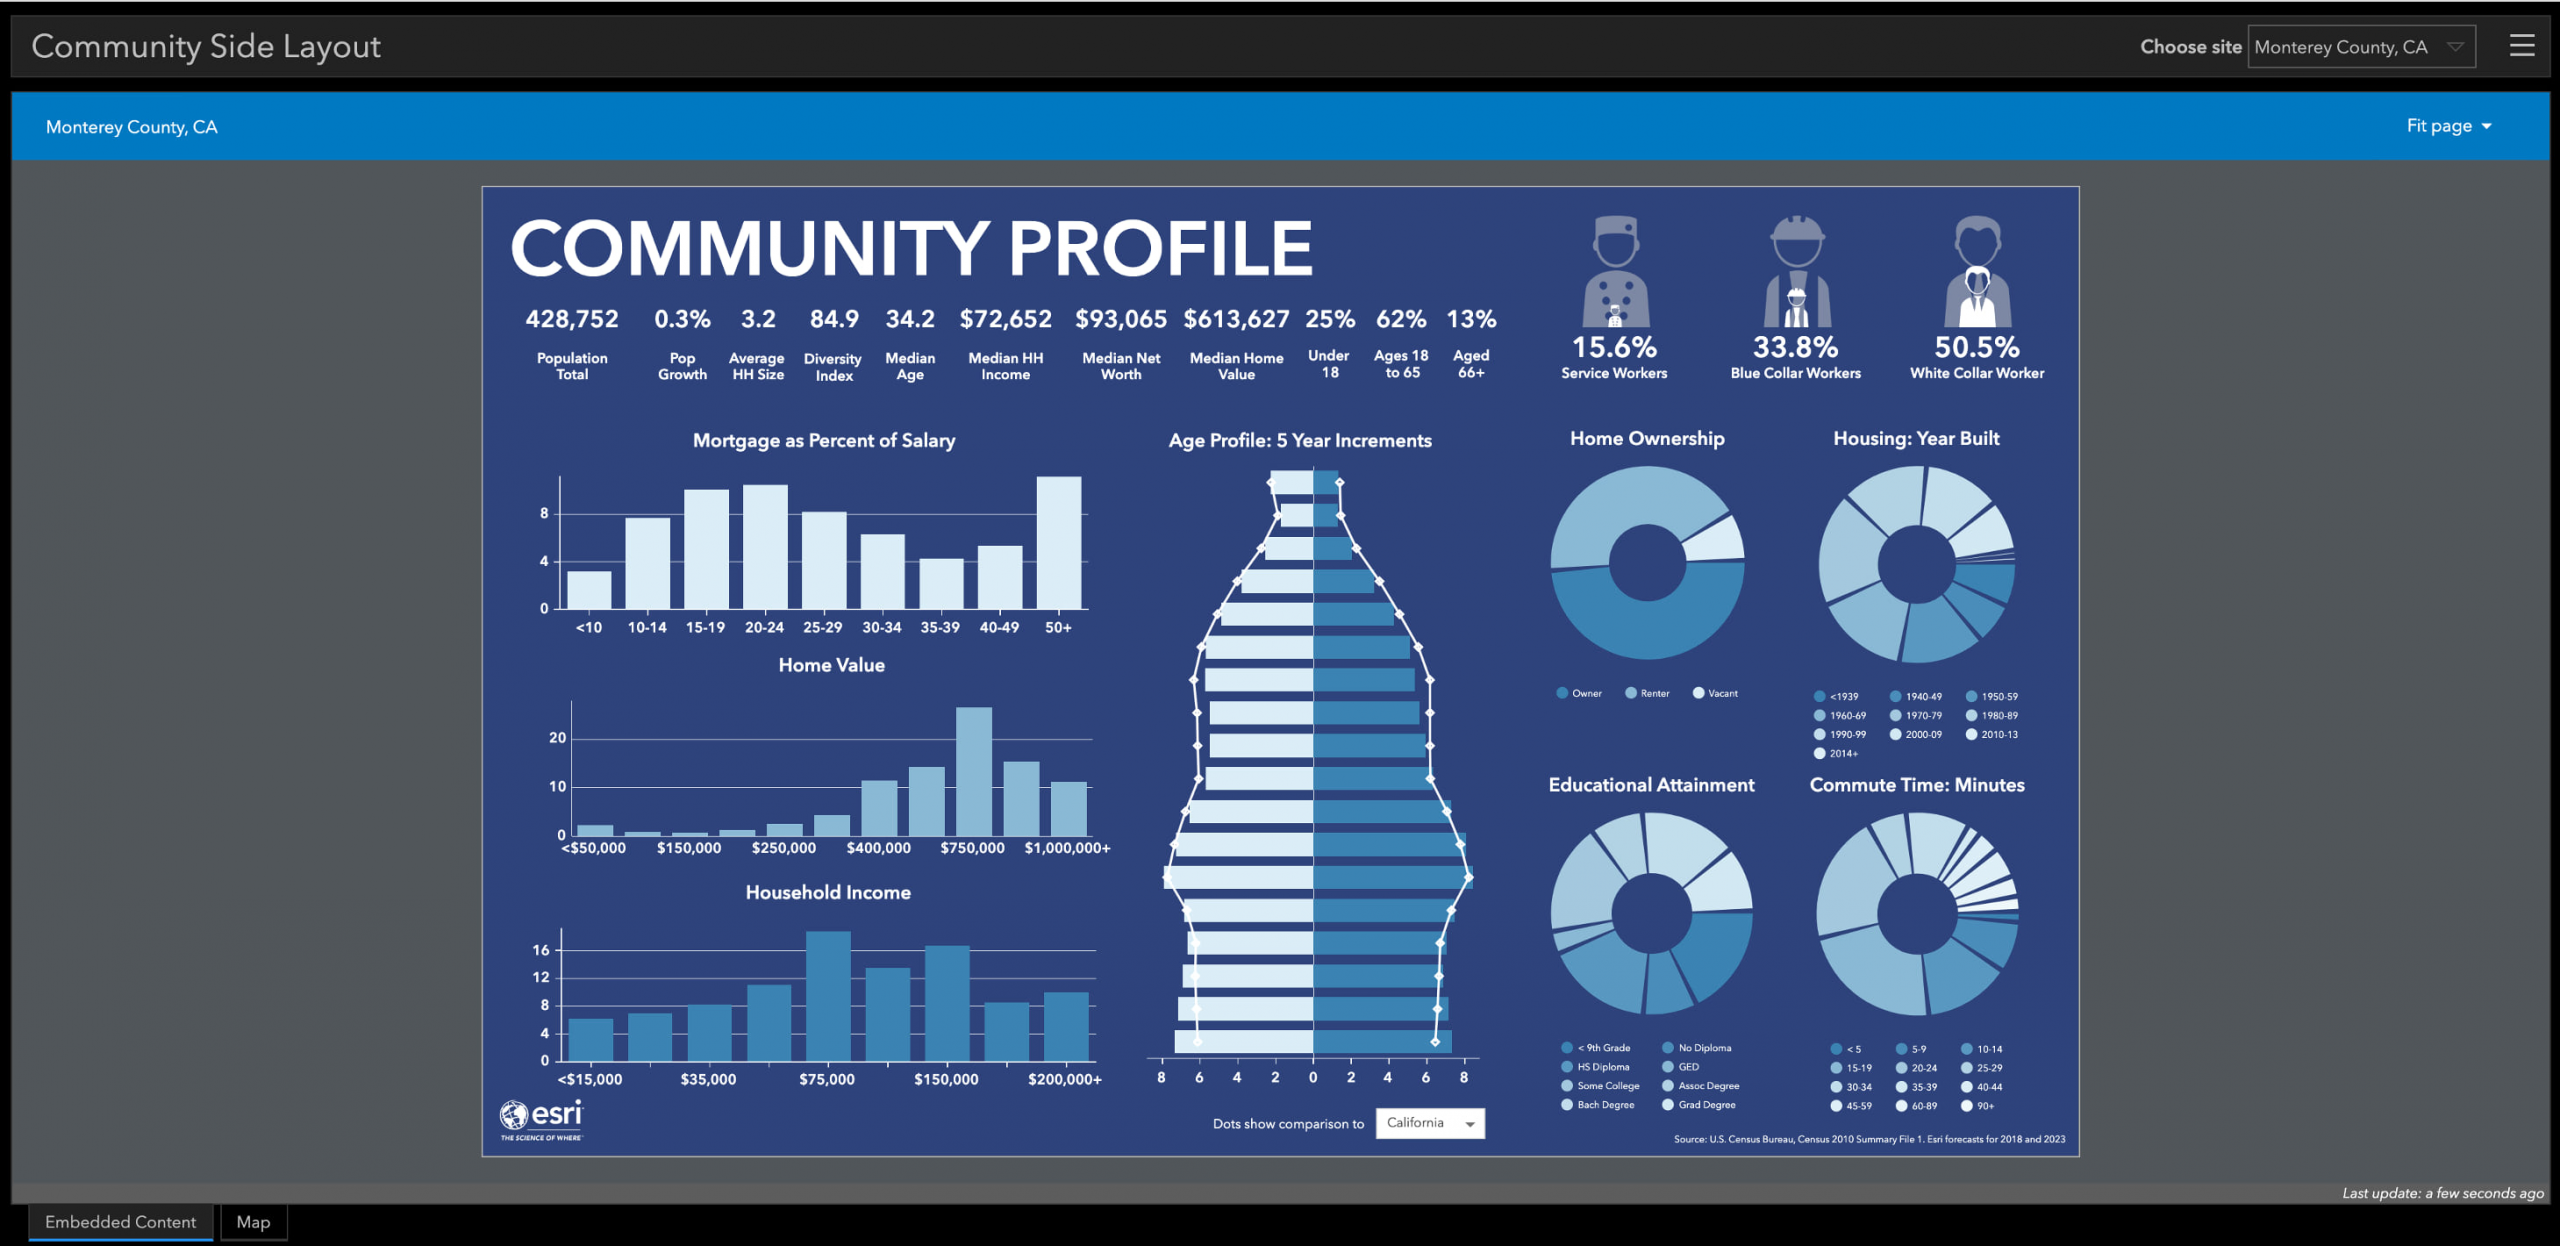
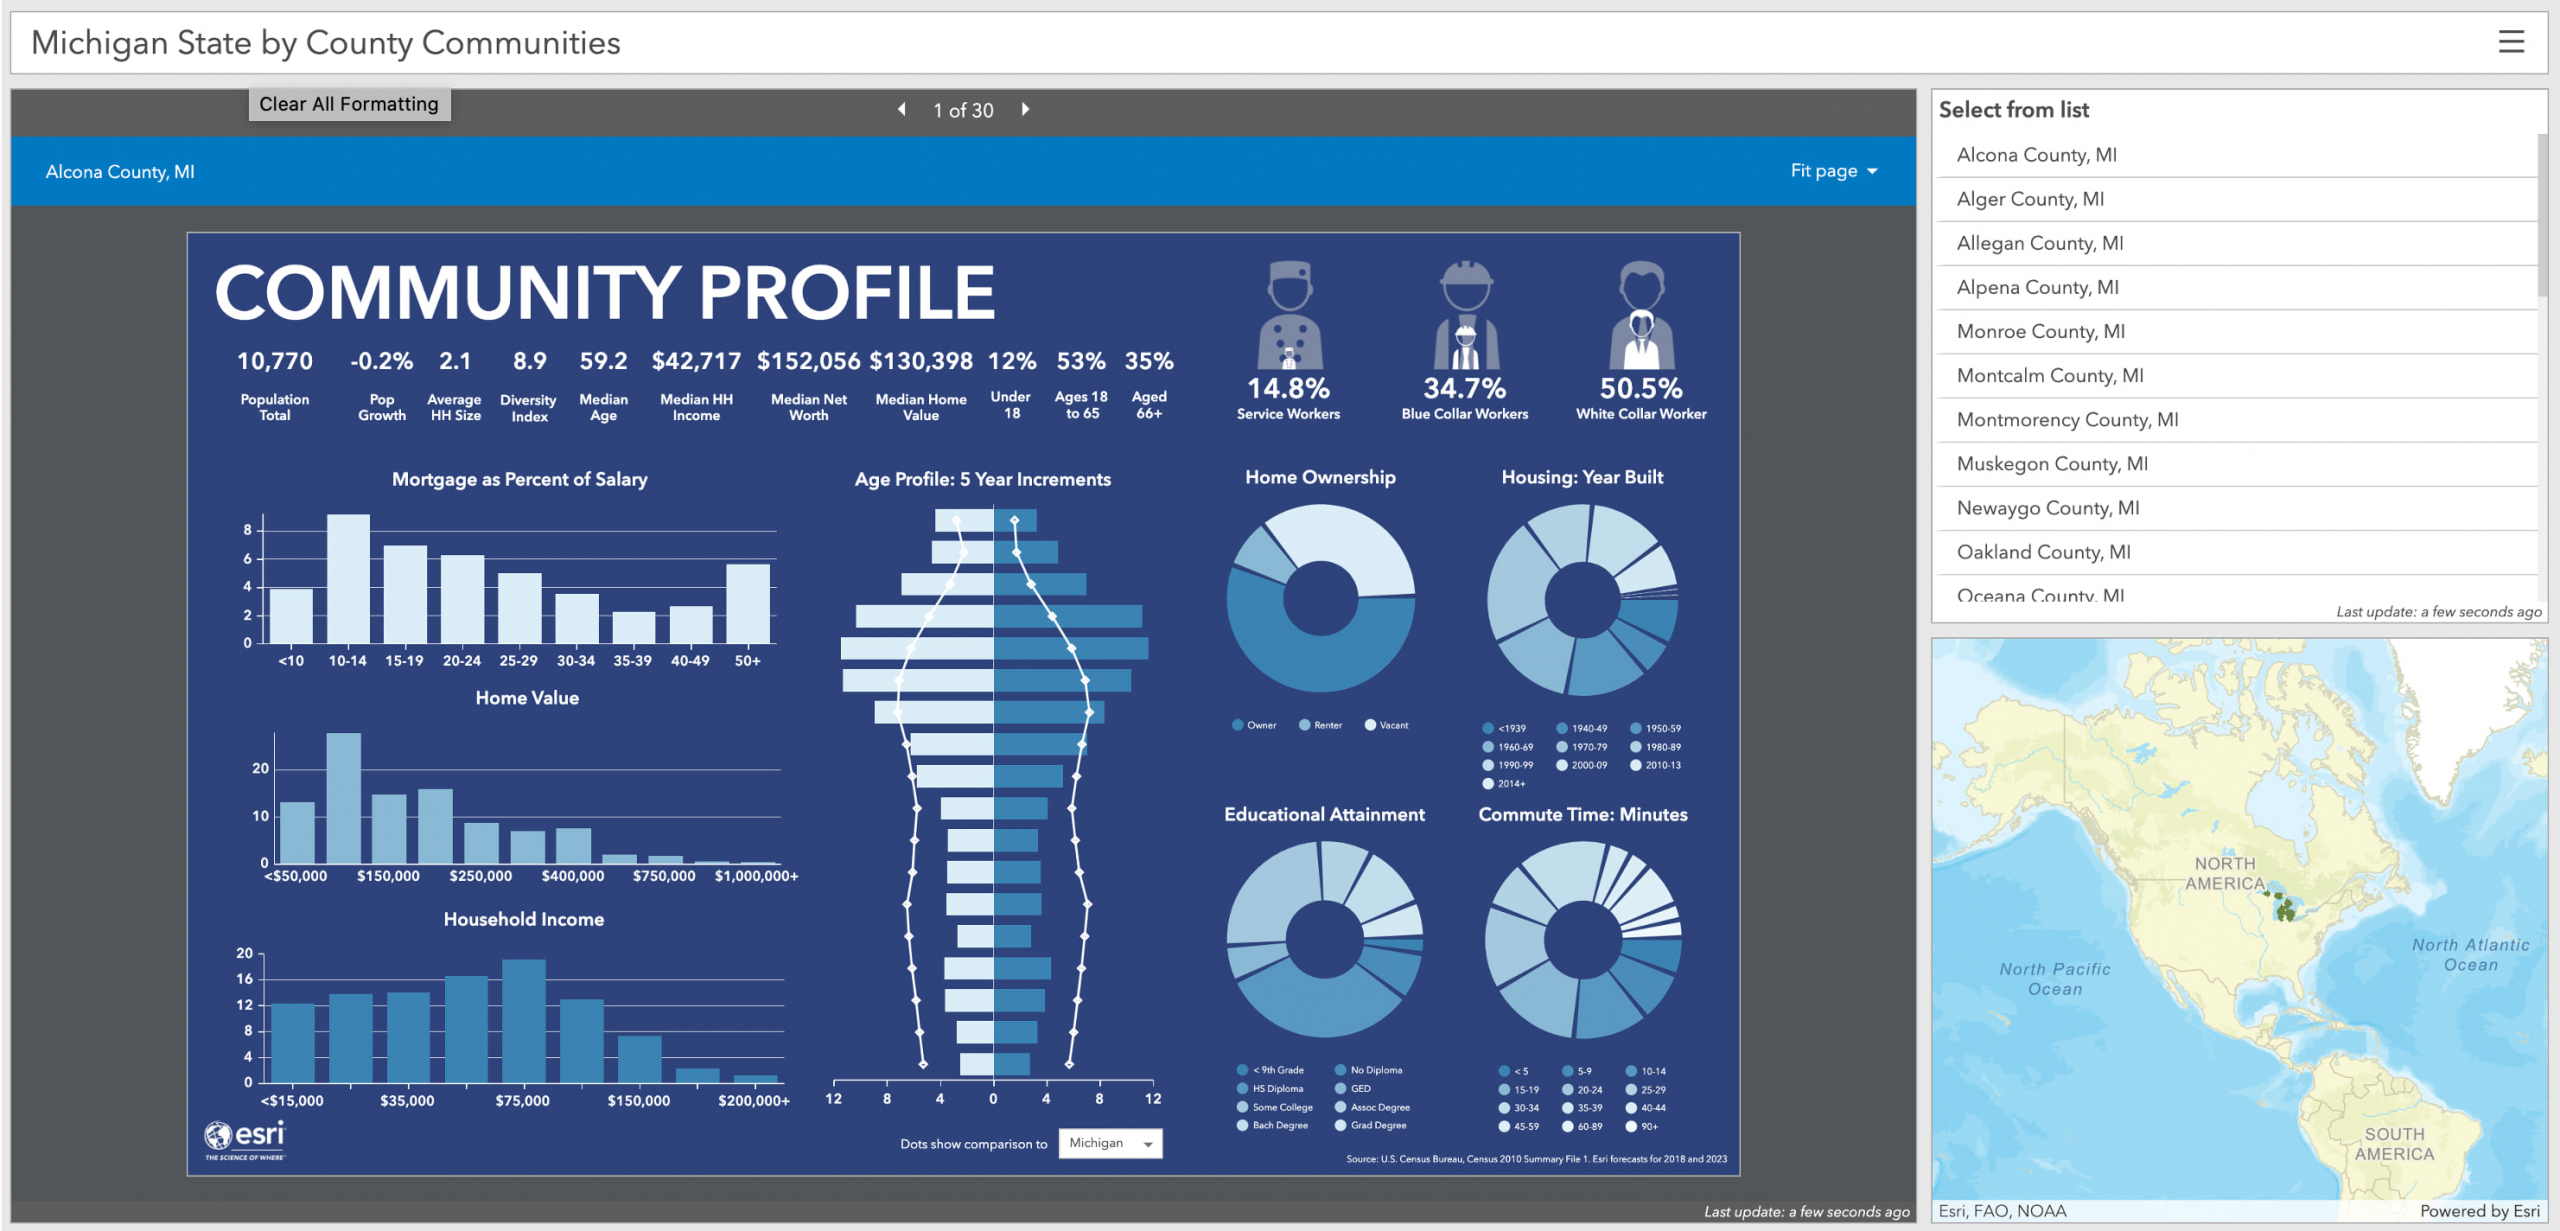
Many of our customers have seen and requested integrations of infographics to ArcGIS Dashboards. For example, you may want to create a dashboard that lets you view all the key demographics for every county in your state. This can be done by creating a dashboard that includes an infographic for every county, but it requires advanced customization within the ArcGIS ecosystem. Our team wanted to explore ways to make this process quick, easy, and fun for all users regardless of your skill level.
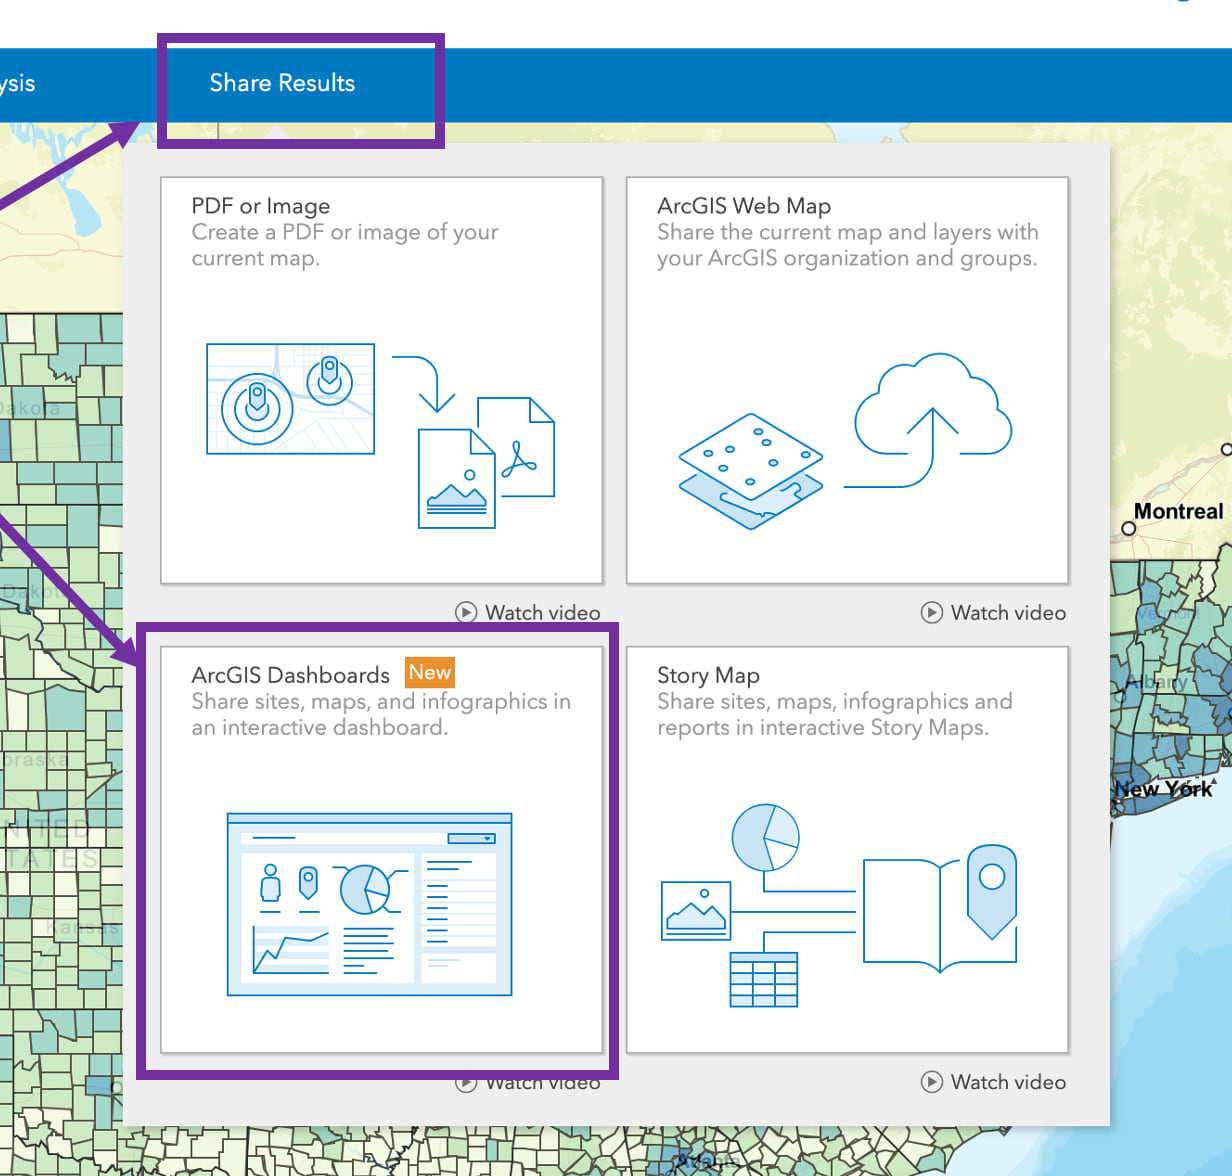
In the upcoming release, you will see a new option “ArcGIS Dashboards” under Maps > Share Results. This new workflow will allow you to add sites, maps, and infographics in an interactive dashboard within a matter of minutes.
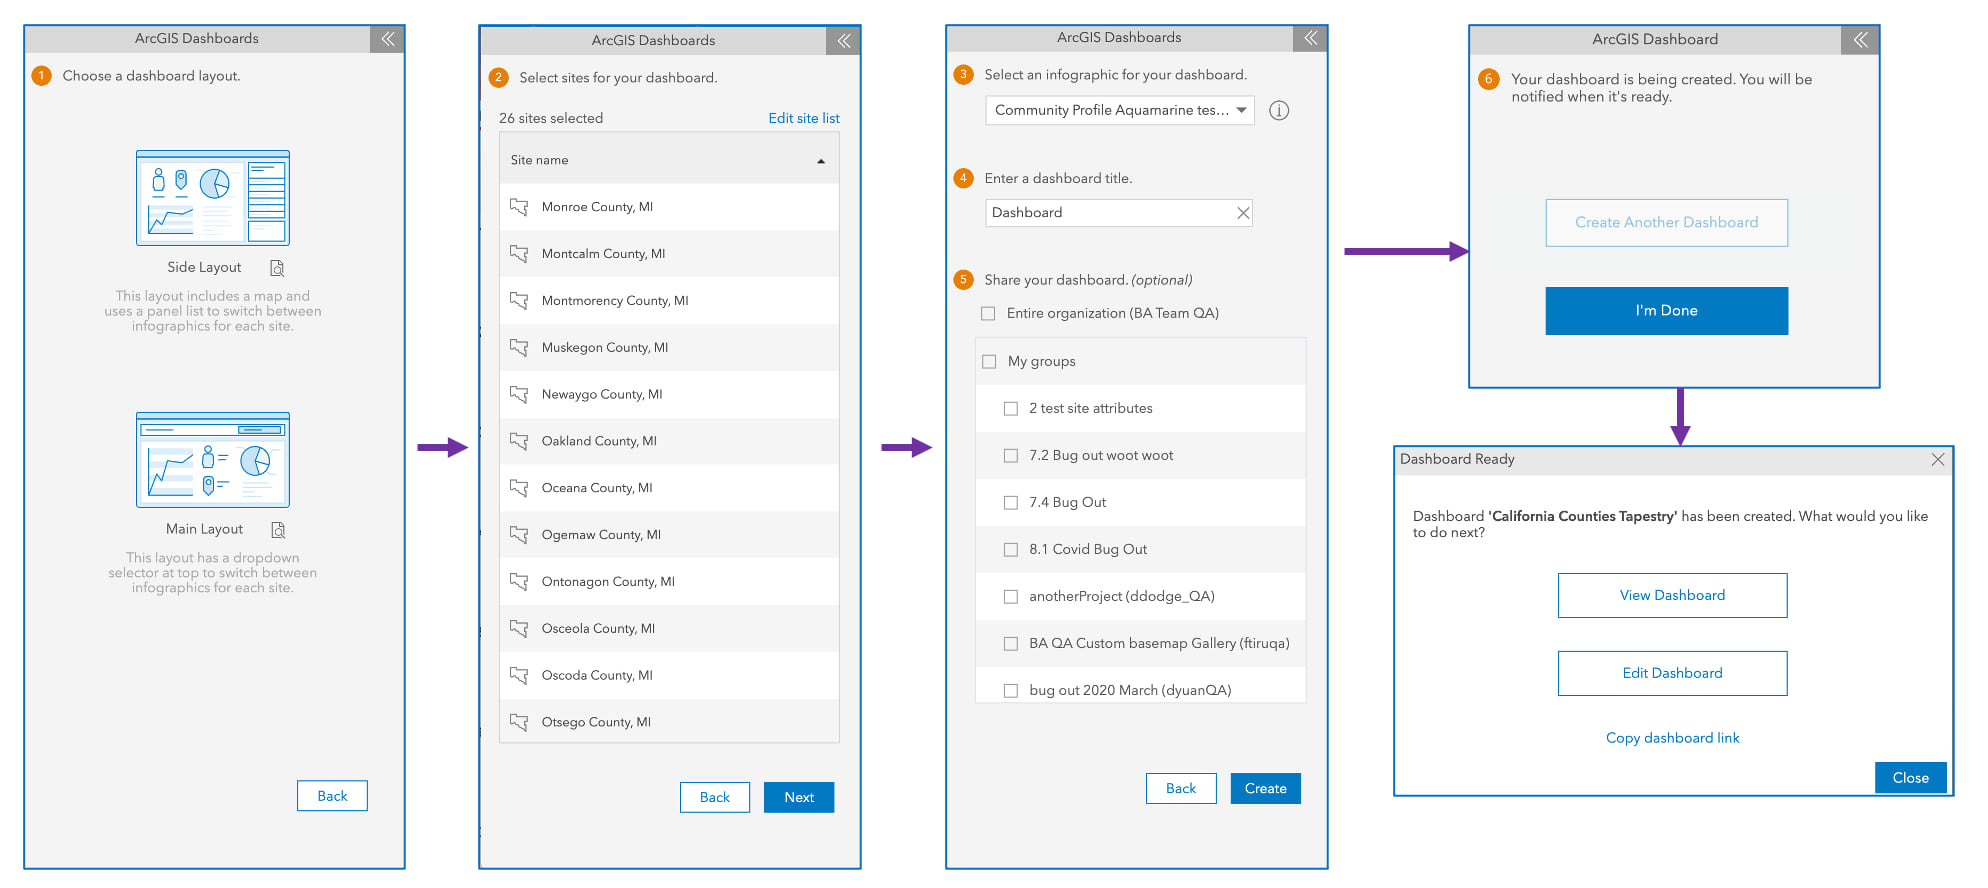
Once you launch the dashboard workflow from the Web App, you will be able to select from two dashboard layouts: Side Layout and Main Layout. A preview icon will let you see which layout meets your needs. You can either share the dashboard URL link directly with your team members or edit the dashboard further within ArcGIS Dashboards.
Improved Custom Data Setup
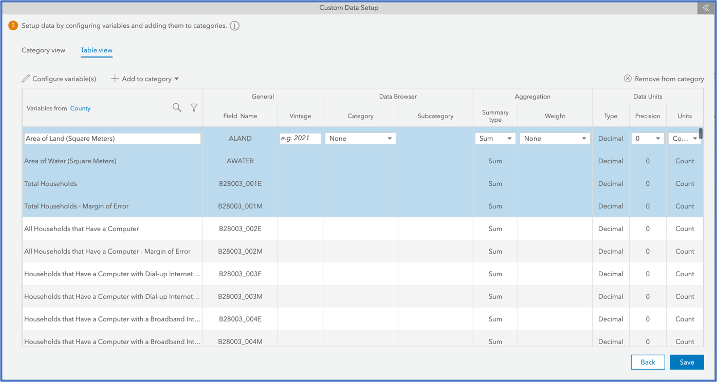
With Custom Data Setup, you can upload your data or data from ArcGIS or Living Atlas to the Data Browser, allowing you to use that data in infographics, reports, Color Coded Maps, Smart Map Search, or Suitability Analysis.
Currently, you can add or remove variables through a drag-n-drop feature, but this can become tedious if you need to move hundreds of rows of variables. In the upcoming release, you will be able to search for specific variables and add or remove by selecting multiple rows.
Configure Curated Content from ArcGIS as an Administrator
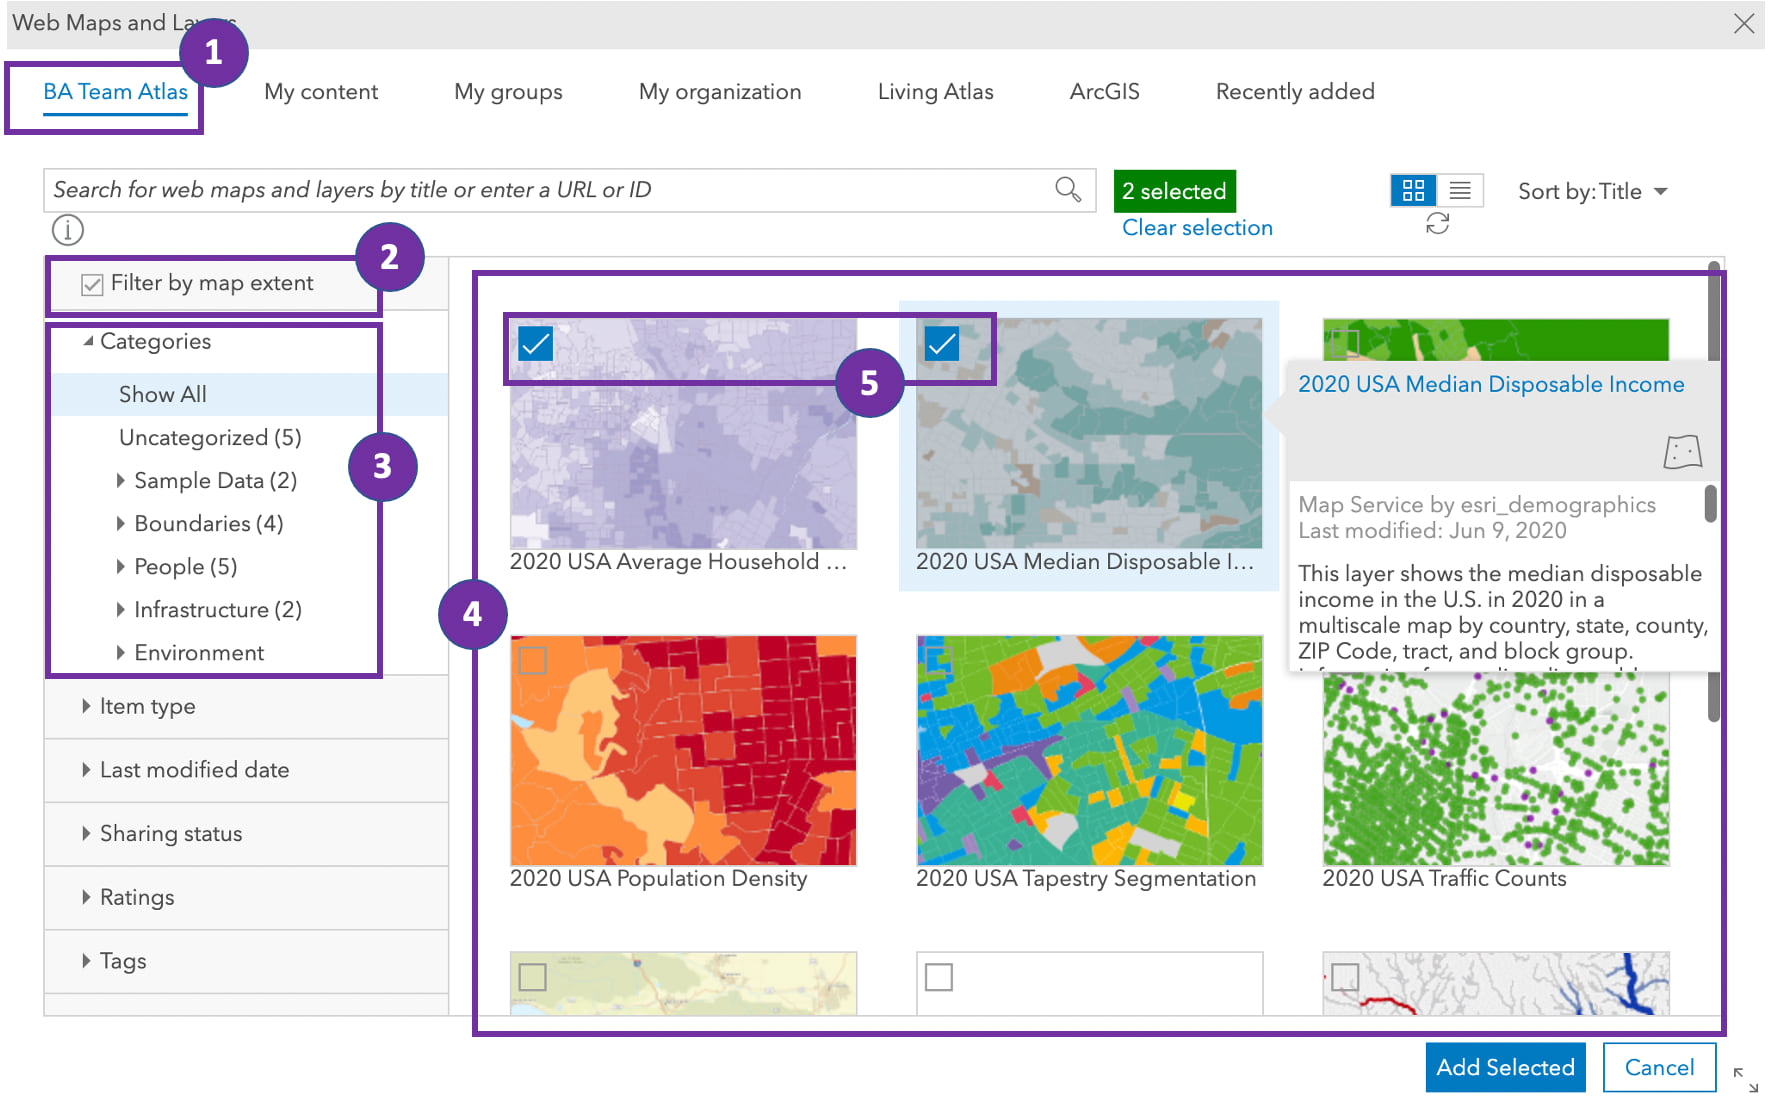
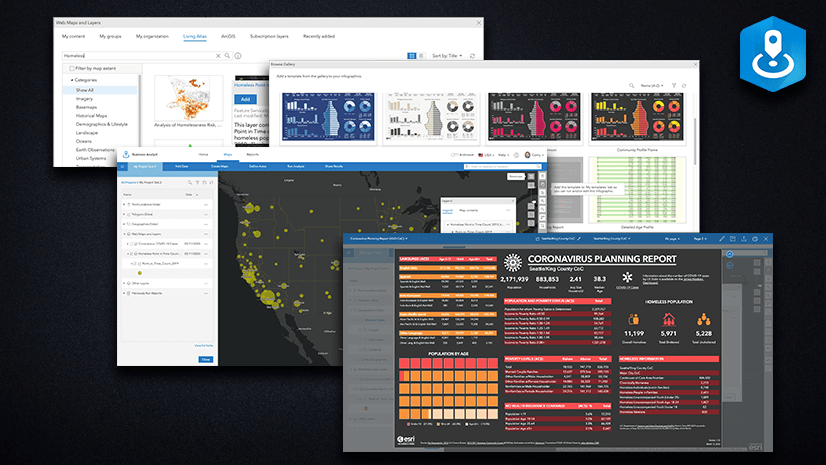
Business Analyst Web App allows users to add web maps and layers from ArcGIS and Living Atlas through the Maps > Add Data > Web Maps and Layers dialog. There is a plethora of data available, but Administrators will now be able to curate a list of data for specific members within their organization and streamline data search to those pertaining to your organization’s needs.
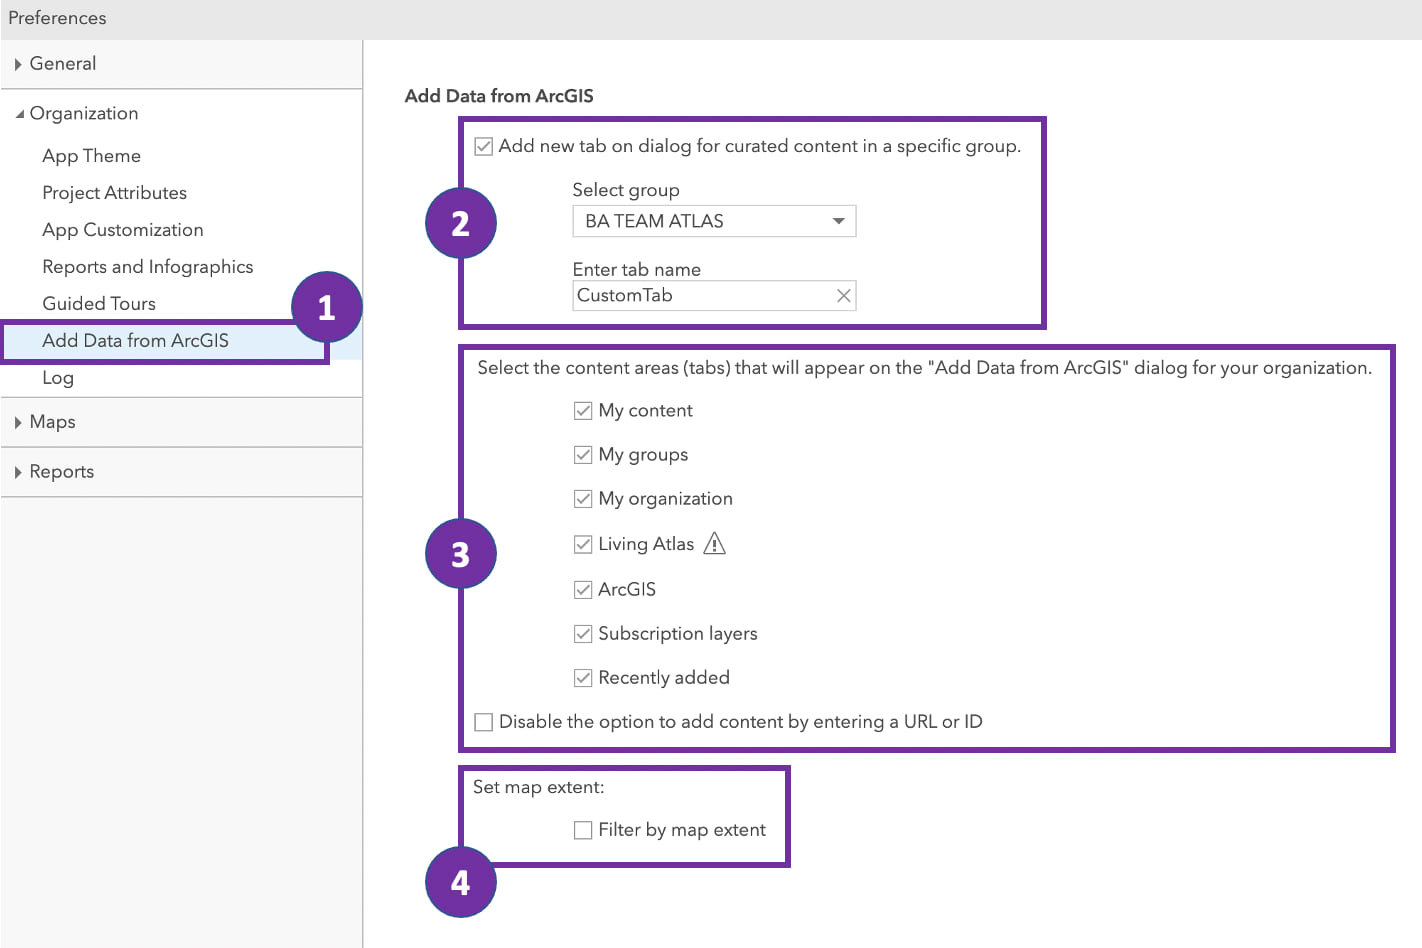
In Preferences > Organization > Add Data from ArcGIS you will be able to select an ArcGIS Online Group and make its contents available to a custom tab. You can also choose to filter the content by the map extent by default.
Soon users will be able to easily access your organization’s curated content from this tab. You can create categories in ArcGIS Online Content view and add them in Business Analyst Web Maps and Layers module. More information on how to edit Content Categories in ArcGIS Online can be found here. You will also be able to add multiple maps or layers at a time.
Dark Mode in the Mobile App
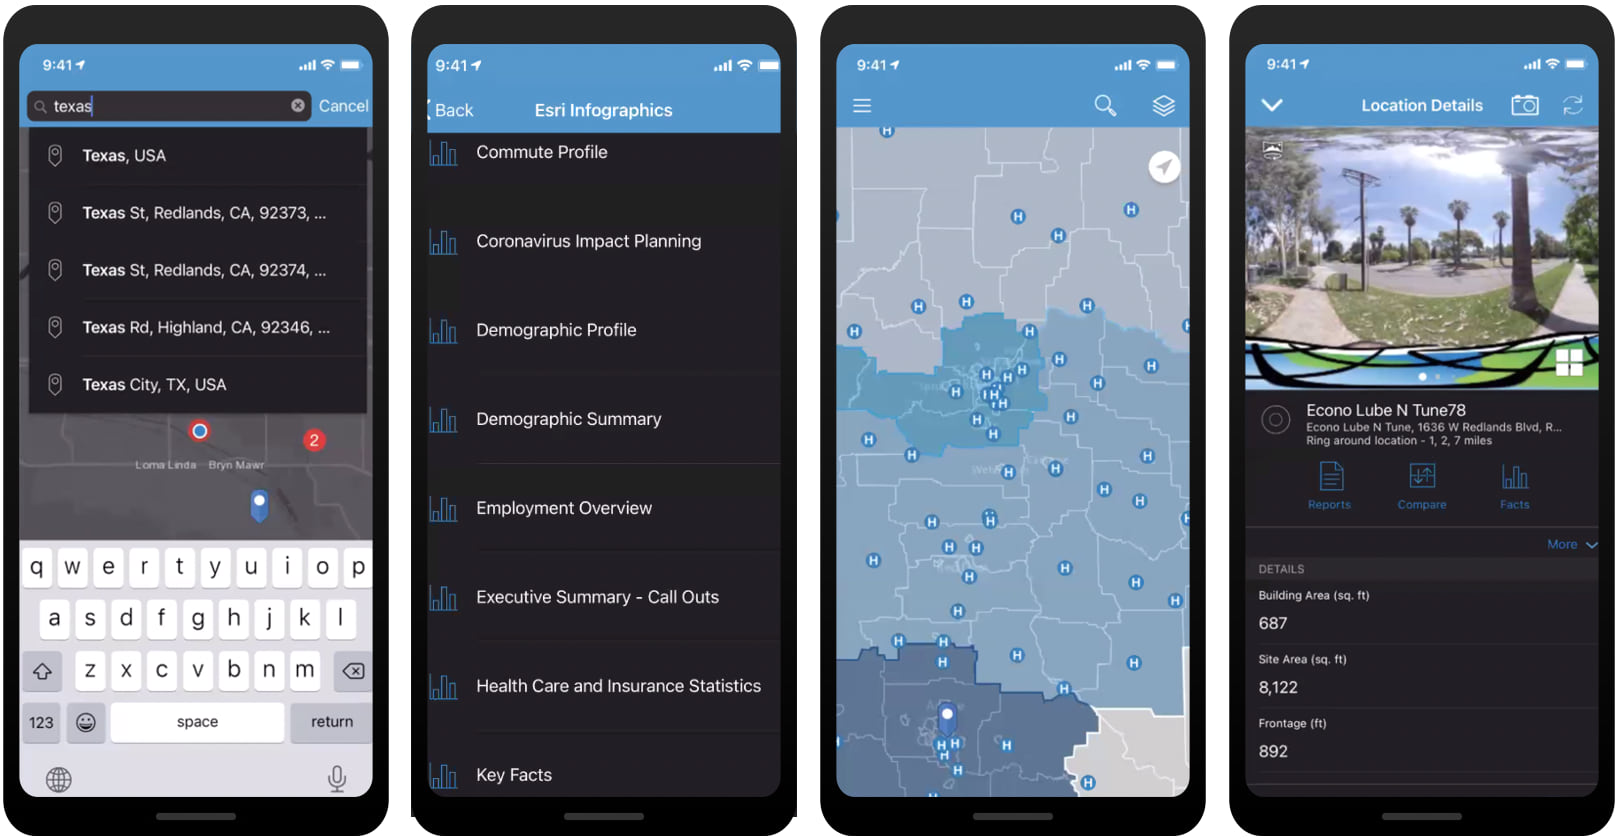
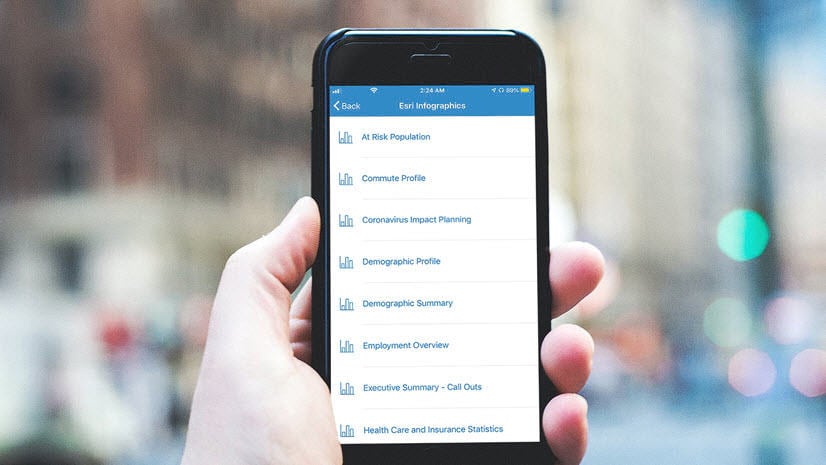
For our customers who prefer the aesthetics of dark mode on their phones, the Business Analyst Mobile App will support this in iOS and Android.
Data Updates
The April release will also include the following data updates:
- USA and Puerto Rico American Community Survey
- USA business locations and traffic data updates. (Please note Infogroup, one of our business data providers has changed their name officially to Data Axle. The data quality and content remain the same.)
- Michael Bauer Research international countries and regions to year 2020 data, Netherlands 4orange
- New Thailand points of interest data available for use in Business Facilities Search, Void Analysis, and the use of competitor locations in Suitability Analysis in Thailand.
To read more about the data updates, please visit the ArcGIS Business Analyst data documentation page.
We hope the enhancements in the upcoming April 2021 release helps you more easily share your insights and facilitate a streamlined workflow for your team.
Additional Resources
Please visit the following sites for other information on ArcGIS Business Analyst:
- Business Analyst product overview page
- Review pricing and purchase Business Analyst
- Business Analyst resources page
- LinkedIn user group
- Business Analyst YouTube playlist
- Esri Community
- Business Analyst Web App login page
- Read the reviews of Business Analyst on G2
- Email the team: businessanalyst@esri.com
This blog update revised the expected date to April 2021.
Photo by Michał Parzuchowski on Unsplash

Article Discussion: