It’s already been six months since the last Insights release, and the product team has been working hard within our home quarantine offices. We are extremely happy to announce that Insights 2021.1 (April) is now ready for you! The new version is available in ArcGIS Online, as a desktop download, and in My Esri to deploy with ArcGIS Enterprise 10.8.1. This release is also “ArcGIS Enterprise 10.9 ready”, for when 10.9 becomes available later in May.
This update is packed with a couple game-changing features, and many valuable enhancements top it all off. We listen hard to understand your highest priories and needs and can’t wait to see what you can do next with these new capabilities.
Snowflake & Google BigQuery
Cloud-native storage has a lot of benefits, and now Insights can tap directly into this content. Snowflake and Google BigQuery are now directly accessible database connections. In most cases data will remain in the native data store, and Insights will push queries and operations down to the database level, which means high performance and support for bigger data.
In this first release Insights will support the majority of data types. As you may know, Snowflake and Google BigQuery both have a geography spatial data type. Insights will soon support consuming their geography data type, and also will soon support enabling locations with these two new data connections. Aside from that, Insights works as usual with these connections.
To make the connection follow these steps:
- Download the JDBC file from the vendor web site.
- Zip the file and upload it into Insights.
- Create the database connection using your specific connection property details.
- Next, just add data to Insights and start analyzing! Have a look:
JDBC database connections (in Preview)
In addition to the supported data connectors, you can also create a connection using a JDBC driver. A JDBC driver is available for large percentage of data store formats available today. For example: Amazon Redshift, IBM Netezza, MySQL, Microsoft Access, and many more.
The process is straight forward:
- Acquire the JDBC driver (.jar) file, likely from the database vendor.
- Acquire (or create) two YAML files. The YAML files define how Insights should interpret the data and which SQL queries and operations are supported within the database. Instructions for creating them are in the Insights connector guide, and examples are already available – DB2, MySQL, and Amazon Redshift.
- Zip the JDBC driver file and YAML files up together into one zip file. Add this zip file to ArcGIS Insights.
- Make the connection to your own database.
Like the Snowflake and Google BigQuery connections, this first release of JDBC connectors will support the majority of data types. Insights will soon support consuming the geography data type from JDBC connectors, and also will soon support enabling locations with data from JDBC connectors. Aside from that, Insights works as usual with these connections. Have a look:
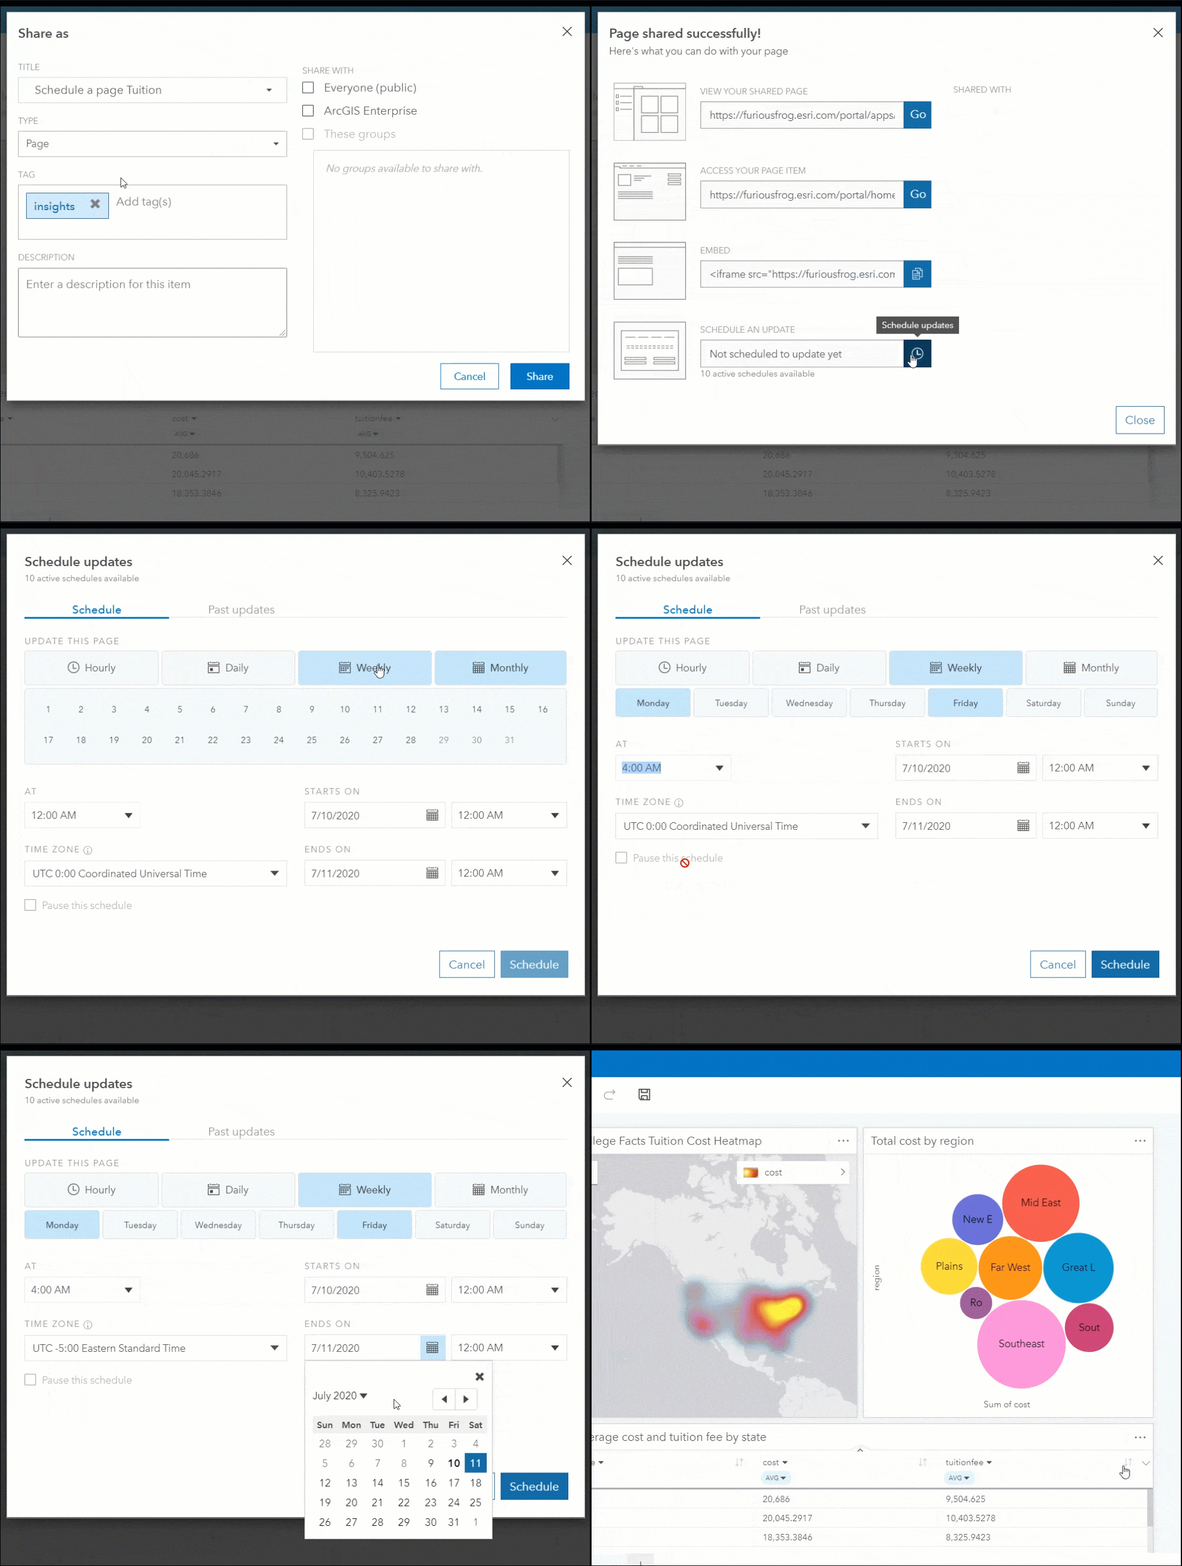
Scheduled refresh of analysis in Online
In September we added scheduled refresh of analysis with Insights in ArcGIS Enterprise. Now that same benefit can be realized within ArcGIS Online. When you share your Insights pages, you’ll see the option to schedule the page for updates. This ensures that viewers of your interactive reports are seeing the most current data. Insights will refresh up to once per hour, fetch the latest data, and reprocess the entire analytic workflow used to build your interactive report.

Temporal Analysis & Visualization
You now have more date and time options with powerful new temporal analysis and visualization tools.
For starters, the time series card shows more individual record detail when panning and zooming the timeline. Individual data points are used to intelligently “re-bucket” and show an appropriate amount of aggregation or detail. This method strikes a balance between granularity and interpretability.
Moving average (sometimes called rolling average) is an option to display on the timeseries card as a statistical trend line. This calculation is completely configurable, and it helps provide an immediate understanding of the data.
Temporal decomposition is an analysis that breaks down temporal data into multiple seasonal tendencies – weekly, monthly, quarterly, and yearly. The result of this analysis is three vertically stacked time series cards on the same x-axis. One is for the seasonal trend, one for the overall trend, and one for residual values.
Forecasting is an analysis operation that projects what values are likely to occur in the future, with confidence interval visualizations.
Export data as a report viewer
As an Insights analyst, you can always export data and results to a local file. Now viewers also have the export capability.
Imagine your report viewers performing selections and filters and creating a data subset. Next they have the added option to flip the card over, export their defined subset of data to a CSV file, and extend use of that data on their own.
Analysts have full control over enabling or disabling this capability during the page sharing process.
…and more
Of course, these are just the highlights and there’s more… too much to describe in one blog! A complete list of what’s new in this release is available in documentation here.
What’s next
If you’re new to Insights and would like a test drive, you can try it today. There’s also lots of great information available online, and we would love to hear what you think. Have an example you would like to share? We can add it to the example gallery.


Article Discussion: