

January 27, 2020 | Christa Campbell | Infrastructure
February 3, 2021
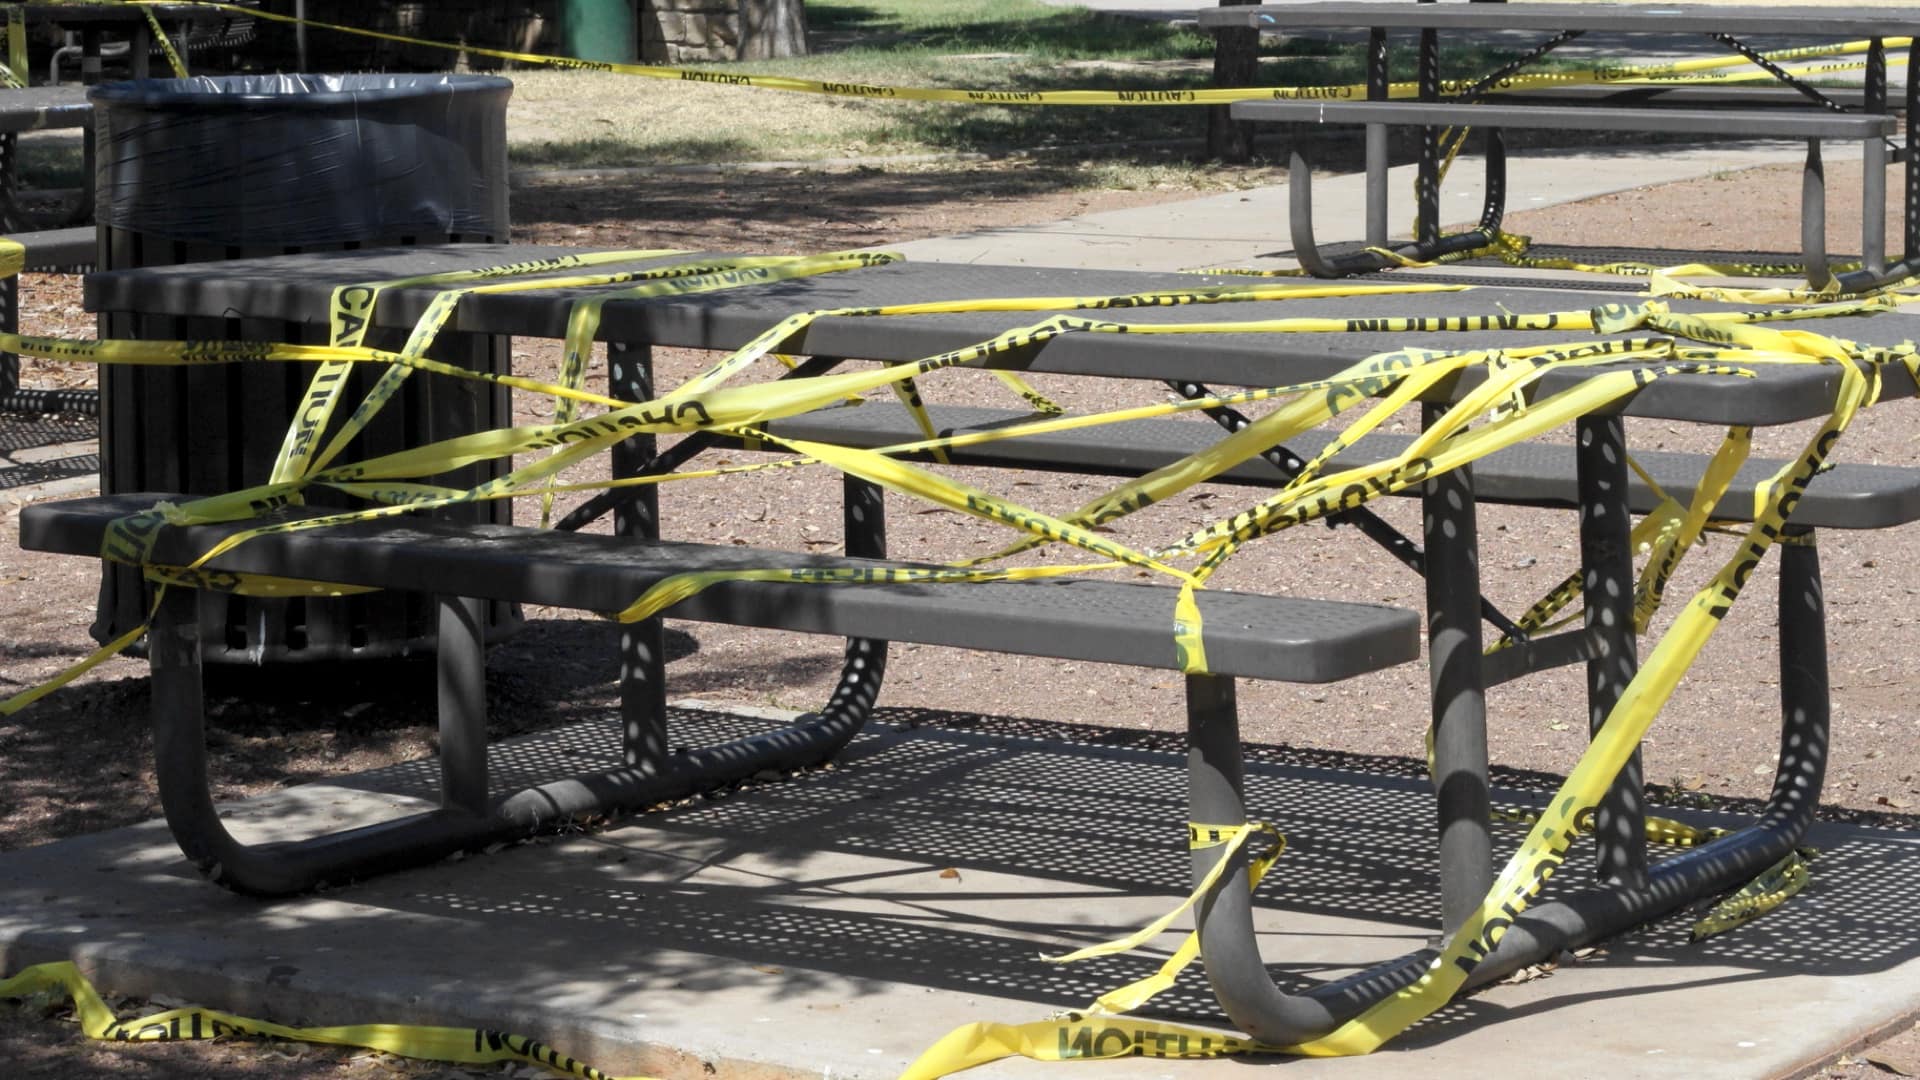
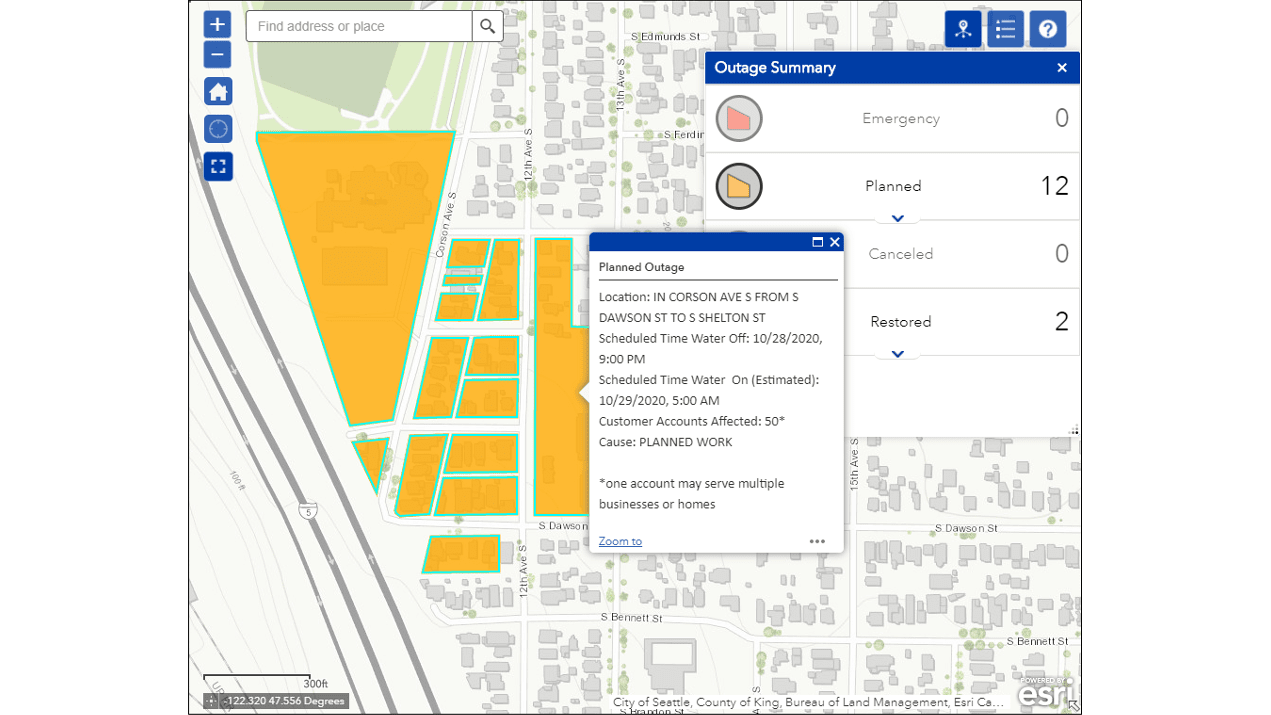
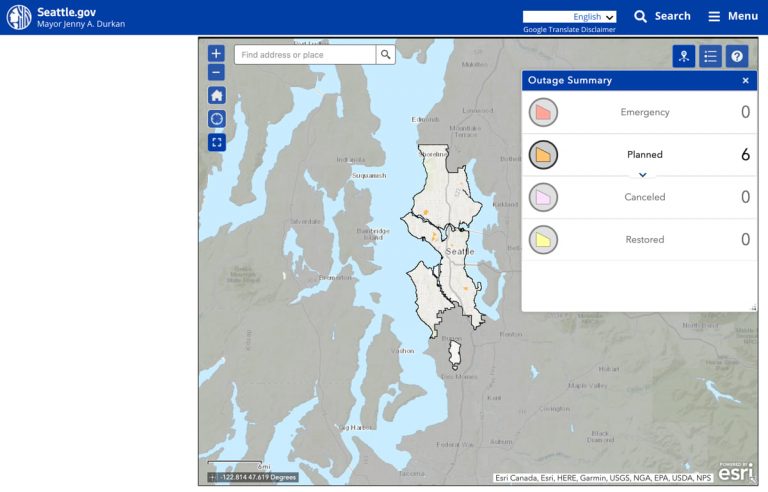
When Seattle residents turn on the tap to find their water has been shut down—usually for an emergency repair or scheduled maintenance—they can now call up an online map to see the extend of the outage, what caused the outage, and when the water will return.
Seattle Public Utilities recently unveiled this new map, built with geographic information system (GIS) technology, so the city’s more than 800,000 residents can easily search for information about local water shutdowns and zoom in to street level to view impacted properties. The move was inspired by community demand after Seattle City Light created a similar electrical outage map.
“Planned shutdowns for maintenance or watermain extensions, as well as unplanned shutdowns for emergency leak repair, occur every week,” said Wylie Harper, director of Seattle’s Water Operations and System Maintenance. “This project saves time, increases data accuracy, and improves process efficiency for all teams involved. Importantly, the map conveys needed information to our communities in a much better way than was previously possible.”
Since launching in June 2020, residents have quickly embraced the self-service outage map. But, at the project outset, the City of Seattle’s GIS team quickly discovered that creating an effective and far-reaching tool would encompass far more than communication via the map. On the back end, the work led to more accurate data, tighter processes for the utility, and overall improvements in the way water shutdowns are managed.
“The mapping angle, which included a public-facing Water System Outage Map, was the straightforward aspect,” explained Stephen Beimborn, manager of Departmental GIS Analysts for Seattle Information Technology. “The difficulty was creating a workflow to manage four different stages of planning and approval, frequent cancelations, and both planned and emergency work.”
In reviewing the team’s workflow, GIS analyst Lynn Ashton and her team uncovered a thorough due diligence process that is performed for every water shutdown event. Four different offices located throughout Seattle Public Utilities must review each shutdown request, perform specific related activities, and then pass their approval along to the next team. Communication was a challenge in this manual process and there was no central database to check on approval status or share updates.

Bob Hubbert, Utility Service Inspections Manager for Seattle Public Utilities, and his team are the last to review a shutdown request before it is executed. They help protect drinking water quality in the areas around the shutdown, ensure that customers receive the appropriate amount of advanced notification, hand deliver notices to the impacted residents and businesses that include the shutdown details and related customer information and help resolve any significant customer impacts. For Hubbert and his team to succeed, they need information to arrive in a timely, accurate, and consistent manner.
“In the past, we used a paper document that was filled out manually, scanned by staff, and then passed around via email. This created the potential for challenges that could be impactful to everyone involved” Hubbert explained.
“And when it would get to us in this paper format, sometimes it wasn’t clear which customers would be impacted or if they would receive the appropriate amount of notification” he continued. “In response, we would often have to make several phone calls to try and confirm the information we needed. We also had to create our own maps for each shutdown so that our inspectors could prepare the notifications for delivery.”
Another hurdle for the development team was ensuring data integrity for its new system. The team worked with staff from Seattle’s Water GIS Data Maintenance Group, who played an integral role in the project. “While we were developing the application, they were fixing the data, and it can’t be overstated how important that was,” explained Beimborn.
“We had a 20-page document of problems that we had to get fixed,” said Toby Semroc, GIS developer for the City of Seattle. “Building the shutdown tool helped with the integrity of the city’s data as well because the data maintenance group was seeing it from a different perspective.”
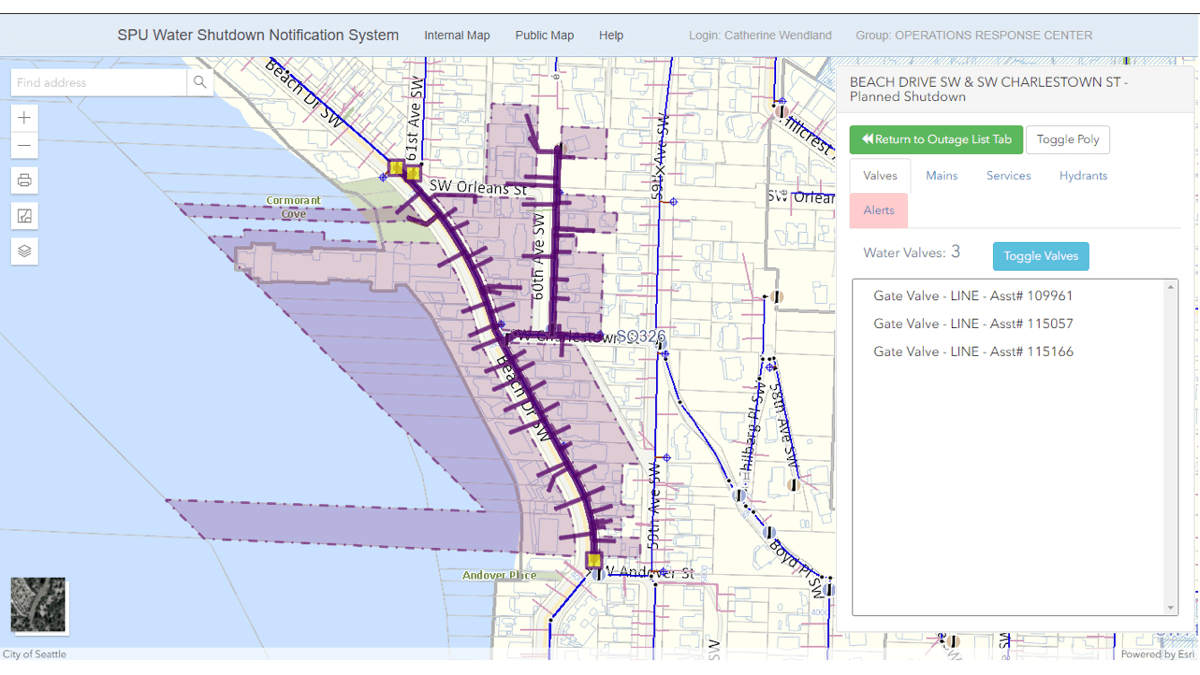
After gaining an understanding of each team’s responsibilities, workflows, and challenges, the developers of the water shutdown tool decided to use GIS as their organizing framework. In addition to providing the technology for the public-facing map, the geospatial platform unified many disparate data sources; automated a multi-step approval process; and provided a single place for stakeholders to check on the status of pipes, valves, and shutdowns throughout the city.
Catherine Wendland, citywide GIS analyst for the City of Seattle, shared an example of how immediately impactful the tool was to both the shutdown process and the accuracy of decisions being made.
“We created a report and map within the new system that can be printed to be taken into the field. They can identify which pipes need to be serviced, and it instantly tells them which valves need to be shut off to ensure a certain water main is actually shut down. Sometimes it’s surprising,” she said. “The tool then lists all addresses affected and also includes alerts of potential schedule conflicts. Previously, it was all done via memory, experience, and paper maps.”
When development team members found themselves shorthanded halfway through the project, Wendland became the liaison between them and internal stakeholders. Despite city government support for the project, she had to work hard to win over the people responsible for day-to-day planning, managing, and initiating water shutdowns.
“I think it was hard for them to see what was possible, because they’ve never had something like this before,” Wendland said. Eventually, she said, all teams involved embraced the process and saw its benefit.
“Now that they have this level of automation, they’re thinking of all the other processes that they would like to see automated,” Wendland said. “It’s really validating.”

Hubbert’s Utility Service Inspections team, who also oversees SPU’s cross-connection control (backflow prevention) program, now utilizes the tool in their efforts to help ensure that the city’s drinking water supply remains safe and reliable as well. After seeing the mapping application in action, the team requested that a backflow protection tool be added that would help identify any potential cross-connection hazards that might impact the public water supply during planned or emergency depressurizations.
Developers were able to import SPU’s cross-connection control data into a GIS layer and created a color-coded map that allows the inspectors to examine any location within the city’s direct water service area with a backflow prevention focus. This added capability is now something the team uses far beyond just planned water shutdown events.
“We can now drill down to the property and water service level and see what’s going on from a backflow prevention perspective in any area of the city,” Hubbert explained. “If we look at the map and see certain color shadings, we can quickly access the site’s cross-connection control information and determine the best next steps. This ability has enhanced our efforts to make effective and efficient use of staff time and helps ensure that the public water supply is protected from these hazards during depressurizations.”
What started as a means to better manage water shutdowns has grown to become useful in day-to-day operations. Wendland says it’s even removed tension between teams. “They’ve told me that having the tool be so cut and dry and creating transparency in the whole process has actually helped repair their relationships. So that’s been an unexpected side effect that I thought was kind of awesome.”
Learn more about how GIS enables an intelligent water system for utilities.