


June 25, 2019 | Brooks Patrick | Urban Planning
March 18, 2025
Picture an ideal Main Street: shops nestled side-by-side, apartments above, pedestrians browsing cafes and bookstores. This quintessential American scene is ironically illegal to build in most cities today, deemed too dense by modern zoning laws.
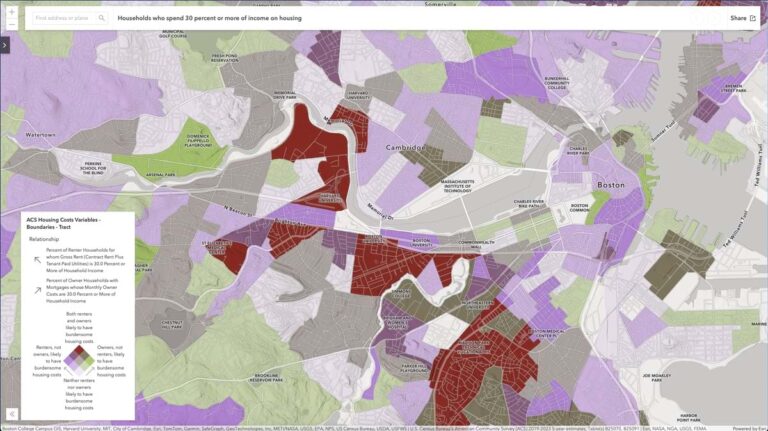
Density—the number of units in a given area—is typically governed by zoning laws. Most US zoning regulations, dating to the early 20th century, restrict housing types in specific zones. This approach constrains supply, drives up prices, and undermines housing affordability.
Today, roughly 75 percent of residential land is zoned for single-family homes (see sidebar). By understanding and reforming these laws, communities can foster economic growth and promote development. In Massachusetts, one group is working to make this possible statewide.
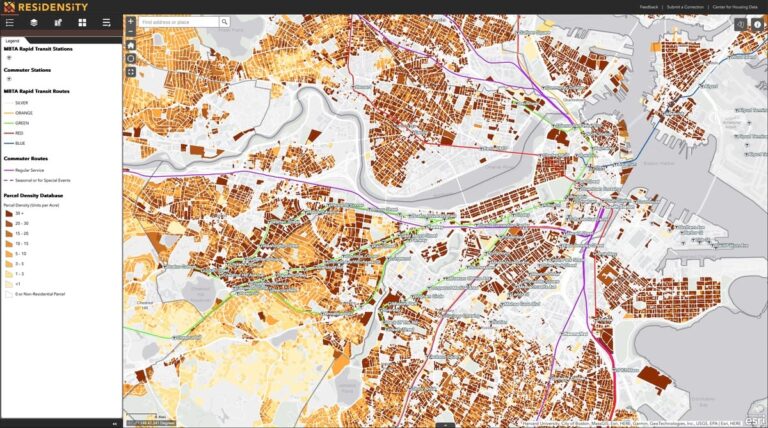
The Massachusetts Housing Partnership (MHP) helps residents, volunteers, policymakers, and local leaders visualize the density that already exists in their communities. Residensity, an interactive web tool developed and launched by MHP’s Center for Housing Data, uses geographic information system (GIS) technology to display housing units per acre and population levels.
Massachusetts is no stranger to the housing affordability crisis. In 2024, the state’s median price for a single-family home was $609,900; in Boston, it was $900,000.
In response, the state legislature in 2021 passed the Massachusetts Bay Transportation Authority (MBTA) Communities Law, which requires half of the state’s 351 municipalities to allow multifamily housing in locations with good access to transit. In 2024, Governor Maura Healey passed the Affordable Homes Act, authorizing $5.16 billion in spending over the next five years, along with nearly 50 policy initiatives to counter rising housing costs.
MHP, a public nonprofit, consults on local and state housing policy with data and tools that help communities meet the new requirements. Additionally, MHP has loan programs that support the construction and preservation of multifamily housing. It has lent $1.5 billion toward affordable housing development since its founding in 1985.

Each municipality makes their own zoning rules, but in this case, the state requires localities to adopt compliant zoning to add greater density around transit stations. When the MBTA Communities Law passed, it required communities with transit stops to allow 15 housing units per acre, equivalent to a small apartment building or cluster of townhouses. This state mandate became a polarizing element of the law.
“If you’re not aware of what 15 units per acre looks like, it’s something that can sound really scary,” said Tom Hopper, director of the Center for Housing Data at MHP. “Density is objective; it’s something that we can use to set standards and guidelines, but it’s also something that can be misinterpreted really easily.”
It can be difficult for residents to grasp how people and buildings occupy space. A three-story development seems tall until it’s compared to the height of a typical utility pole—both are usually around 30 feet.
Hopper and his team make GIS maps to reframe how people think about density. “We realized that, for people to become comfortable with the level of density outlined in the law, we needed to contextualize it in the neighborhoods they love,” Hopper said.
Hopper’s work on Residensity was inspired by an earlier success. In 2019, the Center for Housing Data launched the Transit-Oriented Development Explorer (TODEX), with interactive maps revealing densities around Greater Boston’s 261 transit stations. The tool proved popular with municipalities and residents. Hopper set out to expand it to the whole state.

Residensity and TODEX rely on the same dataset, which requires drilling down to the parcel level of data to determine how many units are in each plot of land. This data comes from MassGIS, the state’s GIS team, which gathers and updates land use and housing tax assessment maps from each municipality.
In Residensity, the state’s Next Generation 911 addressing system and third-party real estate data are combined with MassGIS data to create a picture of density in Massachusetts. Users can zoom in and out of neighborhoods or search specific addresses to get detailed parcel information.
“If you want to find out where the densest development in your neighborhood is, or if you’re looking for developments that are over 15 units per acre, you can see it in the interface. It gives people a really accurate and data-driven approach for conversations about density,” said Matija Jankovic, MHP senior research analyst.
Members of MHP’s community assistance team, which has helped over 130 municipalities comply with the MBTA Communities Law, use Residensity to find existing examples of density in the communities they advise. Instead of giving city councillors an abstract illustration of a dense housing development, consultants can point to an apartment building that already fulfills zoning requirements as a model to inform future development.
In Braintree, a suburb south of Boston, city councillor Meredith Boericke turned to the tool to highlight the positive impact that zoning updates could have on the city’s economic vitality. With Residensity, she identified existing multifamily properties that exceeded the 15 units per acre rule. This helped constituents understand what density already looked like in their community and allowed them to visualize future housing developments accurately.
Across the state, Residensity is making an impact. Local planners and municipal staff frequently access it to examine parcels and investigate density in their municipalities. Housing advocates and residents use it to explore neighborhoods and communicate development patterns. People post screenshots from the tool to their social media accounts, spurring conversations about housing. And passionate residents use it to bolster their pro-housing messaging at zoning meetings and city council sessions.
“Before this tool, there wasn’t a comprehensive way to look at density in the state,” Jankovic said. “It’s really interesting to see how patterns are concentrated and how there are very clear spatial dynamics at play.”
Since its launch, Residensity has revealed development patterns that have prompted important conversations. The tool uncovered where land is being used efficiently and identified areas that could benefit from higher-density developments.
There were also some unexpected discoveries. “Residensity highlights the differences between types of housing. We’ve seen single-family neighborhoods that are actually denser than some multifamily developments. To me, that says you can achieve density in a number of different ways that fit community needs. We always talk about multifamily versus single-family, but it’s a lot more complex than that,” Hopper said.
Adding to that complexity are accessory dwelling units (ADUs), which are smaller, secondary housing units located on the same lot as a single-family home. Examples include converted basements, attic spaces, or detached structures like backyard cottages. ADUs can provide affordable housing options and help increase the overall density of a neighborhood without significantly altering its character.
The Massachusetts Executive Office of Housing and Livable Communities is using the Residensity dataset to ask questions about where ADUs would be most appropriate and how a statewide ADU policy might impact residents.
The tool also caught the attention of other researchers, some from environmental, transit, and public health organizations. Staff members from the National Zoning Atlas contacted Hopper’s team to talk about scaling parcel-level unit count and density data to the national level. A handful of states have expressed a desire to develop similar tools, but it’s hard to do without accurate statewide tax assessor and parcel data.
With insights from data-rich maps, town centers have the potential to look like the quintessential Main Street again. But housing is just a piece of the puzzle. Maps can reveal how much land is relegated to urban sprawl, such as parking lots or commercial development like warehouses. In cities that prioritize density, maps show how communities have made room for local parks and other public spaces for everyone to enjoy.
“It’s not just about housing and transit but knitting all of this stuff together: civic life, environmental planning, resilience, and climate impact,” Hopper said. “Analysis like this always highlights how far we have to go, but it’s valuable, and we can use this information to communicate better.”
Learn more about how GIS helps state and local governments inform policy decisions.