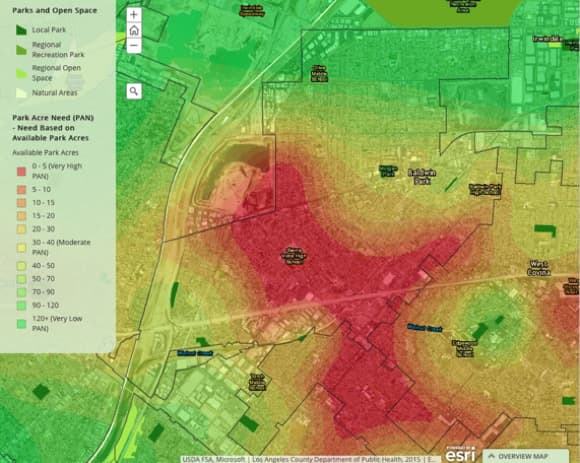

Maps were central to the community meetings. We printed these maps on large display boards, and people gravitated to them.
September 11, 2017

Third in a Three-Part Series on the Use of GIS to Promote Greater Access to Parks
In Los Angeles County, residents of the city of Baldwin Park face the sad irony that there isn’t much parkland in their community, and the parks that exist are in disrepair due to overuse.
The National Parks and Recreation Association established the goal of 10 acres of parks per 1,000 people, and the Trust for Public Land aims for each citizen to live within a 10-minute walk (half a mile) from a park.
Baldwin Park has only 0.28 acres of parks per 1,000 people, with just 22 percent of the population within walking distance of a park. Countywide, those figures are better but still far short of The Trust for Public Land’s goals. The county average is 3.3 acres per 1,000 people, and just 50 percent of residents are within a 10-minute walk from a park.
This data is the outcome of a comprehensive countywide needs assessment conducted to present a well-researched ballot measure to fund park improvements.
“The assessment laid the groundwork for a proposed expenditure plan that includes a dedicated source of funding for all the high-need areas in the county,” says Mary Creasman, California director of government affairs, Trust for Public Land.

Needs and dollars
The county crafted Measure A for safe, clean neighborhood parks, open space, and beaches; river protection; and water conservation. Measure A asked Los Angeles County voters to approve an annual special tax of 1.5 cents per square foot of improved property, funding parks for the long term. The tax per homeowner is projected to cost $22.50 a year for a 1,500 square-foot home, with larger landowners paying more.
Each of the 188 study areas in the Parks Needs Assessment received an expenditure plan. At public presentations, maps and other visuals showed proposed improvements and areas prioritized because of high need, like Baldwin Park.
“We use [the term] ‘high need’ instead of saying ‘underserved,’ ‘park poor,’ or the word ‘equity,'” says Clement Lau, departmental facilities planner with the Los Angeles County Department of Parks and Recreation. “We believe that the data and the map show us areas of highest need.”
Of the 188 study areas, a total of 43 were prioritized as high or very high need. The funding measure sets aside 13 percent of the monies generated from the tax to specifically address the issues in those areas.

Maps were central to the community meetings. We printed these maps on large display boards, and people gravitated to them.
Maps of action
At the same time that the needs assessment was being worked on, officials launched a stakeholder education effort. They reached out to the business community, labor, nonprofits, open space advocates, and economic and racial justice organizations. More than 100 local, state, and national organizations joined the Our Parks Coalition to get Measure A passed.
Armed with input, the findings from the needs assessment, and individual park plans, officials next needed to present ideas to the public. Each of the 188 study areas had a separate meeting and its own maps.
The maps included the following:
“Maps were central to the community meetings,” says Lau. “We printed these maps on large display boards, and people gravitated to them.”
“No place in the country has so tightly tied its funding measure to its needs assessment, preventing petty politics from interfering with sound planning,” wrote Jon Christensen and Samantha Ong in “Los Angeles Needs More Parks,” an opinion piece published in the Los Angeles Times on October 12, 2016.
Parks pass
As officials readied Measure A for voters, they added several unique mechanisms to it. Each year, two percent of funds would shift from park improvements to maintenance, ensuring that improvements and the purchase of land for the development of new parks would balance with the maintenance of amenities and parks over time.
A full 50 percent of the funding would go to local governments that have been relying on funding for years to maintain operations. The other 50 percent would go to competitive grants and include an amount set aside for areas of high need.
The measure also addressed transparency. It called for open reporting of data on exactly where and on what money is being spent, allowing citizens to monitor where tax dollars are going. This includes a constant update of maps designed to show where park changes have been made so that citizens could visit and see for themselves what had been improved.
With all these mechanisms in place and after considerable community outreach, Measure A passed, supported by about 75 percent of the voters, on November 9, 2016.
“We do this kind of work across the country, and this is the largest local parks measure that’s ever been passed,” says Mary Creasman, California director of government affairs, Trust for Public Land. “There [are] permanently $94 million per year for parks and open space from this measure that will go up over time with inflation, and it’s driven by a needs assessment that will be updated regularly.”
Things are looking up for Baldwin Park. The city’s Walnut Creek Nature Park recently reopened after undergoing a $1.4 million renovation project. The hope within the community—and across the county—is that new parks can be added with Measure A funds so that the lives of all residents can be enriched by the benefits of green space.
Read more
To learn more about how geographic information system (GIS) technology can support thriving communities, visit esri.com/smart-communities. The first story in this series illustrates how the Trust for Public Land factors equity into their park planning process. The second story in this series outlines how Los Angeles County assessed the parks throughout the whole county.


