
Every day, people like Craig Fugate and his team at the Federal Emergency Management Agency (FEMA) work to keep Americans safe with the help of GIS technology. And that’s a very valiant thing to do, according to Esri president Jack Dangermond, who presented the Esri President’s award to FEMA during the 2016 Esri User Conference (Esri UC).
“Craig, you are my hero,” said Esri president Jack Dangermond, pointing to FEMA’s “heroic work” and “great implementation of GIS” under the leadership of Fugate, FEMA’s administrator since 2009.
The Esri’s UC theme this year was “GIS-Enabling a Smarter World” and a smarter and safer world is starting to take shape thanks to GIS and other technologies. But it’s people like Fugate and his staff who champion and use GIS who are responsible for making this change take hold.
In accepting the award, Fugate said that the relationship between FEMA and Esri has been a “true partnership.” He said Dangermond and Esri were instrumental in creating a way for FEMA to integrate social media data such as Tweets into its mapping platform to help the agency better respond to emergencies or natural disasters.

“It follows our philosophy at FEMA that the public is a resource, and that, oftentimes, they can tell us what is going on faster than official reports,” Fugate said. “Yet we had no way to visualize that [data] until Jack’s team put it together and built that layer that we all now have access to. By using the public as a resource, we are able to save lives just by the simple act of ‘You tell us what’s going on.’ Jack has given us the ability to help us map that against the ability of what we know and what we don’t know. And that saves lives. It speeds up response.”
Dangermond honored many other innovators during the Esri UC Plenary Session, including Pinellas County, Florida; the Port of Long Beach in California; Tradewind Energy, Inc.; The Shopping Center Group LLC; Catholic Relief Services; and the Mayor’s Office of Emergency Management for the City of Boston.
“Your work is so interesting,” he told an audience of 16,000 people from 130 countries. “You are working on virtually all the significant challenges and issues on the planet, from climate change to food production to humanitarian relief to making cities better.”
Dangermond spotlighted scores of maps generated by users all over the world that address environmental issues, energy development, transportation planning, building management, disaster response, health, and education.
“GIS and maps are the common language that brings us together,” Dangermond said. “They help us communicate. They help us understand. And they will help us act.”
A Wired World
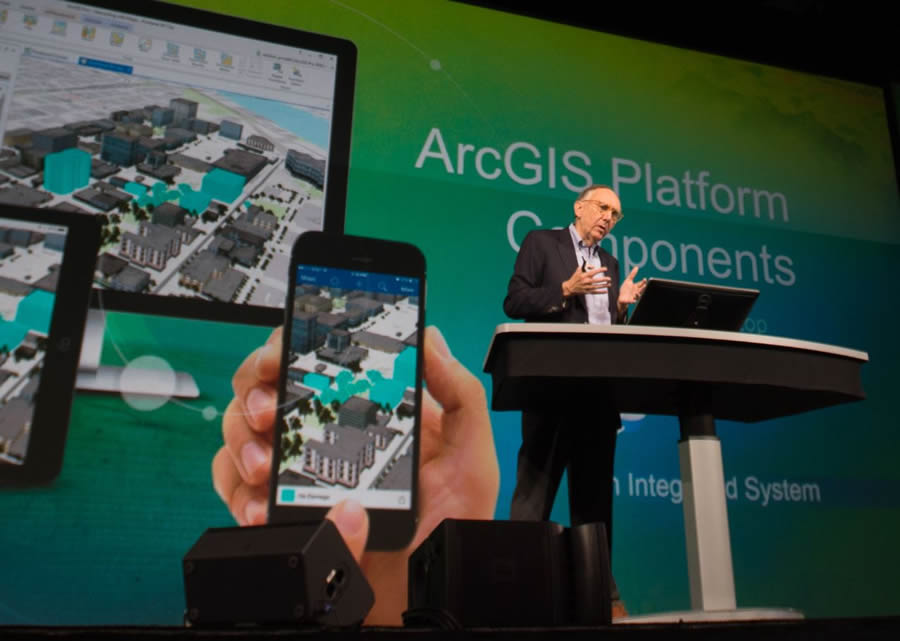
GIS, like other technologies, is undergoing change, Dangermond told the audience. With the Internet of Things (IoT) promising to measure—in real time—virtually everything that changes or moves, a massive digital transformation is underway. Enormous amounts of data are now widely available, and maps have the ability to connect not only the information but also people and organizations. These deep links constitute smart GIS.
“What will we do with all this data? What does it mean? How will we go forward on this wired planet?” Dangermond asked. The answer, of course, is GIS and mapping. “They are becoming essential elements, [not only] a fundamental language for understanding our world but also managing our world. Understanding precedes action.”
Action is needed on a variety of fronts, Dangermond said, citing climate change, the loss of nature and biodiversity, and social conflict. “The evidence is clear that our current path is not sustainable,” he said. “We need to be smarter. We need to do everything we can. We need to muscle all the best science, all the best technology, all of our best thinking [and] design thinking. We need to understand, act together, and collaborate to turn this around.”
Smart GIS also means making communities smarter.
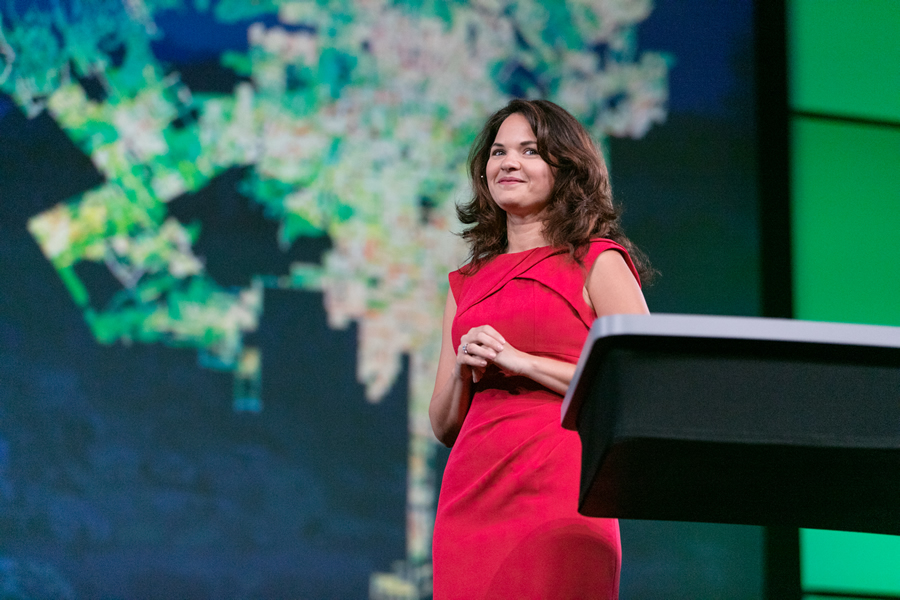
This, in fact, is what the City of Los Angeles, California, is doing with its Los Angeles GeoHub, which brings together data that, until now, has been stored in different city departments. The online public platform encourages residents to use this data and the ready-to-use apps available at the GeoHub to improve their city.
“The citizens of Los Angeles and the employees are basically weaving together pockets of our GIS data and technology that have been hidden in the halls of our city,” said Lilian P. Coral, chief data officer for the Office of Mayor Eric Garcetti in the City of Los Angeles. “What this has meant is that we’ve been developing applications that matter, and we’re putting data to work.”
For example, GeoHub is being used to inform initiatives such as Vision Zero, which is aimed at lowering the number of deaths and serious injuries caused by traffic collisions.
The city’s Street Wize app, for example, uses Web GIS to pool data onto a single map so that citizens can see in-progress or upcoming construction work on their streets. Private developers can use Street Wize to examine building opportunities as well, and the city uses the app to minimize construction conflicts and encourage coordination.
“The GeoHub dynamically integrates real-time data onto this user-focused map,” Coral added. “And now we can use the same data and actually feed it into other applications—say, for emergency management.”
As Los Angeles mayor Eric Garcetti said in a video played at the Plenary, “[The] portal enables us to reinvent the way we’re delivering services and broadens our ability to engage everyday residents and businesses.”
Learn more about smart communities.
Surveying Blight in the Big Easy
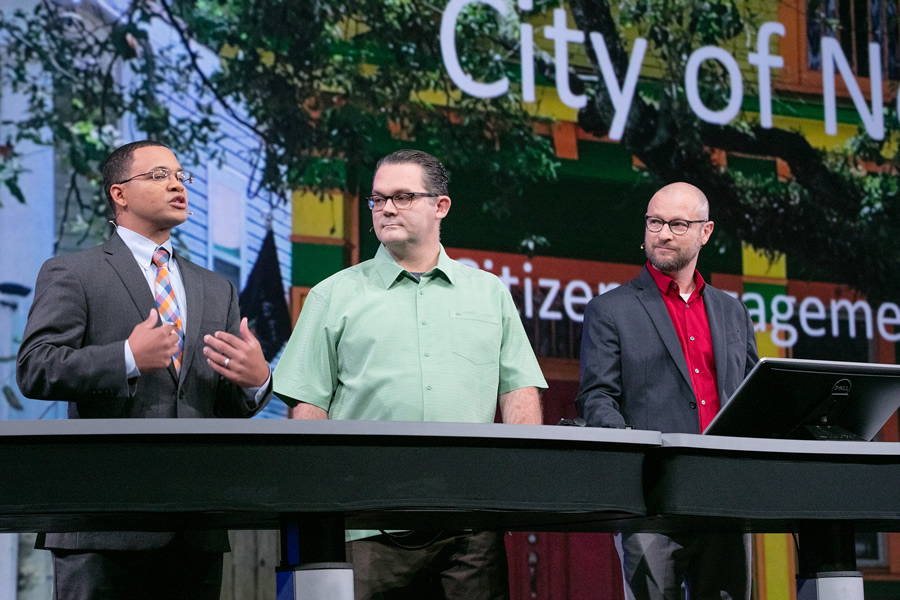
The City of New Orleans, Louisiana, is conducting similarly engaging projects—though with a bit of its own flair. In an effort to be extremely thoughtful about how the water-bound city uses its land, New Orleans—together with the community—built a map that uses soil permeability, wetlands, and historical flood zones to show areas where the ground is highly absorbent and likely not ideal for development.
“Using this map, we can think in completely different ways about how we build our environment and our neighborhoods,” Lamar Gardere, the city’s chief information officer, said during a presentation.
Gardere also exhibited the city’s BlightStatus crowdsourcing web app, which, in addition to educating residents about the blight remediation process, also enlists citizens to report blight. After collecting street-level photos of every parcel in New Orleans, the city created a short six-question survey that people can use to determine blight using photos of individual properties. Reporting whether or not there is a structure on the property; if the lot is overgrown; and if the walls, doors, or roof appear to be damaged, for example, allows both the city and citizens to get a better idea of where blight is occurring around New Orleans and what needs to be done to restore these areas.
“Running frequent surveys will give us a reliable layer of vacant lots and foundation type, giving us a sense of our housing resiliency,” said Gregory Hymel, the GIS director for the City of New Orleans. As he pointed out, having a baseline on blight before hurricane season helps New Orleans tremendously with recovery efforts.
Insuring a Smarter Future
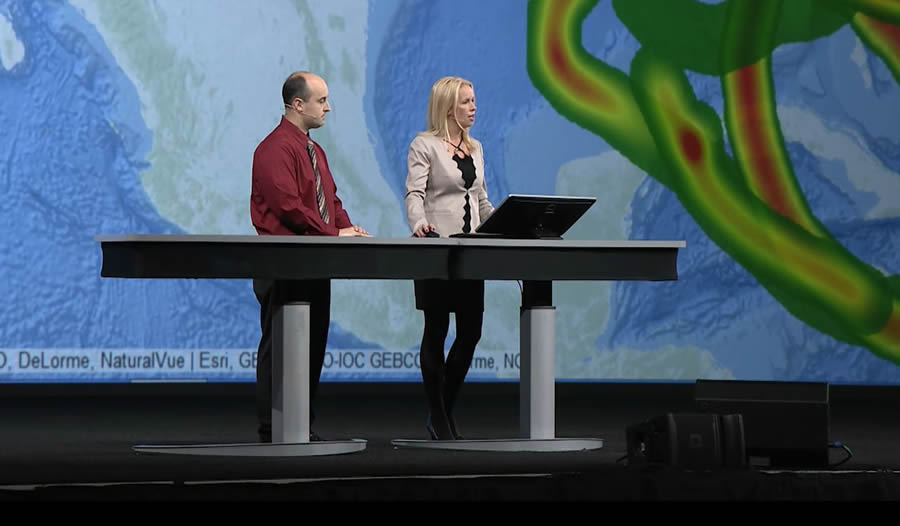
GIS also gives companies like Guy Carpenter, one of the world’s largest reinsurance brokers, the information needed to make smarter decisions. Guy Carpenter uses Esri ArcGIS to help its customers—insurance companies—manage claims and assess risk.
For example, Guy Carpenter used Esri ArcGIS to visualize what neighborhoods were impacted by the massive wildfire this spring and summer in Fort McMurray, Alberta, Canada. The fire destroyed about 2,400 homes and buildings and forced 80,000 people to evacuate from the area.
Shannon Peterson, a product manager for Guy Carpenter, showed web maps of neighborhoods hit hard by the wildfire. “We could even pinpoint individual homes destroyed by the fire,” she said. “With this information, insurance companies could focus on the homes that they insure, estimate their losses, prepare for expected claims, and put the resources in place to assist their policyholders.”
On a web map, Peterson also showed the path of an EF5 tornado that struck Joplin, Missouri, in 2011. Guy Carpenter provides its clients with a catalog of historic, mapped data that goes back 60 years and shows the relative risk of tornadoes in the United States. “In states where tornadoes are prevalent, insurance companies need to balance a mix of locations [for policies] they have across these high- and lower-risk areas,” Peterson said.
Bryan Adams, senior GIS specialist at Guy Carpenter, demonstrated the company’s GC AdvantagePoint, a web-based risk management application that uses Esri ArcGIS. “Bringing together GIS and our industry knowledge . . . we help our clients manage a concentration of risk through stunning visualization and powerful analytics,” Adams said.
Peterson added that insurance companies also use the application to evaluate locations before underwriting new policies. “Underwriters are able to see the concentration of homes they already underwrite in that area,” Peterson said. “Underwriters can also evaluate hazards around the area like terrorism targets, distance to coast, distance to fault lines, or other hazards as customized by the insurance company.”
Insurance companies that use GC AdvantagePoint can even get live data feeds to real-time information, such as wildfire perimeters, so they can monitor situations that might affect policyholders.
Another Smart Idea: Designing and Creating a Green Infrastructure
According to the American Society of Landscape Architects, nature can be infrastructure. A network of parks, forests, watersheds, wildlife areas, and wetlands can improve a community’s quality of life by doing things like improving air quality, reducing flooding, and creating better habitat for animals.
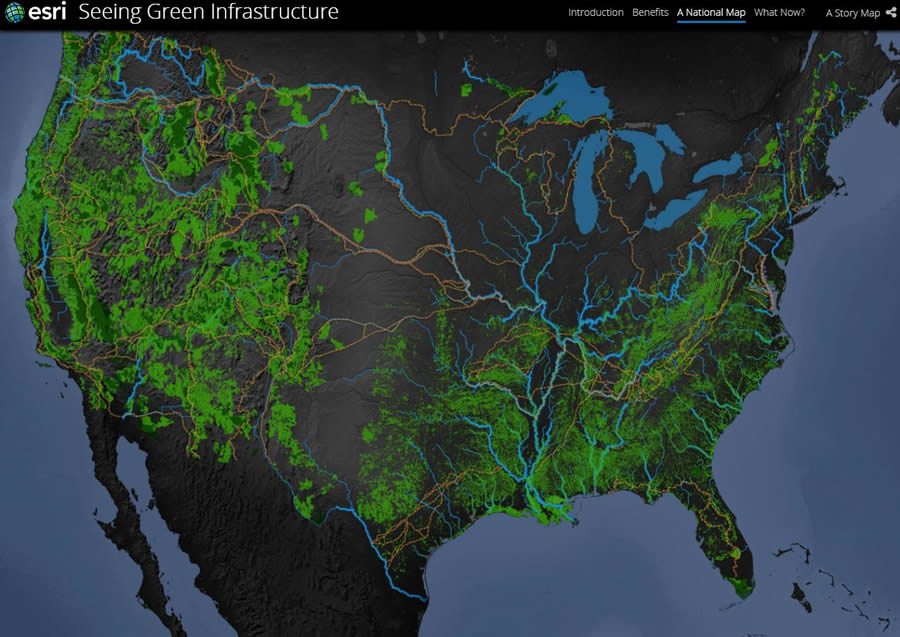
During the Plenary Session, Esri unveiled a new Green Infrastructure map, apps, and tools to help organizations in the United States start to design green infrastructure plans. The map includes all intact natural areas within the continental United States larger than 100 acres, regardless of ownership or preservation status. The map’s users can view land cover including forests, developed land, land cultivated for crops, herbaceous and woody wetlands, and barren and scrub land. They also can see the location of agricultural areas, ridges, and valleys.
“One of the visions initially was, ‘Why don’t we just make a green infrastructure plan for the United States?’ Doesn’t that make sense?” Dangermond said.
But since plans like that require community involvement and would need to be unique to each area, Dangermond said Esri decided to provide the datasets and other resources for others to use. “It’s a series of methods and a series of tools that [you can use to] craft your own plans with,” he said.
Arancha Muñoz-Criado, a landscape architect and urban planner from Spain who worked on the Green Infrastructure project with Esri’s Hugh Keegan, described the concepts behind it. The idea is to identify land with the greatest ecological, cultural, and visual value and conserve those areas before going ahead with development.
She showed design examples of how to connect the valuable land such as green spaces, rivers, public squares, and parks within an urban area and then make them accessible to the public.
“The concept of creating a network of green spaces is now [more] important than ever,” said Muñoz-Criado. “In a world where population has grown four times in the last century, fragmentation of the landscape has become the main threat to biodiversity and, therefore, to human life.”
Esri wanted to provide a national map, along with apps, to help organizations involved in planning to define their green infrastructure, said Muñoz-Criado. The map works at the regional, local, and urban scales, she said.
“Green infrastructure is about transparency. Everybody will know where the most valuable landscapes are before development occurs,” she said. “Having all your most valuable landscapes in one map—rivers, tributaries, critical habitat, wetlands, flat plains, prime agriculture—and connecting them to the city allows decision makers to identify how proposed new projects and urban growth potentially impacts existing natural resources.”
A Humboldtian View of Nature
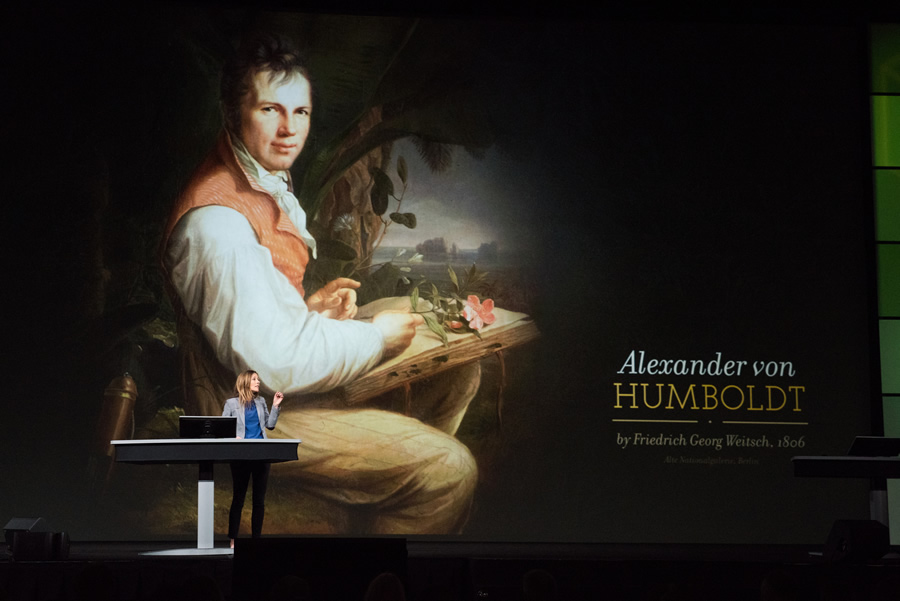
If he were alive today, Alexander von Humboldt would likely have been at the forefront of the green infrastructure movement. The Prussian scientist and naturalist, who lived from 1769 to 1859, spent his life studying and writing about nature. He explored South America and Russia, observing a diversity of plants, animals, and geology.
Andrea Wulf’s book The Invention of Nature: Alexander von Humboldt’s New World explores Humboldt’s views of nature “as a web of life.” She said one of his goals was to excite in people a love of nature.
Humboldt’s writings—including his seminal book Cosmos: A Sketch of the Physical Description of the Universe—greatly influenced a number of prominent naturalists, politicians, writers, and thinkers including Charles Darwin, Henry David Thoreau, and John Muir, Wulf said. The maps and infographics in these books and essays about science and nature include pioneering work in maps and infographics that foreshadow today’s GIS.
Wulf showed examples of maps included in Humboldt’s books, including one that focused on the transportation of precious metals around the world. Another showed the location of volcanoes and earthquakes, with green circles illustrating groups of volcanoes; green and red dots showing inactive and active volcanoes, respectively; and gray shaded areas displaying where earthquakes had occurred.
“[Humboldt] really is the founding father of what you are doing here,” Wulf said.
Wulf said Humboldt was a big believer in sharing scientific information with the public and collaborating with other scientists and scholars much like what Esri is doing today with the Living Atlas of the World and the Green Infrastructure map.
“He said that with knowledge comes thought and with thought comes power, “said Wulf. “His belief in the free exchange of information, in uniting scientists [and] in fostering communication across disciplines, remains an important pillar of science and communities today. And this is exactly what you are doing here. You are sharing all your knowledge and all your data with your Web GIS.”
Watch the Videos
Watch Wulf’s keynote address and other Esri UC Plenary Session presentations at the Esri E380 website.
