Are you are a scientist, GIS student, or GIS professional? Perhaps you work in another field and are just interested in spatial analysis, GIS for problem-solving, or the role of GIS in science? Then you might want to add these two books to your reading list:
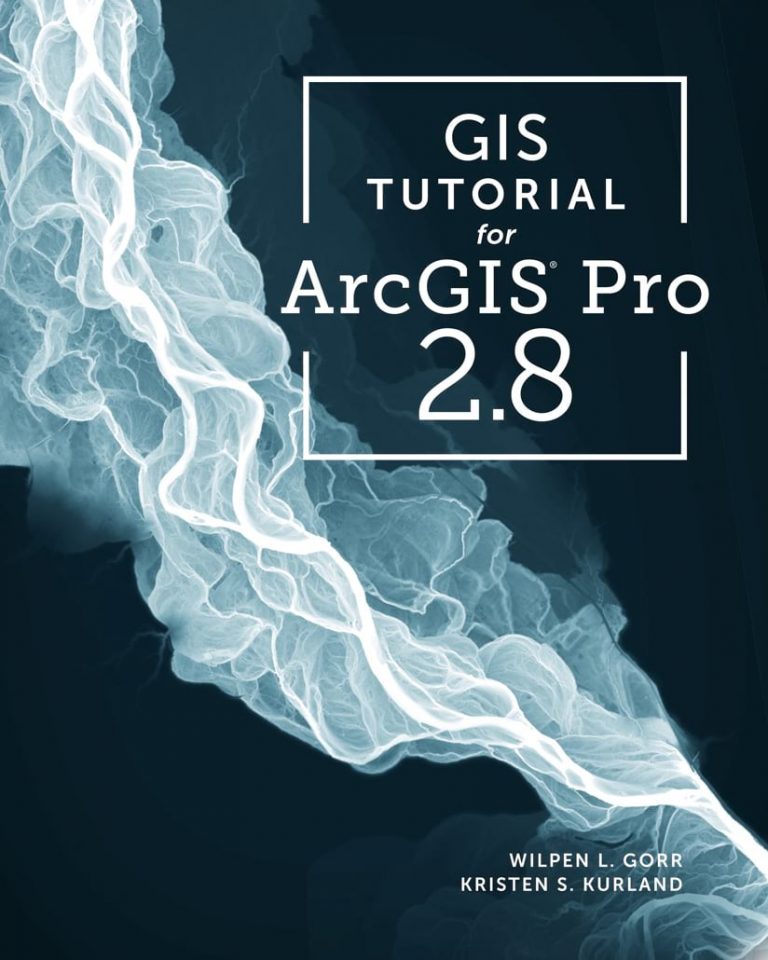
GIS Tutorial for ArcGIS Pro 2.8
Written for an audience that includes everyone from students to GIS professionals, GIS Tutorial for ArcGIS Pro 2.8 is the perfect introductory textbook on working with the ArcGIS Pro desktop application.
Authors Wilpen L. Gorr and Kristen S. Kurland provide clear, step-by-step instructions on how to use ArcGIS Pro to create and manage data, symbolize and design maps, conduct spatial analysis, generate 3D scenes, and share projects. In addition, the book covers ArcGIS Online and several other apps such as ArcGIS Collector, ArcGIS Dashboards, and ArcGIS StoryMaps.
The book also includes an updated chapter that covers the newly revised geocoding workflow and tools.

Readers will work with real-world data and scenarios in the tutorials. Assignments include the following projects:
- Digitizing buildings and walkways on a university campus using satellite images
- Locating farmers markets in a city to tackle the problem of food deserts
- Creating 3D models of city buildings using lidar data
- Building a system for scheduling and routing the teams that remove graffiti in a city
- Finding employment prospects in the arts field in American cities based on data such as average incomes, the cost of living, and the size of arts communities
Exercise data for the book, along with instructor and student resources, is available at go.esri.com/GISTforPro2.8.
Gorr is emeritus professor of public policy and management information systems at the H. John Heinz III School of Public Policy and Management at Carnegie Mellon University. Kurland is a teaching professor of architecture, information systems, and public policy at the H. John Heinz III College and School of Architecture at Carnegie Mellon University. They have authored many Esri Press books, including the GIS Tutorial for ArcGIS Desktop series.
(Print ISBN: 9781589486805, $99.99; ebook ISBN: 9781589486812, $99.99)
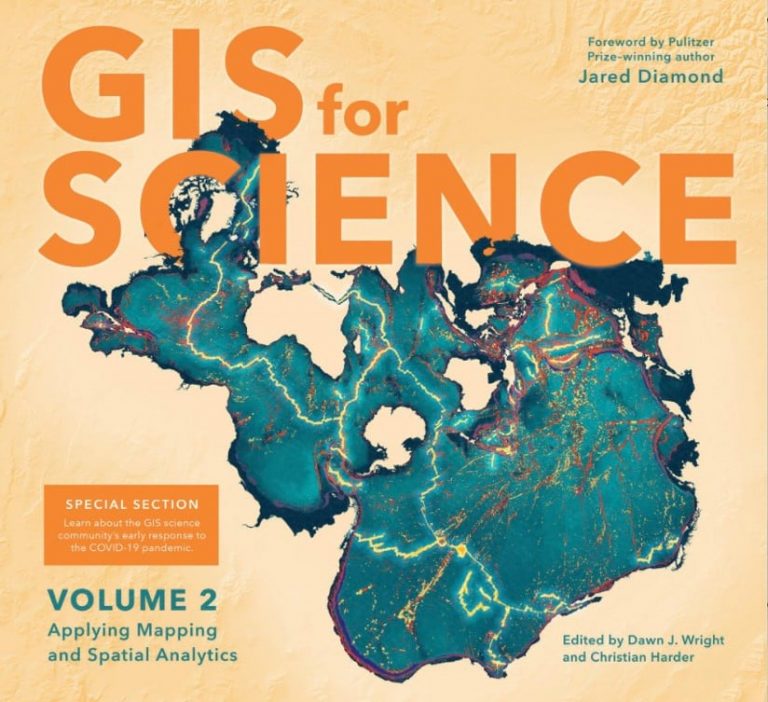
GIS for Science, Volume 3: Maps for Saving the Planet
In this new volume of GIS for Science, readers will find a collection of maps and case studies created by scientists who use GIS and related technologies in their mission to protect the planet. As part of their research and conservation strategies, they use GIS to do the following:
- Analyze spatial data on imperiled species and then map that information
- Identify which biodiverse areas around the world would benefit most from preservation efforts
- Analyze and map forest data and monitor the health of forests
- Determine which areas of the ocean should be designated as marine protected areas
Scientists and conservationists, along with others interested in how technology can be used to conserve nature, will be interested in the stories and maps in this book that were created using Esri ArcGIS technology and other spatial data science tools.

“A global mobilization [is needed] to identify and map the species that are at risk and not already safeguarded,” Esri president Jack Dangermond and Esri chief scientist Dawn Wright wrote in GIS for Science. “This effort involves action maps, as the Nature Conservancy calls them, to show us where things are and what we should protect, build, and invest in.”
Of note is the chapter called “Mapping Half-Earth,” which focuses on the Half-Earth Project, an initiative of the nonprofit E.O. Wilson Biodiversity Foundation. Launched by Edward O. Wilson, a renowned entomologist and university research professor emeritus at Harvard, the foundation advocates conserving half the earth’s lands and seas to protect 85 percent or more of the planet’s biodiversity with the aim of reversing the current species extinction crisis.
Aiding conservation decisions is the Half-Earth Project Map, a high-resolution digital map for visualizing the most biodiverse locations on earth and a decision support tool for determining which areas are best suited for conservation action.
GIS technology also is being used to help select marine protected areas such as the Motu Motiro Hiva Marine Park around Isla Salas y Gómez island in the Pacific Ocean off the coast of Chile, a project covered in one of the other chapters. And scientists at NatureServe, a nonprofit organization that provides authoritative biodiversity data for North America, created the Map of Biodiversity Importance based on a GIS analysis of the distributions of 2,200 species at risk in the United States, excluding Alaska and Hawaii. These imperiled species included freshwater fish and invertebrates, pollinators, birds, mammals, plants, amphibians, and reptiles.
“As technology has advanced, so has the power of NatureServe network data to inform biodiversity management and conservation decisions,” NatureServe chief scientist Healy Hamilton and director of spatial analysis Regan Smyth wrote in the book.
A companion site to GIS for Science, Volume 3: Maps for Saving the Planet, is available at GISforScience.com and includes digital data, stories, Jupyter notebooks, journal articles, videos, and interactive web maps. The website also includes links to the Learn ArcGIS lessons and blogs related to the practical uses of ArcGIS in each of the case studies.
Like the previous two GIS for Science volumes, the book was coedited by Wright, who is a geographer oceanographer and a leading expert in applying GIS in environmental science, and Christian Harder, a technology writer and information designer at Esri.
(Print edition ISBN: 9781589486713, $39.99; ebook edition ISBN: 9781589486720, $39.99)
