With rising awareness of methane and carbon emissions and their environmental impact, PureWest Energy—the largest natural gas producer in Wyoming—is making great strides in transparent reporting and accountability.
To make its corporate responsibility reports more accurate and detailed, beginning in 2022, PureWest created a version of its prior-year report using ArcGIS StoryMaps. Since then, the company has updated the ArcGIS StoryMaps story every year.
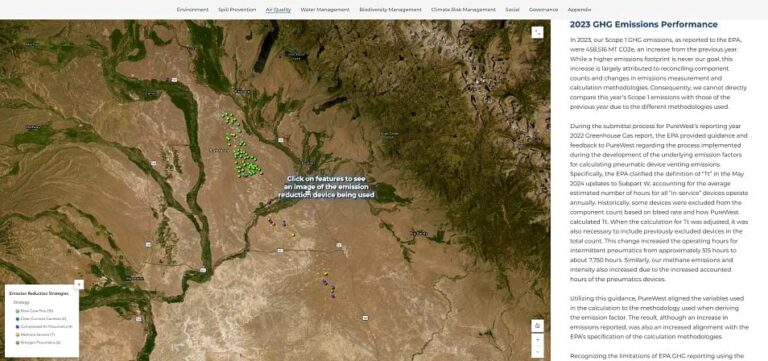
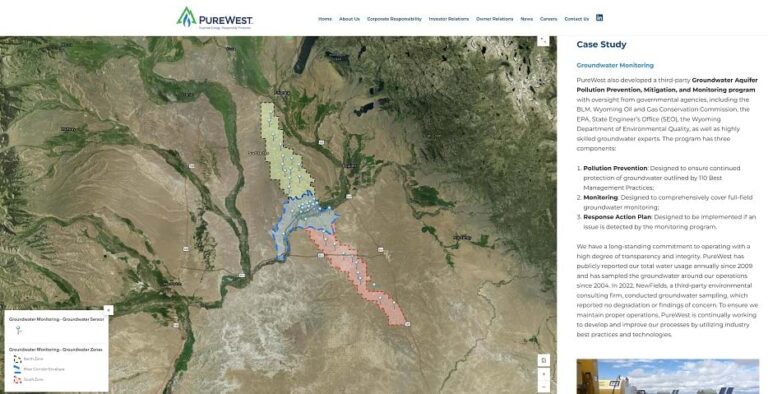
The ArcGIS StoryMaps version of these reports—previously available only as PDFs—includes maps, 3D scenes, embedded content, multimedia, and more. This approach transformed the company’s 2021 corporate responsibility report into a compelling and interactive experience that showcases emission details and conservation efforts. PureWest stakeholders such as investors, customers, and the public now have a deeper understanding of the company’s commitment to environmental responsibility and responsible business practices.

“Our industry and company are filled with people who care about creating sustainable solutions; but telling that story can be difficult,” explained PureWest senior vice president of corporate affairs Kelly Bott. With ArcGIS StoryMaps, Bott said, PureWest stakeholders “have access to the most accurate and up-to-date information to better understand our unique challenges and solutions.”
The Path to Building a Digital Story
With its commitment to positive and lasting environmental initiatives, PureWest wanted reports that accurately showed the company’s responsible and reliable natural gas production. This meant including contextual information such as case studies, images, maps, and explanations of how collected data affected operational processes and environmental stewardship. With this objective, the next step was to build the story with ArcGIS StoryMaps.
Although PureWest GIS manager Bobby Saleh had prior experience with smaller ArcGIS StoryMaps projects, the scale and impact PureWest envisioned required some help. Esri partner GeoMarvel and business consulting firm FTI Consulting joined with PureWest to create a framework and working template, and Saleh and his team—a GIS intern, an environmental engineer, and an environmental lead—collaborated to review details including icons, data sources, and approvals. Saleh created the map visuals, services, images, and web maps for embedding.
Saleh then used ArcGIS Online to republish the data for the external-facing ArcGIS StoryMaps story. He identified, collected, and mapped additional inputs such as high-resolution drone and satellite imagery, remotely sensed data, and government agency data in the GIS. Contextual examples addressed spill prevention efforts, groundwater monitoring, biodiversity management, and air quality and emissions.

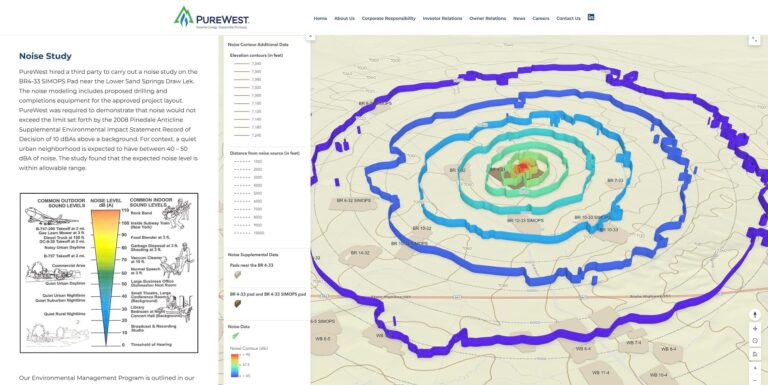
The story also highlighted a noise study conducted on a sage-grouse mating area in southwest Wyoming. This study guides drilling site placement to avoid disturbing the birds and exceeding noise limitations during mating season.

Finally, the ArcGIS StoryMaps story showcased PureWest’s achievements and improvement plans. For example, in 2022, PureWest reduced its average leak repair time. The company also openly addressed areas for improvement, such as a slight increase in emissions in 2022 compared to 2021.
“If we’re going to be transparent, that means having integrity. It’s got to be accurate and real, which means sharing the full picture,” Bott said.
Expanding Use of GIS
This GIS-based approach has led to broader GIS adoption across PureWest’s departments, such as using ArcGIS Field Maps to gather field information and increase safety awareness. PureWest is now looking to take location analytics to the next level by incorporating ArcGIS Velocity for field operations efficiency analysis, as well as for safety monitoring and planning.
The latest iteration of the story, which PureWest released in August, included some of the company’s larger initiatives, including working with a reclamation specialist and creating an interactive dashboard. PureWest also purchased a 360-degree camera for capturing imagery of its well pads.
PureWest plans to use GIS technology to collect data on where its emissions originate. This will help the company better identify solutions for reducing emissions, which PureWest plans to share in a future version of the ArcGIS StoryMaps story.
“I think people who have viewed [it] are experiencing these aha moments where they see how GIS can help with specific challenges, such as gathering and sharing field data, communicating worker locations, and assisting with overall spatial awareness,” Saleh said. “The story has helped influence some of the decisions made in the company.”

