A special relationship exists between remote sensing and GIS.
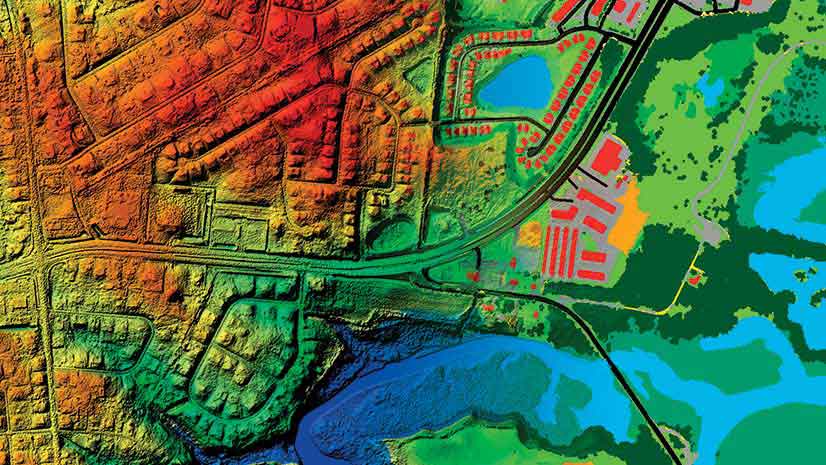
It’s a relationship that goes back to the very beginnings of modern GIS in the late 1950s and early 1960s. During those days, computer systems for GIS were big mainframes that were very expensive and very slow. The databases that GIS operated on were built primarily from imagery: either digitized maps that were abstracted from imagery or features that were digitized directly from aerial photographs.
Right from the beginning, imagery played a key foundational role in the creation of modern GIS. The two technologies co-evolved. The terrain and elevation data typically came from stereo image pairs. Roads, building, land cover, land use, and cultural features—even subsurface features like geology and soils—were either directly or indirectly inferred from remote sensing. GIS and remote sensing are like two sides of the same coin.
In 1972, a revolution happened with the launch of the first satellite of the Landsat system. This was the first publicly available earth observation imaging satellite. It continuously imaged the earth, capturing a new image of the same spot every 16 days. Because it was so high up, Landsat gave us an entirely different picture of the earth. It continuously refreshed that picture and gave us things we couldn’t see with our naked eye, such as thermal and infrared imagery, which gave us new information. The Landsat system was a real breakthrough because it not only gave us a new view but also a new vision of the possibility of what GIS could be.
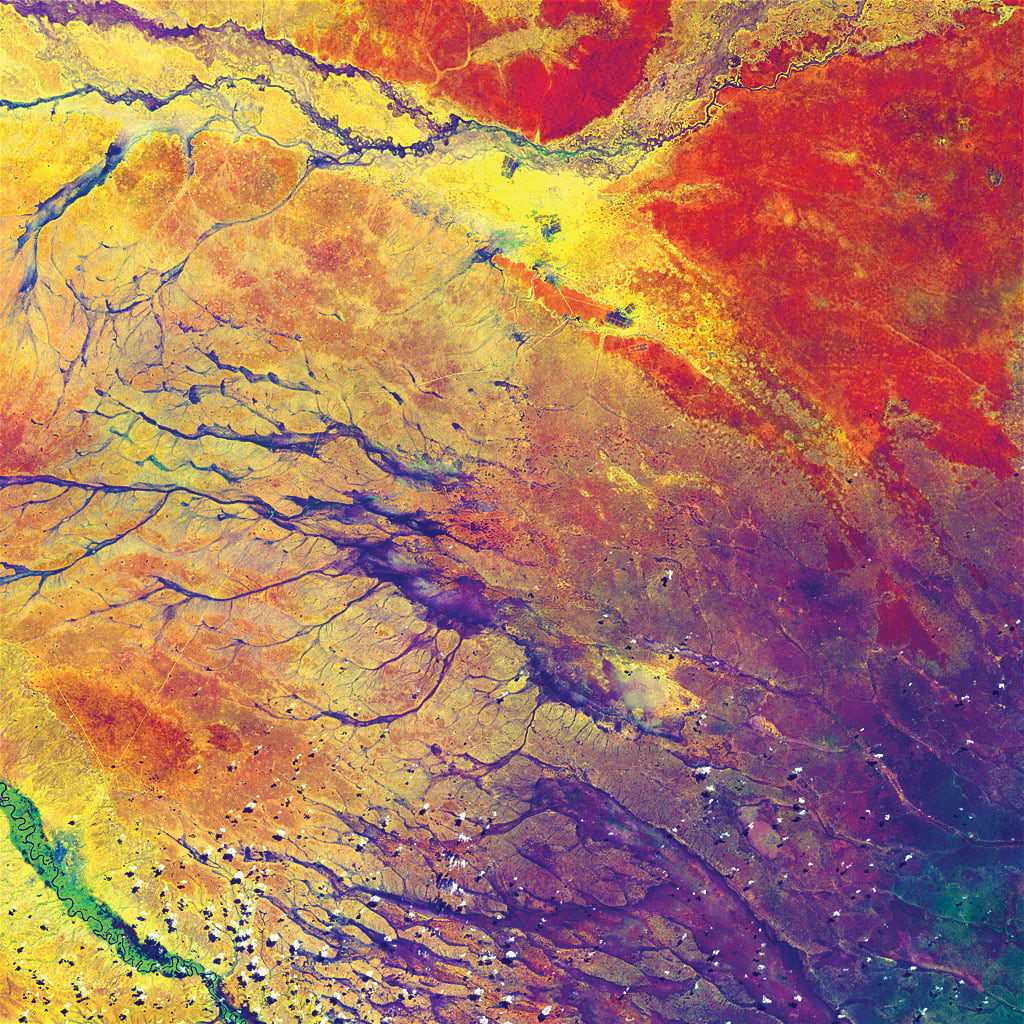
That system continues to be a workhorse today, led by the Landsat 8 satellite, as the overall Landsat program is now entering its forty-sixth year of continuous operation. Landsat started a revolution in commercial earth observation that continues today. The volume of remotely sensed imagery is now exploding with hundreds—and soon thousands—of small satellites, microsatellites, and video cameras in space.
There is a wealth of information—a whole host of secrets that are locked away inside remotely sensed imagery. We want to unlock those secrets and get information products—not just the data, not just the pretty picture—out of this imagery.
We want to answer difficult questions. Where are the healthy forests? Where are the sick crops? How much damage was caused by that earthquake or that tsunami? How do we get to that information quickly without being an expert?
Today imagery is fully integrated into a modern GIS, and the emphasis is on simplicity and speed. This whole trend toward simplicity is a very important one in GIS. Modern GIS is becoming much simpler and easier to use, and this is a very good thing.
A relevant example that illustrates how complex technology can be made simple and easy to use is the car navigation system. I like to call this the illusion of simplicity. Think about the car navigation system. It knows where you are. You give it an address and it just takes you there—gracefully. If you get lost or you don’t follow directions, it will growl at you for a minute, then recalculate and take you a new way. The benefit of this is you are never lost. You just hit the Home button and it takes you home. Society is no longer lost.
What we don’t see (fortunately) is all the technology in the background that makes this happen, which includes four of the most complicated technologies ever invented. The car navigation system requires a constellation of satellites orbiting a few thousand miles up that are triangulating with each other more than a thousand times a second and communicating with your car through the atmosphere. At the same time, the earth is moving, the satellites are moving, and your car is moving at a variable rate of speed. Your car’s precise location is dynamically plotted using advanced routing algorithms as it travels along a topologically structured vector network that is attached to a geodatabase that contains attributes that can be used to tell the location of the nearest gas station.
Luckily for us, this all works behind the scenes, and we don’t have to fight with it or become an expert. We get the benefits without having to struggle with the technology. This is what I mean by simple and quick. The future belongs to the simple and the quick.
Where is GIS technology going? GIS is now harnessing an amazing array of globally distributed sensors that is growing exponentially. Sensors are in everything. It’s like the “sensorification” of society. There are imaging sensors, full-motion video, microsatellites, drones, and big satellites. There are sensors in cars, thermostats, and ships. All this information is being harnessed together into what is popularly referred to as the Internet of Things.
The map of the future is an intelligent image.
This Internet of Things is an amazing collection of dynamic, live information streams that are feeding into GIS. You can think of these streams as arteries that feed the heart of a modern Web GIS. The heart of this new GIS is a geoinformation model that is taking the place of the previous generation’s central geodatabase, and it is based on the concept of distributed services. Although this concept is technically advanced, we can understand it in practice because we understand pictures. We understand something when we can see it. As Einstein famously once said, “If I can’t see it, I can’t understand it.”
Today, all previous constraints on dynamically processing massive collections of imagery and producing meaningful information products are rapidly falling away through the adoption of a services architecture that brings processing to the data, along with the development of the ArcGIS Enterprise platform and a family of advanced servers, including ArcGIS GeoEvent Server, ArcGIS Image Server, and ArcGIS GeoAnalytics Server.
With ArcGIS Pro and the ArcGIS Image Analyst extension, image analysts have an imagery analysis workstation (IAW) with the tools for interpreting and exploiting imagery and creating information products. The IAW has stereo and mensuration capabilities. It supports image coordinate space so the map is brought to the image instead of deforming the image by bringing the image to the map. ArcGIS Pro with the Image Analyst extension supports plotting points, lines, and polygons correctly on an oblique image. Access to raster analytics means jobs that are too big to ever be done on the desktop can now be handled in the cloud—true scalability.
Access to all these capabilities is bringing GIS to life. The static two-dimensional world of the past is transforming into a living, dynamic, active, understandable, motion-driven, 3D GIS of the future. We are seeing the opening of an entirely new chapter in the history of GIS, and geography itself is being reinvented. The ArcGIS Living Atlas of the World drives the creation of a living planet and the reinvention of the map as we know it.
The map of the future is an intelligent image.

