The number of homeless people in the United States—nearly 554,000, according to the US Department of Housing and Urban Development (HUD) annual Point-in-Time (PIT) count released in December 2017—rose for the first time since the onset of the Great Recession in 2007. HUD secretary Ben Carson said in a statement released with the report that, “This is not a federal problem—it’s everybody’s problem.”
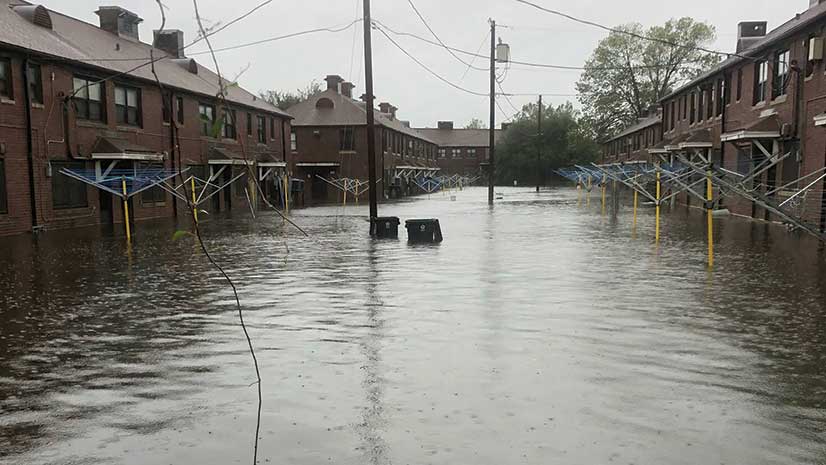
The substantial and increasing number of homeless people, especially in urban areas in California, Oregon, and Washington, is far more than a nuisance. Homeless populations that often congregate in encampments impact the infrastructure and economic viability of cities. This phenomenon threatens public health, taxes public works departments, discourages business, and burdens law enforcement agencies.
Like a natural disaster, this situation requires a rapid and coordinated response. Local governments have had to deal with growing homeless populations. In 2017, the City of Anaheim, California, declared an emergency over the hundreds of homeless people on its streets and encamped along a popular trail.
A complex problem with many underlying causes, contributing factors, and impacts that require the coordination of several government departments, the homeless problem can greatly benefit from the use of GIS. Using a geographic framework to integrate data, GIS makes relationships and dependencies apparent.
The City of San Diego, California, declared a state of emergency in 2017 when faced not only with a shortage of available shelter housing but also an outbreak of hepatitis A that caused 20 deaths and more than 400 hospitalizations. Because the outbreak was occurring predominately in the homeless population, the county, a longtime user of GIS, geotagged data on homeless populations to identify and deal with the outbreak.
Governments are adopting a life cycle approach similar to the one used for emergency management to address the homeless crisis. This approach employs GIS to use repeatable, successful patterns for the four phases of this cycle: plan, respond, mitigate, and recover. These phases encompass activities such as assessing the problem, understanding contributing factors, gathering and analyzing data, communicating with the public and decision-makers, planning and implementing strategies, and monitoring the progress and success of strategies. These activities can all be more effectively carried out using GIS.
Dealing with the Changing Face of the Homeless
There have always been homeless people, but that population has grown significantly and changed in composition. Underlying factors, such as lack of savings, lagging wages, the scarcity of affordable housing, inadequate public transportation, and the absence of health insurance, have both increased and diversified the homeless population. For at risk populations, these factors mean that life on the streets may only be a couple of missed paychecks away.
Consequently, according to the HUD PIP count, the homeless stereotype of the middle-aged, unemployed man has given way to a larger swath of demographic types: entire families, some employed but unable to afford a permanent home; victims of domestic violence; abused children; disabled or mentally ill people; substance abusers; and veterans. These are some of the new face of the homeless.

GIS helps cities and counties better understand the differing needs of this population, track its locations, and predict its movements and impacts. With a better understanding of who is homeless and where they are, local government can work on providing services and shelter for homeless and clean up camps.
Using a Data-Driven Approach
In the Municipality of Anchorage, Alaska, when homeless people set up campsites along Anchorage’s 250 miles of trails and 223 parks and greenbelts, they cause sanitation problems, discourage use of these areas by other residents, and attract crime. These campsites are also dangerous for the homeless people who inhabit them.
Anchorage’s Office of Economic and Community Development (OECD) is the agency responsible for improving the community’s economic vitality and enhancing the quality of life for residents. OECD worked with the coordinator for Housing and Homeless Services on Mayor Ethan Berkowitz’s staff to develop a comprehensive approach to solving the problem of camp identification and resource allocation to help people move from these locations to safe shelter and housing. The agency used ArcGIS to take a more holistic approach that incorporated the legal requirements of an abatement process, enhanced communication between agencies, and aided collaboration with the community’s nonprofit and private sector to begin addressing this serious problem.
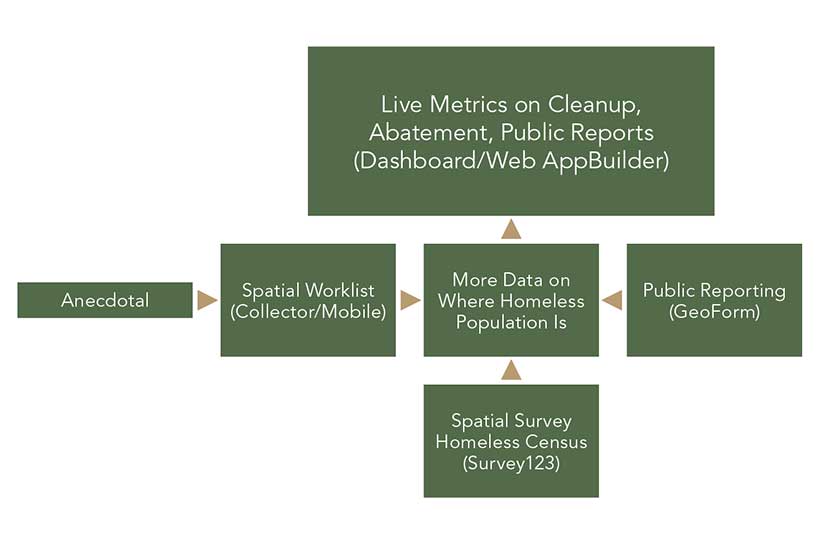
Initially, there were two efforts to increase data and understanding. The first effort involved increasing community participation and reliable input of data on where homeless camps were located to save police and cleanup time. The second effort was designed to increase coordination internally for agencies responding from the municipality to ensure that departments understood the workflow and activities. This resulted in more effective coordination with the community for homeless resource allocation. Collecting camp data and making it available in a dashboard was beneficial because it increased the ability to identify the likely locations of homeless persons to aid required homelessness count activities.
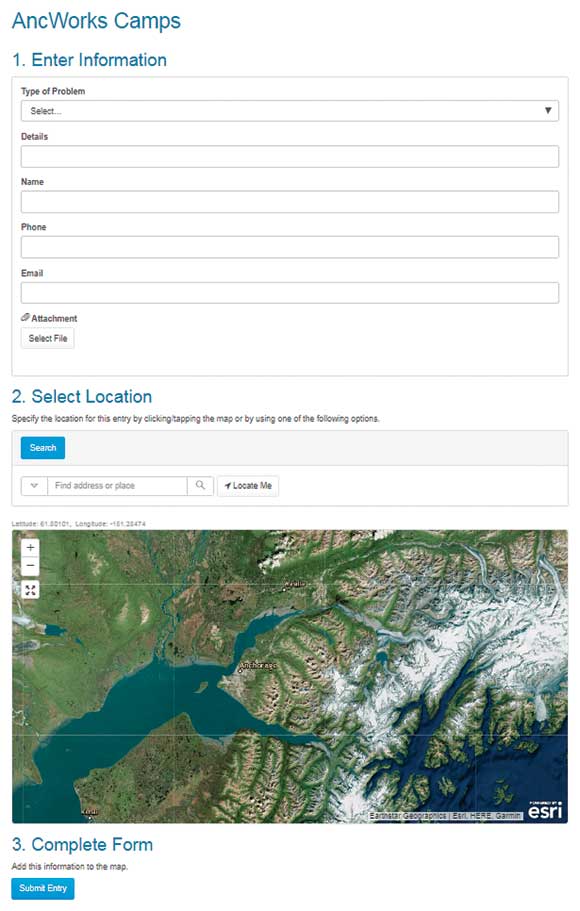
After fielding complaints about homeless camps in 2015, Mayor Berkowitz was looking for a way to increase public participation by providing a method for reporting homeless camps. An ArcGIS-based solution that used GeoForm replaced an initial and less useful address-based system. GeoForm let people reporting a camp drop a pin on a map so it could be easily located by Anchorage Police Department, Anchorage Parks and Recreation staff, and social services agencies. The result was #AncWorks, an interactive online tool for reporting homeless camps and other concerns.
The next enhancement was the development of a work process to help parks and recreation staff handle reports of camp debris, not only the increasing number of these reports but also the backlog. According to Tina Miller, the geographic information officer for OECD’s Geographic Data and Information Center, OECD developed a Collector for ArcGIS app as a better way to handle this backlog of homeless camp cleanup requests.
Camp abatement is a process, not an event. Challenges such as determining ownership of land—private, state, or municipal—and appropriate follow-up response is made easier with a dashboard. If the camp is on private land, the owner can be notified of the camp for follow-up. If the camp is on public land, the municipality proceeds with the legal process to give notice and remove the camp. Operations Dashboard for ArcGIS serves as an organizing tool for the legal proceedings and follow up coordination for social services resources. Instead of a stream of emails batted between departments, Collector and Dashboard allow Anchorage’s staff to track the status of camps throughout the abatement process.
This has aided communication between the police and parks and recreation staff who are involved in the abatement process. Using Collector has saved staff substantial time when locating camps and monitoring the abatement process. The data produced by these efforts has made both staff and the public more spatially aware and understanding of the abatement process. As the data has been fed back into the system, it has continually improved processes.
Taking an infrastructure management approach to solving one aspect of broader issues related to homelessness allows for a more refined approach. Combining tools and a multidisciplinary team allows Anchorage to evolve the questions it asks and produce additional results. Using Survey123 for ArcGIS, it has refined camp location information for the PIT counts in subsequent years, making those surveys more effective. The use of tools and increased cooperation provided the right environment for Anchorage Police Department Community Action Policing team to add two new positions in the unit for mental health and social services coordination. These positions now help lead community homeless outreach and provide support for persons with mental illness and disabling conditions in the homeless services systems. This resource allows police to become more effective in engaging people who are homeless in a way that helps them move to needed resources.
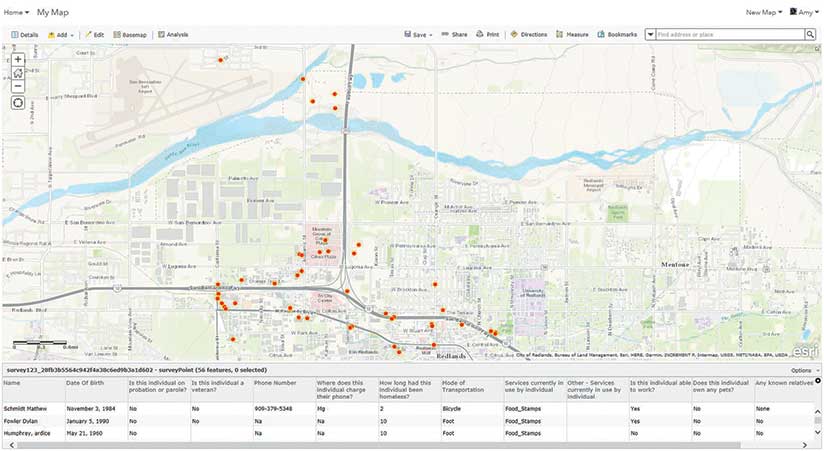
An additional benefit came from an increased ability to locate places where homeless persons may be encountered across the community. Anchorage participates in the HUD PIT count. By providing demographics on the homeless population to the federal government, it can apply for federal housing grants to fill gaps in housing capacity and social services needs. In 2016, OECD built a Survey123 app to make the PIT count easier to conduct. When Anchorage invited volunteers to participate that year, 190 residents responded. The app was so simple to use that these volunteers required virtually no training. After temporarily adding them to Anchorage’s ArcGIS Online account, volunteers were sent out to areas where camps had been reported.
According to Miller, much of the success of Anchorage’s approach has been due to its focus on the data needed to answer questions instead of application development. Now that Anchorage can assess the unsheltered homeless population and more efficiently handle cleanup, it can use the information generated to address other aspects of the problem such as the number of emergency shelter spaces, needed housing programs, and additional support and resources for homeless people to connect with housing.
“We have been able to take an agile approach using GIS, allowing us to change from our original direction without wasting any time or resources,” said Miller. By using a multiagency approach with police and parks and recreation departments, with policy support from the directors of these agencies and the mayor’s office, Anchorage has been able to begin implementation of a robust system of municipal land-use management paired with social services and opportunities for homeless people to move to safe locations and housing.

Decreasing Calls for Service
A county in Southern California also combines enforcement and support in a program enabled by GIS. The San Bernardino County Sheriff’s Department’s Homeless Outreach and Proactive Enforcement (H.O.P.E.) program, started in 2014, uses a proactive approach that is intended to ultimately reduce calls for service and other resources required to deal with the county’s homeless population. By linking homeless people, especially chronically homeless, with resources and service providers throughout the county, the program is designed to break the cycle of arrest, incarceration, and release.
By reducing the rate of recidivism and the costs associated with homeless-related crime, the program’s goal is to improve the quality of life for all San Bernardino County citizens, decreasing crime, saving taxpayer money, and helping the homeless transition from life on the streets.
The H.O.P.E. team, headed by Deputy Mike Jones, uses ArcGIS Online to share information in a controlled manner with other officers in the county sheriff’s 20 patrol stations and 11 police departments. Information sharing can be challenging in any jurisdiction that encompasses multiple law enforcement agencies, but it is unusually so because San Bernardino County is the largest county in the United States. Its more than 20,000 square miles are handled by the three members of the H.O.P.E team. The county has approximately 1,800 homeless persons according to the county’s PIT count for 2017. By creating the Homeless Contact Reporting Group, an ArcGIS Online group, H.O.P.E. has a platform that will allow it to securely share data between law enforcement agencies in the county.
Documenting contacts between law enforcement and homeless persons and any services provided to those persons is an important aspect of dealing with the homeless problem. ArcGIS Solutions for Local Government, which includes several solutions for the homeless problem, is available for free to organizations with ArcGIS Online subscriptions. The homeless solutions are maps and configurable apps that can help agencies count and monitor homeless populations, inventory homeless resources, and locate homeless services. These apps work with the ArcGIS platform including ArcGIS Pro, Survey123 for ArcGIS, Operations Dashboard for ArcGIS, and Collector for ArcGIS.
Before H.O.P.E. implemented the Homeless Contact Reporting app, this information was managed through a labor-intensive, manual process. Officers filled out information cards in the field for each contact. When they returned to the office, they then entered the data into one of about 30 different spreadsheets.
The Homeless Contact Reporting app, a configuration of Survey123 for ArcGIS, can be used to create a context-sensitive form for easily recording encounters with homeless persons. Not only does it aid in recording information about an individual or family and any services they may be receiving, but it also lists nearby available resources based on the current location. Photos and documents can be attached and uploaded with the survey form. The app is available for use on Android and iOS devices or in a web browser. Completed surveys can be sent if connectivity is available or sent later. The location where the survey was taken is mapped.
The app helps officers collect the data needed for funding, reporting, and response requirements and makes the data collected immediately available to other ArcGIS apps. The data can be queried using Homeless Contact Query and Data Download, a Web AppBuilder for ArcGIS app. Analytics can be run on this data using the Homeless Contact Analytics page.
For mapping homeless encampments, a Collector for ArcGIS configuration called the Homeless Encampment Reporting app can map where the homeless are congregating. This information can be used for locating and assisting people during disasters. Camps are symbolized by size and automatically geolocated, and text boxes are provided for descriptions of the area to aid the code enforcement and public works staff involved in camp cleanup. Any hazardous materials, biohazards, or pets present can be noted for other county staff coming to the site. The app can be used offline. Data can be uploaded when connectivity is available.
Homeless Contact Mobile Search will bring up a list of all matching contacts based on a name or partial name, furnishing location, contact, and survey information. The Homeless Contacts Dashboard accesses all data acquired from Survey123 or Collector apps. It is used by H.O.P.E. to provide an overview of contact with homeless over time and space. It can be searched by individual name, age range, timeline, location, or other characteristics. Once the data is queried out, it can be exported to a CSV file for use in other applications.
Using GIS to Collaborate on Everyone’s Problem
Addressing the homeless problem requires efforts across and between local governments and coordination with other government agencies and private organizations. It benefits from the kind of holistic approach enabled by ArcGIS. Using GIS to address homelessness will help cities work together to mitigate the health and economic impacts of homeless populations and help these vulnerable people get connected with services that help get them off the streets.
The homeless solutions and other ArcGIS Solutions for Local Government are configurable apps and maps. Available at no additional cost with a named user that is part of a ArcGIS Online subscription, they make collecting, organizing, analyzing, and accessing data on homeless populations simple but secure, since only the creator of a record can edit it.
For more information on these solutions and how to implement them, contact John Beck at or Chris Fox.
Better Serving the Homeless with Geographic Information Systems
Many organizations are using Esri's ArcGIS Platform to address common workflows used to identify at risk communities, count the homeless, establish strategic partnerships, share resources and conduct targeted intervention and outreach.
About the author