Erie Water Works Saves Hundreds of Thousands of Dollars with GIS-Based Implementation
Like most areas in the northeastern United States, Erie, Pennsylvania, is no stranger to aging infrastructure. The city’s water utility, Erie Water Works (EWW), regularly contends with harsh seasonal conditions along with varied pipe materials and inconsistent installations that have accumulated over decades.
EWW maintains 771 miles of pipe and replaces an average of approximately 2.5 miles of it per year, so keeping up with capital construction projects to repair and improve regional assets is already overwhelming. Add to that new construction and the need to accelerate pipe replacement so the infrastructure doesn’t exceed its useful life-span, and the utility needed to develop some new, more streamlined workflows.

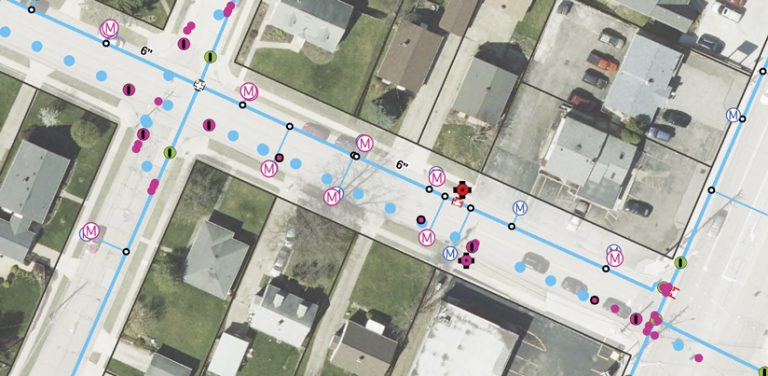
After almost 15 years of GIS use, EWW evolved its technology suite into a dynamic enterprise asset management system that correctly represents—at four-inch accuracy—all the water utility’s assets in GIS and recognizes various asset installations. The system has hundreds of related datasets, thou-sands of subfoot-accuracy features, and millions of attributes. EWW’s engineering department also implemented proper construction documentation to prepare preliminary digital surveys for construction projects, wherein all assets, landmarks, and other utilities need to be represented.
It took a lot to build this system, but the payoff has been immense. Combining ArcGIS software with the latest GPS and CAD technologies has saved EWW thousands of hours per year in unnecessary manual work and generated hundreds of thousands of dollars in total returns on investment.
Data Collection Processes Needed Updating
Since 2007, EWW staff members have digitized a century-and-a-half’s worth of water utility asset information using ArcGIS Desktop and ArcGIS Enterprise. To build a functional enterprise asset management system, though, the utility also needed to update its data collection methods. They were outdated and unnecessarily convoluted—especially when it came to recording assets at new construction projects.
Because EWW’s in-house engineering department was small and limited in scope, the utility typically hired consulting engineers to do most of the preliminary survey and postconstruction work for capital improvement projects. However, this resulted in disconnected workflows and lengthy, expensive business practices. For example, EWW’s own engineers were only able to extrapolate certain GIS layers to support the CAD basemapping and surveying that the consulting engineers did. If EWW inspectors collected any GPS data, it just supplemented the utility’s existing GIS data instead of being used to produce timely engineering drawings. What’s more, even though EWW staff members had to add any newly installed assets to the utility’s versioned geodatabase, they couldn’t do that until they had received the consulting engineers’ as-built drawings—and the wait time to obtain those often stretched to a year.
Given increasing demands for data, plus EWW’s growing use of real-time GIS apps, these workflows and timelines were unsuitable. To streamline productivity, EWW began piecing together the components to build a more functional asset management system.
Gaining Full, GIS-Based Coverage of Assets
After conducting a lot of research, EWW’s GIS staff decided to buy into the KeyNetGPS Virtual Reference Station (VRS) Network in Pennsylvania. Based on Esri partner Trimble’s VRS3Net app, this network of base stations provides continuous real-time kinematic (RTK) corrections and postprocessed data to all users in a particular coverage area. EWW installed a base station on top of one of its central pump stations, and that made the utility eligible to receive 5 percent of all subsequent subscriber proceeds, which is a substantial return on investment.
Having access to this VRS equipment allowed EWW to collect GPS data of its existing assets and newly installed infrastructure with four-inch accuracy. Additionally, the VRS provides GPS corrections and postprocessing in real time. That, coupled with the cloud-based GPS software that EWW implemented to load data directly into ArcMap, means that inspectors no longer have to offload the data from each GPS receiver. This turned a 30-minute process into one that staff members can do in under 5 minutes, saving the utility about 150–200 hours per year for this task alone.
Putting this more precise and expedient data collection process into practice demonstrated to the utility’s board members that using GIS and GPS technology is critical for keeping up with asset maintenance and expansion. The board approved EWW’s purchase of 10 additional Global Navigation Satellite System (GNSS) receivers, up from 1. Once the utility trained all its inspectors—both in-house and contract—to use the new technology, they were able to capture the exact location of installed assets, including water main joints, fittings, valves, fire hydrants, and service lines. Finally, EWW was getting full, GIS-based coverage of new and existing assets.
Engineering Work Gets Streamlined and Moves In-House
Now that EWW’s inspectors could provide consulting engineers with shapefiles that contained the asset information they collected during installation projects, the engineers could put together as-built drawings much more quickly. But this raised new questions: Why were consulting engineers still involved in producing preliminary surveys for EWW? And what would it take to complete postconstruction documentation in-house?

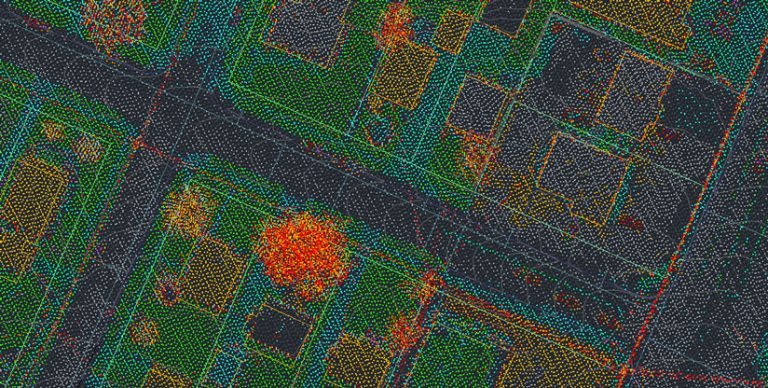
To allow EWW’s own engineering department to conduct preliminary surveys, GIS staff would need to be able to contextualize the utility’s assets. But the imagery that EWW had of its jurisdiction was 10 years old, and it didn’t include lidar data. So the utility paid for an aerial flyover of its service area to obtain survey-grade orthorectified imagery.
Upon completion of the flyover, GIS staff members used ArcGIS 3D Analyst to classify the LAS dataset by return elevation so the point cloud would render in 3D. This enabled EWW’s engineers to visualize project areas and digitally represent the interpolated features, such as buildings and vegetation, as layers in CAD basemap drawings. Incorporating these layers with cadastral information and the precisely located water utility data that EWW was now able to capture made it possible for in-house engineers to complete survey-grade as-built drawings as soon as installation was complete.
In addition, GIS staff members implemented ArcGIS for AutoCAD, which, for smaller projects, lets EWW engineers retrieve published map service data directly within the CAD interface they already use. This new, streamlined workflow saves each GIS staff member from having to manually export 14–20 layers per project.
At last, EWW was able to produce its own as-built drawings in a timely manner. This ensured that the utility could keep its asset data up-to-date. It also eliminated the fees that EWW was paying regularly to bring in outside engineers, saving tens of thousands of dollars per project.
New Goals That Were Previously Unfathomable
Staff members at EWW tested, improved on, and accepted the new workflows, which have now been in use at the utility for more than a year. As efficiency increased and staff members gained more confidence in the results, organizational buy-in for the enterprise asset management system improved.
Each step of the implementation process justified the next. The accuracy of the VRS equipment enabled EWW to obtain more GNSS units. This new workflow encouraged EWW to acquire lidar data of its coverage area to ensure survey-grade accuracy for reliable basemapping. And that made it possible to put together preliminary surveys and final as-built drawings in-house.
Now EWW’s goal is to replace 5–7.5 miles of pipe per year. This would have been unfathomable before implementing the GIS-centric enterprise asset management system and its accompanying workflows.


