In August, I was honored to become the executive director of the American Association of Geographers (AAG). The AAG works to sustain the pipeline of geographers from grade school to grad school, help geographers find jobs, and strengthen and protect the discipline in both policy and practice.
Geography sits at the confluence of people, place, and the environment and is essential to understanding and exploring the world. For geographers and GIS professionals, AAG serves not only as a bridge to academia but also as a champion for data use and access rights under federal policy and regulations. In addition, it facilitates discussion and progress on forward-looking issues such as ethics, human rights, and climate change.
Prior to coming to AAG, I worked as chief scientist at the National Audubon Society. My team often partnered with Esri on projects ranging from community science to climate change. I have spent much of my professional career working on climate and its impacts on people and nature. Conveying complex ideas in spatial terms, especially to the public, is the key to explaining—and then solving—many of the world’s most pressing problems. But the complexities of climate change can be challenging to convey to policy makers and the public. Fortunately, if a picture is worth a thousand words, a good map must be worth at least 10,000.
To show where climatic suitability exists for specific species, for example, one can combine species occurrence data with climatic variables to build environmental profiles. When these maps are made at the local level, the impacts can be explained in terms that resonate with a general audience. This is important because solving climate change requires governments to take action, since the scale of the problem necessitates spending at government levels. And getting governments to pass worthwhile climate change legislation means that people must vote and call their representatives with this in mind.
Let me tell you a story of how GIS was used to create climate science that inspired artists and the public.

After years of work with many collaborators, Audubon released its Birds and Climate Change report in 2014. (View a recently updated version.) Based on observations of birds over many years, Audubon built models of the relationship between climate variables and birds in North America. These results can be visualized as maps that look a lot like bird range maps for each species. The powerful part comes when future climate models get added to the maps and viewers see how much the range of each species shifts or shrinks. Such a strong visual format translates complexity into dramatic shifts that really get people’s attention.
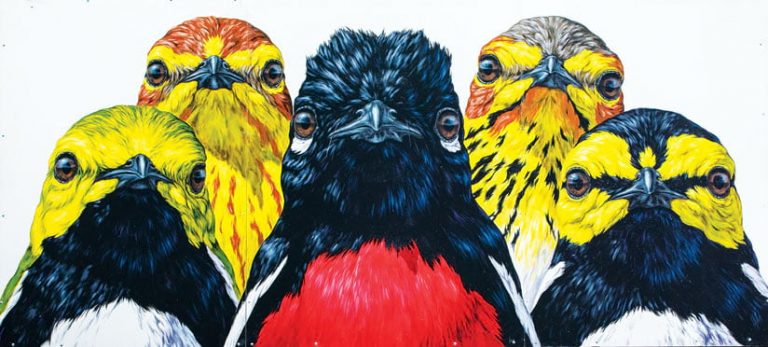
The press coverage for the report was overwhelming, but I was most surprised by the interest from artists and musicians. One example out of New York is now known as the Audubon Mural Project. In northern Manhattan, where famed bird artist John James Audubon resided for a number of years, local artists have converted public spaces into art. Numbering more than 100, the murals depict bird species at risk from climate change, as listed in the report. These murals pop up all over the neighborhood—on the sides of buildings, near subway entrances, and on storefronts. Recently, a similar initiative was launched in Chicago.
Audubon’s maps inspired artists, who now inspire the public. The integration of GIS, artists, and activism is a great example of how mapping and geography come together for the common good.
An organization like AAG sits at the confluence of academia, professional GIS, society, and policy makers; and partnering with Esri is a great way to accomplish goals. At AAG, I will focus on strengthening the pipeline of geographers from kindergarten through PhD programs and building up the discipline of geography. What’s more, I will ensure that every voice is heard.
AAG has dedicated employees working for its members and in service of geography every day. They have unique and compelling stories to tell as well, so this column will feature voices and perspectives from across AAG.
AAG is headquartered in Washington, DC, near Dupont Circle on 16th Street in a historic row house that we call Meridian Place. When Pierre L’Enfant designed Washington, DC, in 1791, 16th Street was known as the Washington Meridian, serving as a prime meridian for the United States. So our work comes From the Meridian—the new title of this column.
Next year marks AAG’s 50th anniversary at Meridian Place, and I look forward to restoring the library and showcasing this organization’s history. Stop by for a visit if you’re in town.


