For people who are blind or have low vision, the voice commands on common navigation apps—often coupled with other aids, such as a walking stick or guide dog—work wonderfully to help them get from point A to point B. But users of these apps typically miss a lot of context along the way.
“Navigation apps tell you that you have to go straight, or right, or left at the next corner. But is it a 60-, 90-, or 120-degree corner? What kind of street will it be—a narrow one for pedestrians or a wide one with a lot of cars?” mused Arend Jan van Dongen, a resident of Vught, the Netherlands, who is legally blind. “You don’t get that information from the navigation app. You need a map to get an overview of that.”
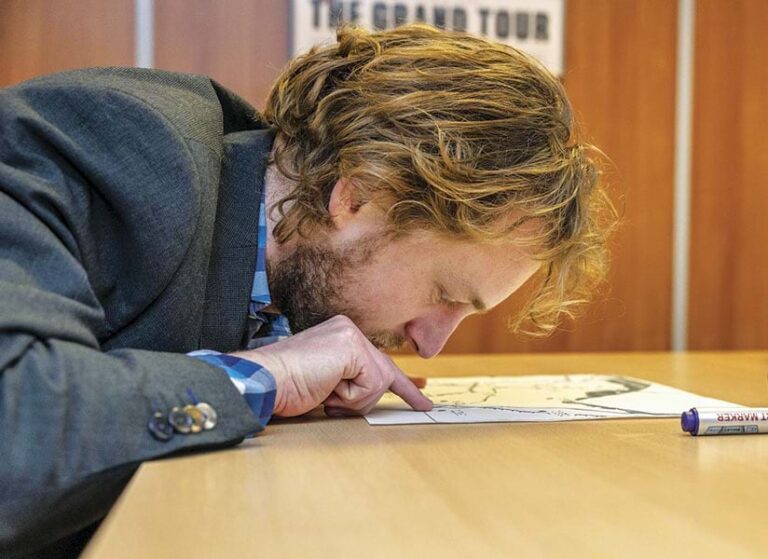
A spirited and swift-moving collaboration is underway in the Netherlands to give people who are blind or have limited vision regular access to tactile maps that can help them gain situational awareness of the places they go—whether they’re walking around their neighborhoods, traveling to the next town over, or taking a trip to a far-away city. The Netherlands’ Cadastre, Land Registry and Mapping Agency—known as Kadaster—is working with Esri Nederland (Esri’s distributor in the Netherlands), several local accessibility organizations, and a handful of universities and academics to use ArcGIS technology to produce maps on swell paper that people with vision impairments can touch to get overviews of neighborhoods, regions, whole countries, and the world.
The group wants to ensure that the maps are functional for a wide range of user needs and preferences—and that people with low or no vision can order the maps on demand, without the aid of a sighted person. The collaborators have also set their sights on reaching people beyond the Netherlands.
“Through ArcGIS Living Atlas of the World, we have data for the whole world available at several scales,” said Vincent van Altena, a research and innovation consultant at Kadaster. “The project group would like to make these maps available on demand for people everywhere, especially those who live in places with limited access to resources like this.”
“All visual media needs to be adapted for visually impaired people or people with reading disabilities for the simple reason that, first and foremost, they are people,” added Julian Nauta, the product manager for tactile graphics at the Dedicon Foundation, a nonprofit that reproduces texts and images in alternative formats and is contributing to the project. “For them to be able to fully participate in our very visual and image-heavy society, they need a way to understand images, read text, and experience maps.”
A Digital Solution Emerges
Although tactile maps are available for people who are blind or have low vision, they are often difficult and time-consuming to produce.
“Dedicon has been making tactile maps for a long time, but it has always been a manual process,” said Nauta. “When somebody calls and asks for a map of a certain country or area of their city, one of our illustrators starts drawing the area street by street, which, of course, is very labor-intensive. This means that we can’t make very many maps per day, per year.”
Six years ago, van Altena was representing Kadaster at a conference and encountered Anna Vetter, an Esri Switzerland intern at the time, who had used ArcGIS technology to make a tactile atlas of Switzerland. Van Altena was interested in her work and asked her to send him the data and project files so he could try creating something similar with Dutch data. He didn’t have time to pursue the project immediately, but a few years later, when van Altena was working with Daan Rijnberk, who was then an intern at Kadaster, the idea resurfaced.
The two of them got in touch with Bartiméus, an institute for the visually impaired; the Accessibility Foundation, an organization that focuses on digital, physical, and social accessibility; the Dedicon Foundation; and the Swiss Library for the Blind and Visually Impaired. These organizations helped them conduct focus groups with people who are blind to discover how tactile maps could aid them in their everyday lives.
Nauta recalled one user at an early focus group saying that he once took the local railway line to go to a hardware store in a neighboring village. A few days later, the person took the rail line again to visit a home electronics shop. He realized that the two stores were near each other and said that, if he had known this earlier, he would have visited both shops during his initial journey.
“We sighted people, when we navigate to a place, can immediately see everything that’s around that destination,” Nauta said. “Up until now, visually impaired people couldn’t really do that, except with the handmade maps that Dedicon produces but can’t produce in large enough quantities.”
A New Way to Gain Context
Working with Esri Nederland, van Altena and Rijnberk used ArcGIS Pro, along with data from Kadaster and ArcGIS Living Atlas, to make some maps. Rather than taking days, it took them about 20 minutes to put together each prototype.
“We produced tactile printable maps of neighborhoods, as well as maps of the Netherlands that provided context, such as provincial capitals and the way railroads run through the country,” said van Altena.
The team then carried out usability testing with people who are blind or have limited vision. Ellen Zieleman, one of the testers, said she was astonished the first time she felt one of Kadaster’s tactile maps of the world.
“With one finger, I could cover the Netherlands, and I needed both hands to get an idea of Russia’s size,” Zieleman said in a video produced by Kadaster that highlights her experience as a map tester. “My worldview has been enriched because I now have the same access to knowledge that other people have.”
When van Dongen tested the tactile maps, he did so in Zwolle, near Kadaster’s office.
“I was able to recognize the area, but I also saw things on the map that I didn’t know,” he said. “With a map made in the correct way, you can get a good overview of a situation and use it to orientate yourself in daily life. … For instance, when I’m on holiday, I like to know the surroundings of the hotel or apartment complex where I’m going to stay. Or if I have to go to a hospital, I can get an overview of the corridors and how the different parts of the hospital are situated so I can more easily find my way when I’m there.”
Through testing, the team learned that people largely want to use the maps to figure out how cities and neighborhoods are laid out, where stores are located, and what routes are available for getting around. One woman, who lost her sight several years ago, wanted to know what the new mall in her community looks like.
“She knows what her neighborhood used to look like, but she doesn’t know what the mall looks like—and she goes shopping there frequently,” said Niels van der Vaart, head of product management and innovation at Esri Nederland. “She asked us to create a map of the mall so she could get a sense of how it’s laid out.”
Van Altena believes that the spatial awareness provided by these maps can go beyond people’s immediate, day-to-day needs as well.
“The maps can also hopefully give users a better understanding of society and specific situations—within their own cities, but also on a more European and even a global level,” he said.
The Challenge of Data Filtration
Just as sighted people can adjust digital maps to their liking—by zooming in to a particular area or filtering the layers so they only show buildings or vegetation—people who do not see with their eyes need to be able to create their own maps.
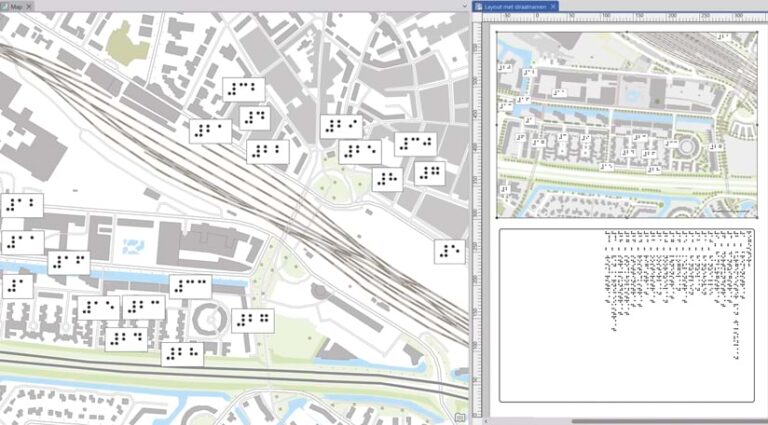
“The most important thing is that you can decide what you want on a map,” said van Dongen. “For me, when I enter a [train] station, I want to know if I’m entering the front or back of the hall. Other people may not care about that.”
Data filtration is particularly challenging when producing tactile maps because of how little information can be put on each map.
“Because people who are blind use their fingertips to explore maps, they need space between the structures, patterns, and lines to be able to distinguish them,” said van Altena.
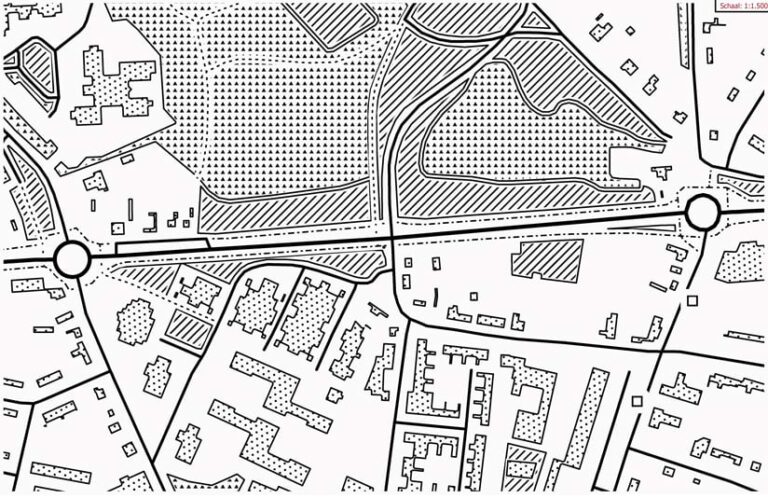
“To be able to feel a line, the minimal thickness of it needs to be about three-quarters of a millimeter,” Nauta explained. “To distinguish a line from a slightly thicker line, that second line has to be almost twice as thick. And to be able to determine where one object ends and the next begins, there needs to be three or four millimeters of space between them.”
In aiming to make these maps as accessible as possible, the team is using letter-sized swell paper that works in laser printers. The maps get printed in black ink, and then the paper is placed in a small oven (which looks like a laminator) that activates the paper’s chemical coating. Within seconds, the ink expands upward to a uniform height. The result is a map that people can feel with their fingertips.
Because the surface area of the maps is so limited, the team is experimenting with how to present information on the tactile maps.
“We’re trying to figure out how many different symbols someone can distinguish with their fingers, what symbology we should use, and how many layers of information we should present,” said van der Vaart. “Do we first present a map with just roads and then present a second map with roads and buildings, or do we start with a map with a lot of information on it and then give people a map with less information?”
How Tactile Map Symbology Works
The team is still grappling with those questions. But right now, the first map that the team makes for users is a base layer that only shows the waterways, railways, and roads in an area.
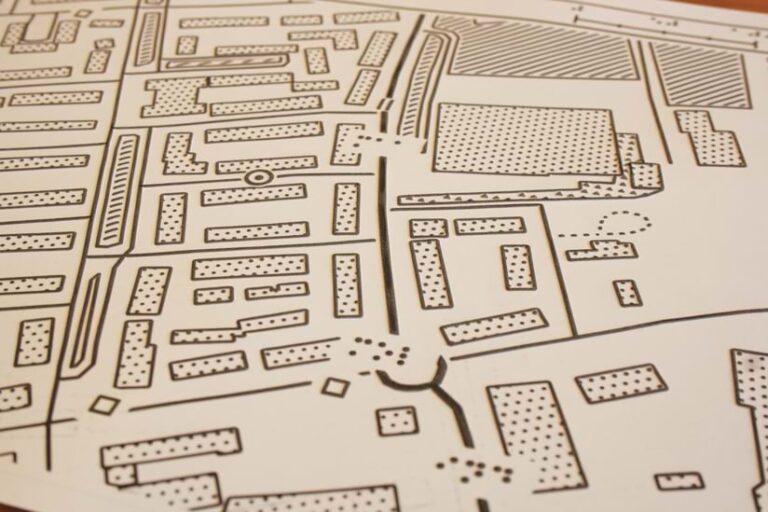
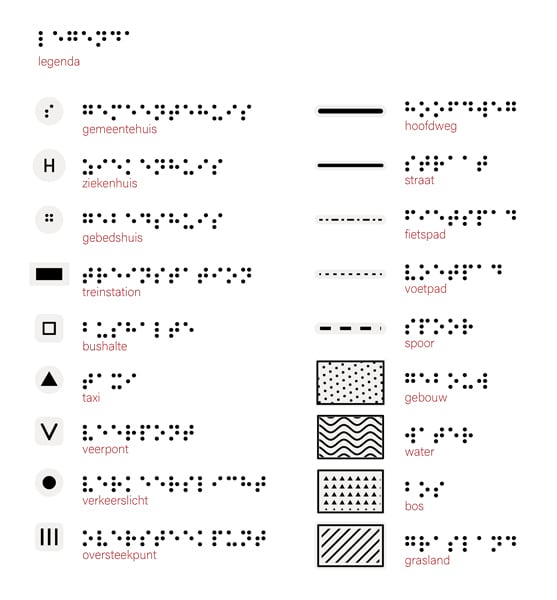
Footpaths are delineated by a dotted line with short dots. Bicycle paths are lines in which every other dot is three times as long as the others—so, a one-millimeter dot, then a three-millimeter dot, and so on. There’s different symbology for roads that are largely for cars, as well as for highways. If a road allows cars and bicycles, the map just shows the symbology for a car-based road because it would be too crowded to display the symbology for both.
From there, users can build their own accompanying maps. Say someone wants a map that shows restaurants and public transit stations. A second page in a set of maps might contain roads and restaurants, and a third page might show roads and transit stations. Or perhaps all three could fit on a single map if there’s enough space between symbols.
“The maps also have an anchor point on them so users can orient themselves and figure out where particular locations are, based on that spot,” said van Altena.
Although there aren’t any worldwide standards for tactile map symbology, the group is working with researchers who study tactile symbols while continuing to employ the best practices that organizations like the Dedicon Foundation and the Accessibility Foundation have developed.
An Entirely Autonomous Process
The next step in the project is to create a system that allows people who are blind to request—and even build—the maps themselves, without help from others.
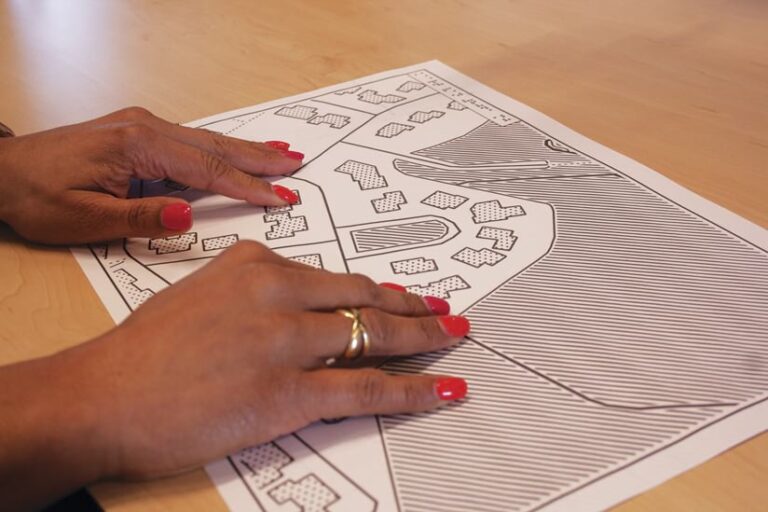
“We’re working on a process to let people order the maps online,” said Aafke van Welbergen, an expert on inclusive and user-centered design at the Accessibility Foundation. “It’s very important to not only have the maps exist but to also allow people to order and use them autonomously.”
“We are looking at building a web-based dissemination system, and we want to see how this could tie into the ways that people who are blind already get information—through Dedicon, for example,” said van der Vaart. “For the web development part of this, we are thinking of using ArcGIS Maps SDK for JavaScript to create not only the map-ordering mechanism but also the dynamic legends that we want to use in the maps.”
Once the team gets the whole process of making, ordering, printing, and using tactile maps to be autonomous, project participants hope that they can extend their work to other organizations—and to people in other countries.
“We want to take our proof-of-concept designs that show how these maps can be made using national datasets and ArcGIS Living Atlas and share our knowledge with other organizations and national mapping agencies,” said van Altena. “We are looking to collaborate with more people so we can continue to build on these ideas.”
