City Uses Geoanalysis and Maps to Gauge Impact of Recession-Driven Decisions
When economic pressure presented the City of Santa Barbara, California, with difficult budget decisions, leaders searched for ways to save money, and that included examining fire department expenses.
The Santa Barbara Fire Department protects 100,000 residents spread across 26 square miles. It maintains eight fire stations providing all risk services. The agency protects urban interface, freeway corridors, community colleges, an active fishing and recreational harbor, miles of beaches, a growing airport, a nearby forest with hiking trails, urban wine production, and more.
“Like many municipalities, we were faced with a challenging economy,” says Michael Hoose, city fire captain, who has worked in public safety since the late 1980s. “Early on, the fire fighters association targeted many ways to reduce costs, including concessions, and thus provide substantial savings to the city. The city administrator tasked the fire chief with a significant reduction.”

One proposal that initially looked feasible involved closing one of the city’s oldest fire stations. Surrounding fire stations appeared to be close enough to provide sufficient service if the one station were closed.
However, Hoose, who had been using ArcGIS since 2006, understood that analysis was necessary to determine the civilian, cultural, and economic values at risk by the proposed closure, as well as whether or not fire fighter safety would be compromised. “I knew that GIS would be able to tell us all the safety and protection implications,” Hoose says.
Four-Minute Response Time
The National Fire Protection Association (NFPA) recommends a four-minute maximum response time for 90 percent of all calls. That means the time from when the first 911 call comes in to the time the first responder arrives for structure fire, traffic collisions, or emergency medical service (EMS) calls. Santa Barbara had an excellent record of meeting this standard.
The question was, if the centrally located Station 3 was closed, could the fire department continue to meet the standard? If this were possible, millions of dollars would be saved.
Providing Fact-Based Answers
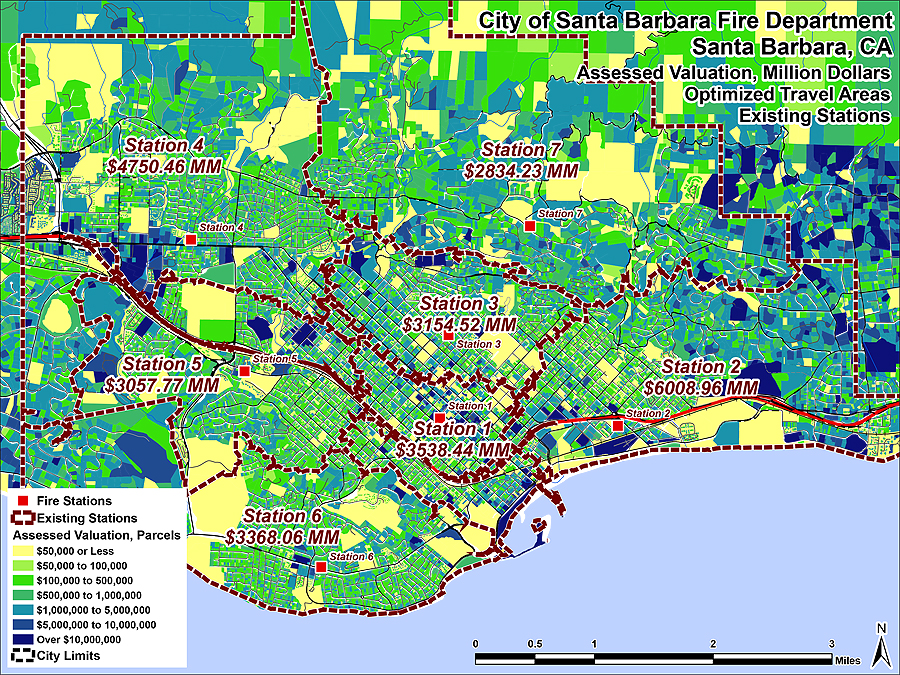
Hoose worked with public safety GIS consultant Mike Price to perform a geographic data-based study of incident call times throughout the city. ArcGIS was deployed to explore different variables and produce data-driven maps. The maps were used to show assessed values, number of structures protected per engine, number of residents protected per engine, response times in various conditions, and more.
“Each map told a story of what would happen if Station 3 was closed,” Hoose says. “We could show by multiple variables how each remaining station would be impacted.”
Both Hoose and Price also looked at the distribution and concentration of response times and the department’s ability to continue to meet NFPA requirements and American Heart Association guidelines on response.
The GIS analysis was clear: shutting down the fire station would prohibit the agency from achieving its previous high standard of 90 percent of calls responded to in four minutes or less. The impact would be significant for the entire city. Dozens of maps were generated and presented to city officials. After careful consideration, the decision was made to keep the fire station active.
“We were able to demonstrate that the proposed closure would result in a lapse in proper coverage,” Hoose says. “GIS not only helped us with the analysis, it also helped us present the information using a compelling, easy-to-understand method—maps. We provided quick-snap views using industry-standard best practices and methodology.”
For more information, contact Michael Hoose, fire captain, City of Santa Barbara Fire Department.

