Finland is one of the few countries in the world where there are separate tax rates for a residence and the land on which it sits. The tax on the structure is based on its replacement cost, while the land tax is based on its market value. Currently, the nominal tax rate for structures varies between 0.41 and 2.0 percent, while the tax rate for land ranges from 0.93 to 1.9 percent.
But this system of property taxation, which was introduced in 1993, is out-of-date. So the government of Finland is reforming property taxes, revising both its valuation methods and property tax values. Based on the current schedule, the new values will be published in 2023.

Key to this property tax overhaul is the National Land Survey of Finland (NLS), which has been tasked with determining new land value zones throughout the country. To perform the complicated analyses required to redo a whole country’s property tax system, the team at NLS is relying heavily on ArcGIS Pro and ArcGIS Geostatistical Analyst. According to Arthur Kreivi, chief expert at NLS, incorporating these powerful geospatial tools in conjunction with classic statistical modeling methods has sped up the reevaluation process and improved the quality of NLS’s work.
“The old valuation system used for taxing land was very outdated,” said Kreivi. “For example, the land value zone maps, on which we base our property tax, were made more than 20 years ago. The new methodology we have developed provides far more accurate land value estimates. The process combines an intensive use of market information; traditional hedonic models, which calculate property values; and spatial analysis.”
The team at NLS that is designing Finland’s new land value zones uses ArcGIS Pro extensively to develop and maintain what’s called the Value Zone database.
“ArcGIS makes it easy for us to analyze both point- and area-based data,” said Kreivi. “We also use it to create thematic maps, as well as [meet] other mapping requirements.”
The methodology for the new property valuation system is divided into four steps: collecting data and checking its quality; calculating the Constant Quality Price (CQP), which corrects price changes on properties in relation to an established baseline; performing GIS analysis; and calculating unit values and premiums.
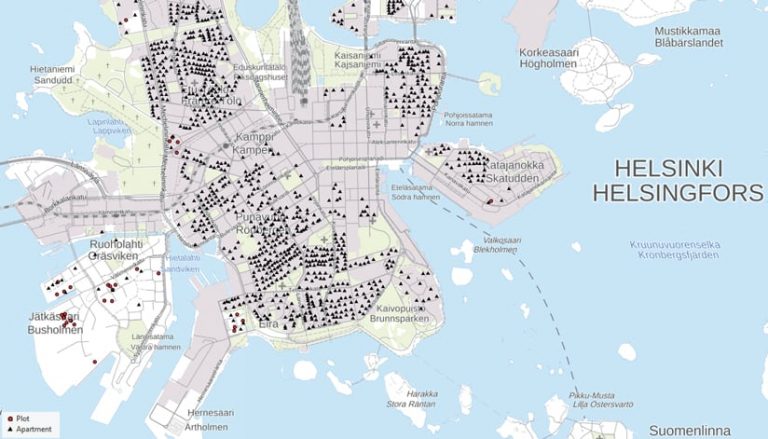
To determine a property’s value, team members primarily use data collected from public registers, although in some cases, they employ nonpublic databases that are maintained by taxation authorities. Three different types of price data—plots, detached houses, and apartments—are then used to estimate the value of land. Before the data is exported for use in the Value Zone database, it undergoes extensive preprocessing for standardization.
Team members then use the hedonic model to produce the CQP. The results of this part of the process include the location of a property, its price point, and its CQP value.
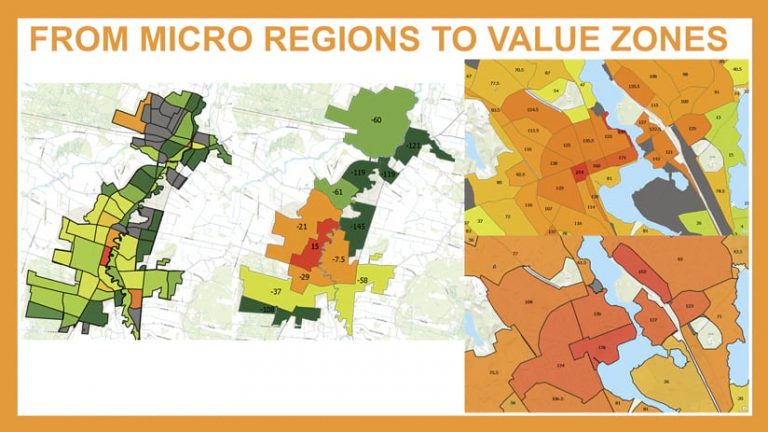
The GIS analysis that the team performs is based on the results of the hedonistic model and the formation of microregions. A microregion is created by combining elements from the NLS’s topographical database—such as roads, waterways, railways, and city plan areas—to create a small area of land in which real estate transactions take place. The team then calculates the median CQP of the price points for land and residences in each microregion, producing a preliminary land value zone.

“Land value zones are formed by combining microregions as a starting point. Thus, they are very similar [to one another],” Kreivi explained. “The most significant difference, of course, is size. Microregions are small areas that may not include many real estate transactions. The aim is to make the largest possible homogenous land value zones. These zones must be large enough to obtain a sufficient number of transactions to obtain accurate appraisal data.”
Another method of analyzing price data that the team at NLS uses is empirical Bayesian kriging (EBK), a geostatistical interpolation method that automates the most difficult aspects of building a valid kriging model. For this, the team employs Geostatistical Analyst, which automatically calculates parameters by grouping subsets of data together and performing simulations. According to Kreivi, this allows the team to quickly determine how real estate prices vary in different areas.
The final part of the analysis involves doing a mix of standard hedonic regression analysis and spatial analysis to identify the property sales in value zones and calculate the weighted median, or mean price of properties, in a value zone over a specified period.
“The calculation gives more weight to the plots compared to other data sources,” said Kreivi. “Newer sales also get more weight. By combining all of these analyses, we form the final land value zones and related maps on which the land values and taxation [are] based.”
Using ArcGIS technology to help create Finland’s new property valuation methodology has been immensely successful, according to Kreivi.
“It allows our land value zones to be produced more quickly and effectively compared to traditional real estate appraisal. A team of 10 professionals can now estimate the land value of approximately two million properties in one year,” he said. “Implementing spatial analysis as part of our property tax valuation process has increased efficiency and improved the quality and accuracy of our evaluations. In modern property tax systems, such as ours, GIS plays an important role both in the valuation phase and in providing information to the client.”

