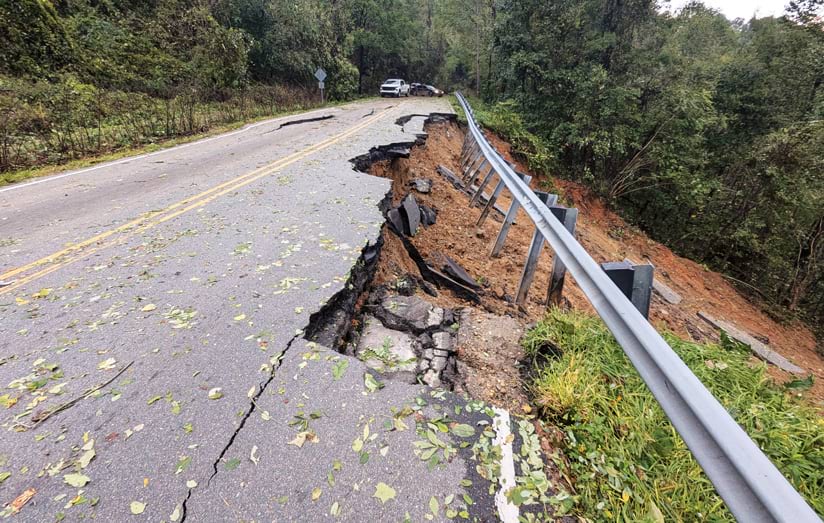
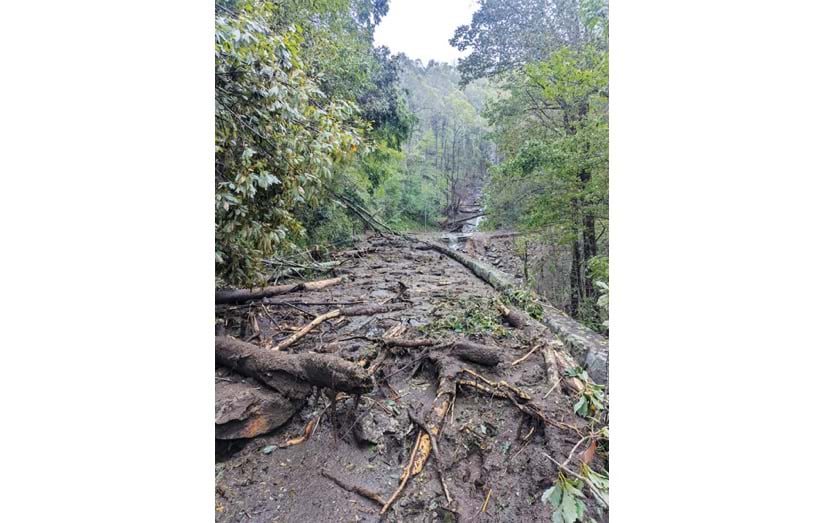
Hurricane Helene, which struck Florida in September 2024 with 140-mile-per-hour winds, caused extensive damage and progressed northwest into North Carolina and Tennessee. It ranks as one of the costliest and deadliest US storms since Hurricane Katrina in 2005. Helene claimed at least 232 lives, with damages estimated at $87.9 billion and broader economic impacts reaching $200 billion across six states.
Helene posed unique challenges as it brought torrential rain and wind to mountainous terrain. This phenomenon, called orographic uplift, occurs when air is pushed upward over geographic features, causing it to cool and release additional precipitation. Record-breaking rainfall led to catastrophic flooding in cities such as Asheville and Boone in North Carolina. The hurricane washed out roads and bridges, downed power lines and cell towers, and triggered landslides that cut off entire communities.
In Helene’s early days, much of North Carolina was disconnected. It was crucial to know where people needed help, where there was damage, and which roads were closed. Agencies used GIS to collaborate and allocate resources effectively. Three days before Hurricane Helene hit Florida, Esri’s Disaster Response Program (DRP) was activated, anticipating the needs of agencies and GIS users in the hurricane’s path. Over three weeks, the DRP responded to more than 170 requests for assistance from various groups involved in relief efforts, including government agencies, utilities, companies, and nonprofits.
The Worst Natural Disaster in North Carolina’s History
Hurricane Helene’s extensive impact across North Carolina posed significant challenges for disaster response and recovery efforts. North Carolina governor Roy Cooper told state lawmakers in October 2024, while unveiling his request for $3.9 billion to help pay for repairs and revitalization, “It is no exaggeration to describe Helene as the deadliest and most damaging storm ever to hit North Carolina.”
Days prior to the hurricane, Daniel Madding, IT manager for application development and GIS at North Carolina Emergency Management (NCEM), collected quantitative precipitation forecasts from the National Weather Service. NCEM’s GIS team put this data into a Python script that compares it to the National Oceanic and Atmospheric Administration’s (NOAA) Atlas 14 data, which shows precipitation frequency information for the United States.
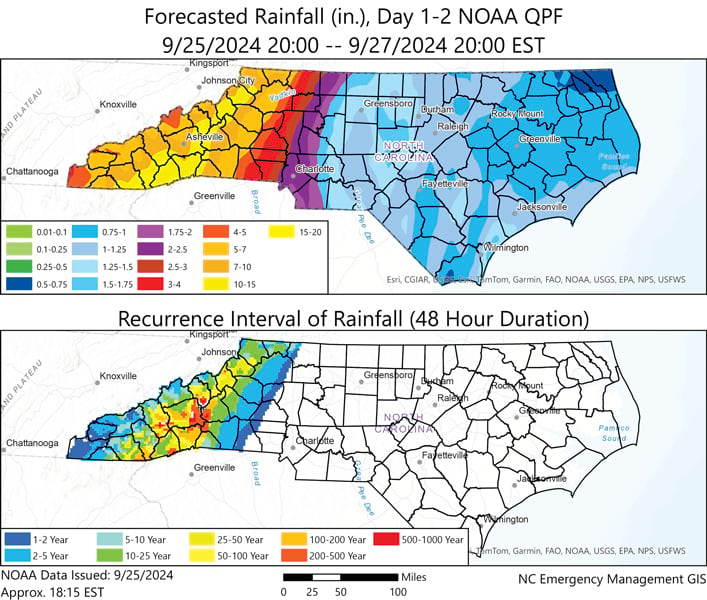
The team saw rain recurrence intervals that corresponded to 100- and 500-year rain events. Although a 100-year rain event does not directly correlate with a 100-year flood event, the GIS team used this data to strategically position search and rescue teams in areas predicted to have the highest likelihood of rainfall and flooding.
In addition to sharing their high-risk-area projections via the state’s GIS LISTSERV, Madding and his team hosted a just-in-time training for local GIS professionals on NCEM’s Flood Inundation Mapping and Alert Network (FIMAN). This web mapping tool shows decision-makers which rivers may experience significant flooding and which buildings and roads could get inundated. The team also demonstrated the North Carolina Department of Transportation’s (NCDOT) Resilience Analysis Framework for Transportation (RAFT) tool, which assesses flood risks for roads and bridges.
All this forecast data was crucial to positioning emergency management teams—including swift-water rescue personnel, urban search and rescue teams, high-water clearance vehicles, and National Guard assets—in areas expected to be heavily hit. Two days before Helene even crossed into North Carolina, search and rescue teams were pulling people out of harm’s way.
Throughout the hurricane, GIS team members employed GIS to ensure public access to crucial data, helping prevent delays during the crisis. They used GIS to identify and map isolated communities and directed local GIS professionals to the DRP program to ensure that software licensing and cost did not inhibit response efforts.
After the hurricane, the team collaborated with search and rescue teams using the Search and Rescue Common Operating Platform (SARCOP). This GIS-driven technology captures search and rescue workflows by taking data recorded with ArcGIS mobile apps and stored in ArcGIS Online and pulling it all together in an app built with ArcGIS Experience Builder. This collaboration helped collect more than 64,000 damage assessment points that were displayed on a dashboard for easy access. NCEM also used maps to facilitate supply deliveries in mountainous areas. Additionally, NCEM deployed GIS professionals to 10 of the most affected counties to improve data sharing and support local counties that lack GIS personnel.
The NCEM GIS team was able to respond the quickest in areas where it already had relationships with county emergency managers and local GIS staff. Madding strongly encourages GIS professionals to build relationships with staff at emergency management organizations before a crisis arises.
“During a natural disaster, GIS professionals will be called in to help local emergency managers, so it’s good to get an understanding of their data and needs beforehand,” Madding said.
A Coordinated Response from the Department of Transportation
In the days before Hurricane Helene made landfall as well as over the days that followed, NCDOT relied on GIS to manage preparations, response, and post-hurricane recovery.
Raquel Bensadoun, the geospatial services supervisor at NCDOT, said the department had been preparing for a storm like Helene since Hurricane Florence in 2018. She and her team created more effective tools for emergencies like hurricanes, including templated dashboards in ArcGIS Dashboards that combine important data such as weather radar and hydraulic gauges.
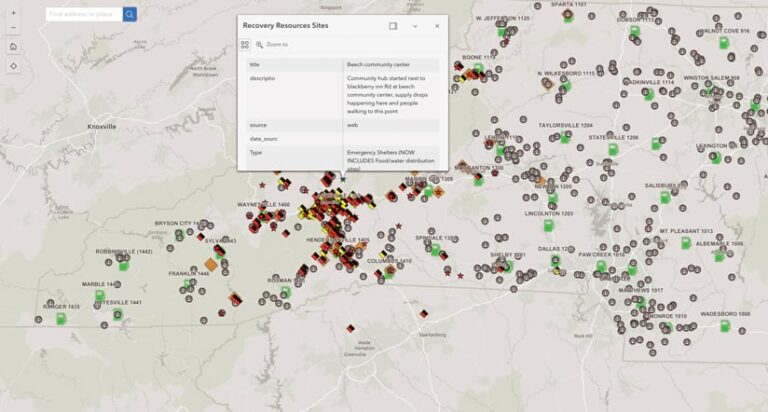
“One of the key lessons we’ve learned…is that having templates in place that can be easily configured for a particular event is crucial for these emergencies,” said Bensadoun. “In this case, it allowed us to get a storm response website running quickly instead of asking each other what we wanted to show [to people].”
To work with other agencies, the GIS team used ArcGIS Survey123 to create damage and debris survey templates that were repeatedly adapted and enhanced. NCDOT staff were trained to inspect bridges, culverts, and roadways and complete the surveys within 48 hours of a storm.
The GIS team also has an ArcGIS Online training program for NCDOT staff and partners. And the team created a process to quickly add new users to its ArcGIS Online organization. During Hurricane Helene, 559 new users were added, including staff from local, federal, military, and private organizations, who all shared and collaborated on data.
To prepare for the hurricane, Bensadoun and her team contacted the Esri DRP. Through the program, NCDOT staff got help from a team that answered questions, offered advice to speed up services, and temporarily increased data storage to accommodate more users accessing GIS services.
“At one point, we had a million people hitting our ArcGIS Online services simultaneously,” shared Bensadoun. She credits Esri’s partnership as a crucial part of NCDOT’s coordinated response.
When Hurricane Helene arrived, NCDOT staff faced huge issues, especially in western North Carolina. Power outages meant residents and rescuers had no communication, and debris blocked roads.
“It was really hard to gauge situational awareness,” Bensadoun said. “We weren’t even sure if NCDOT personnel were OK at some points, with reports of entire homes being washed away.”
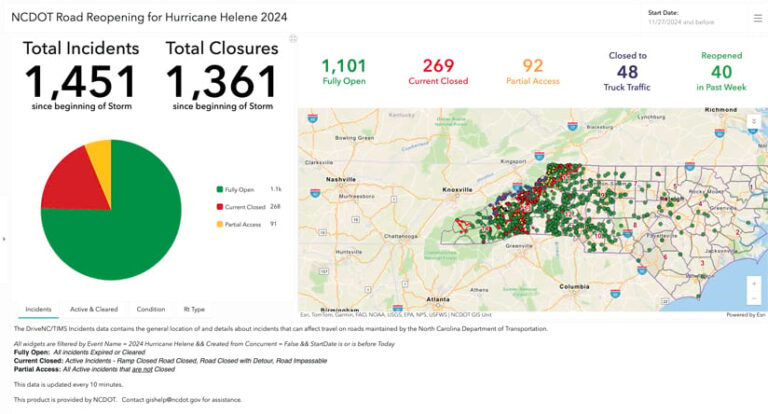
The department quickly adapted by first enhancing DriveNC, its official traffic information system. It introduced a GIS layer called the pink zone, which marked no-drive areas in the places most impacted by the hurricane. Initially, this layer—which was displayed on DriveNC and shared with platforms such as Google Maps and Waze to alert travelers—covered more than 20 counties in western North Carolina. Throughout the course of the storm, the department also continued to improve its Microsoft Azure functions that transfer data from DriveNC to public-facing dashboards built with ArcGIS Dashboards. This ensured that DriveNC and other web services were in sync and displaying data that matched.
In the days that followed the hurricane, travel restrictions were modified as NCDOT received drone imagery and damage reports. NCDOT staff used ArcGIS Pro and ModelBuilder to modify the pink zone layer to reflect the new information. This included identifying which roads were passable; which were restricted to emergency services; which had truck restrictions; and which were cleared for travel.
Post-hurricane, NCDOT GIS staff supported recovery efforts by creating visualizations of before-and-after scenarios using ArcGIS Instant Apps and images from the photogrammetry team. They continue to assist the department’s Statewide Operations Center with handling information requests, building maps and dashboards, and conducting data analysis to boost rebuilding efforts and develop process improvements based on lessons learned from the event.
Mapping the Way Home
When 48 hours had passed without contact from his parents in the aftermath of Hurricane Helene, Esri senior account manager Sam Perkins embarked on an arduous 11-mile hike to ensure they were OK. Perkins’s parents, both in their 70s, live in a remote mountain town known as Little Switzerland, an hour’s drive from Asheville.
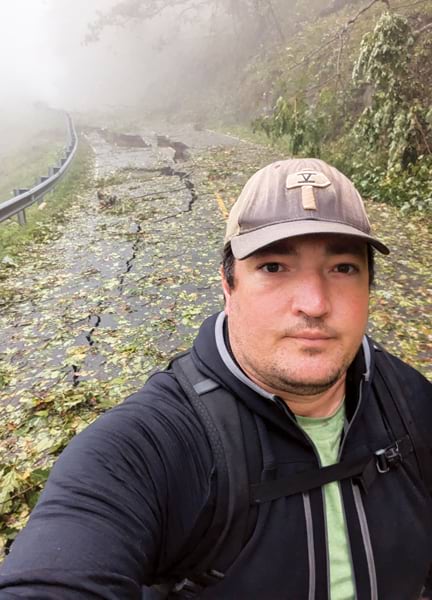
Navigating through what he described as “postapocalyptic conditions,” including destroyed roads and downed trees, Perkins overcame these fraught challenges using his expertise in geography and GIS. “I made sure I had offline maps downloaded so I knew where I was,” he said. “I knew the progress I was making, and that was very comforting. That gave me a lot of confidence to keep going.”
During his hike, Perkins grew increasingly concerned about the damage and residents’ isolation from resources. He didn’t just observe the destruction; he actively helped with recovery efforts. He used his skills to take geotagged photos to contribute to the state’s damage assessment.
Finally, after hiking up 2,200 feet in elevation through debris, Perkins arrived at his parents’ home to find them “OK but surrounded by devastation,” he said. “I had never been so relieved to see everyone.”
Perkins continues to be inspired by technology’s role in his home state’s long-term recovery. He created a map of all the choose-and-cut Christmas tree farms in North Carolina, since the area is a major source of Christmas trees for the United States. He is also working on an ArcGIS StoryMaps story of his favorite businesses between Asheville and Boone. These projects aim to revitalize the Little Switzerland community—a place Perkins feels a deep connection to—by attracting tourists and encouraging people to support the local economy.
“This happened right before leaf season, far and away the biggest tourist months,” he said. “You have to think about these people who survived the storm—and now they don’t have their livelihoods.”
